KELLTONTEC Price ActionKellton Tech Solutions Ltd (KELLTONTEC) is currently trading around ₹23.9, showing a slight recovery with a 0.84% gain in the latest session. The stock has seen a decline of roughly 21% over the past year, with a 52-week low of ₹19 and a high of ₹35.5. Market capitalization is approximately ₹1,168 crore.
Technically, the stock trades below its 50-day and 200-day moving averages, signaling short-term weakness, but the recent bounce suggests some accumulation near support levels. Resistance is noted near ₹26–27, with support around ₹23. Volume levels remain decent, showing moderate participation, while indicators like RSI hover near neutral zones.
Fundamentally, Kellton Tech reported earnings per share (EPS) around ₹1.68, and the price-to-earnings (P/E) ratio stands near 14, reflecting a reasonable valuation compared to peers in IT-enabled services. The price-to-book ratio is about 2.18, and dividend yield remains negligible. Overall, earnings growth has been steady but subdued, with moderate margins and manageable debt.
In summary, while the stock shows signs of tentative recovery, a sustained breakout above ₹26 is needed to confirm upward momentum. Investors should watch support near ₹23 to manage downside risk. The longer-term outlook depends on consistent earnings improvement and broader sector momentum.
Trade ideas

KELLTONTEC Price Action## Kellton Tech Solutions Price Analysis (August 2025)
### Price & Market Metrics
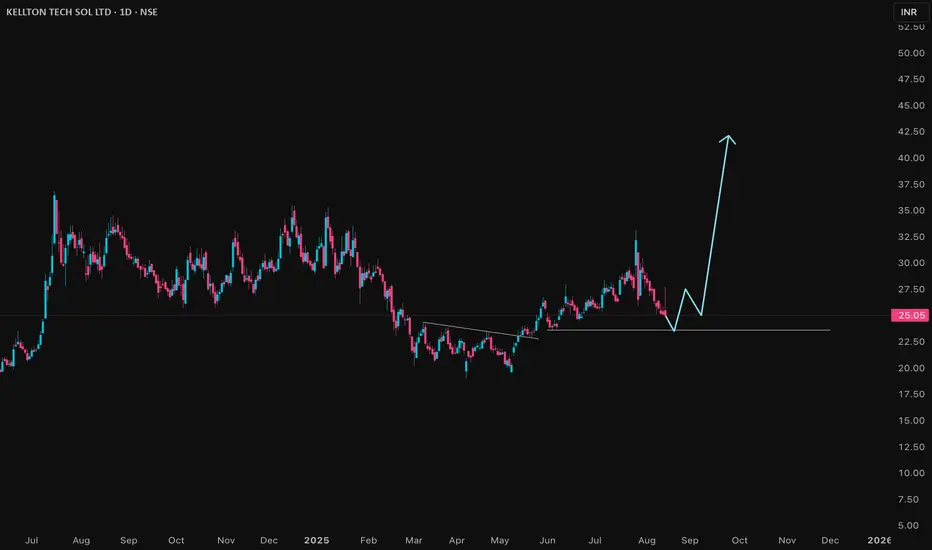
- Current share price: ₹25.01 (NSE).
- Market capitalization: Approximately ₹1,233 crore.
- 52-week price range: ₹19.00 (low) to ₹35.50 (high).
- Day's trading range recently: ₹24.80 to ₹27.70.
- Recent price change: Slight decline of about 0.48% on the latest trading day.
### Returns & Volatility
- The stock is down over 17% in the past year.
- Year-to-date in 2025, it is down about 8%.
- Despite a recent uptrend with a notable rally after Q1 FY26 results, the price remains approximately 22% below its 52-week peak.
- Daily price swings show moderate volatility.
### Financial Performance (Q1 FY26 Highlights)
- Revenue: ₹296.1 crore, up 12.8% year-on-year and 3.1% quarter-on-quarter.
- EBITDA: ₹35.8 crore, with a margin of 12.1%.
- Net profit: ₹22.7 crore, up 13.6% year-on-year and nearly 18% quarter-on-quarter.
- EPS: 1.63.
- Price/Earnings ratio: 15.34.
### Business & Growth Notes
- Kellton Tech is focusing on an AI-first strategy, enhancing capabilities in product engineering, data engineering, and cloud engineering.
- Major AI-related project wins in Q1 with global clients in beverages, health insurance, and travel technology.
- Operational milestones include launching an AI platform for intelligent automation and a zero-downtime migration project for large clients.
- The company participates in global conferences and has received recognition for AI tool performance improvements.
### Valuation & Sentiment
- The current P/E ratio of 15.34 indicates moderate valuation relative to earnings.
- The stock recently jumped nearly 10% after the strong Q1 FY26 results announcement.
- Analysts see Kellton Tech as positioning itself competitively within AI-powered IT solutions.
- Investor sentiment has improved due to earnings growth and strategic execution despite the stock being below its 52-week high.
### Summary
Kellton Tech Solutions is showing steady financial growth supported by a clear focus on AI-driven projects and strong client engagement. The stock trades at a moderate valuation with a P/E around 15 and has shown resilience with notable earnings growth. Though its price is below the yearly highs, recent operational achievements and project wins provide a positive outlook. Investors should watch for continued execution on AI strategies and monitor overall IT sector trends for sustained momentum.
BUY TODAY SELL TOMORROW for 5%DON’T HAVE TIME TO MANAGE YOUR TRADES?
- Take BTST trades at 3:25 pm every day
- Try to exit by taking 4-7% profit of each trade
- SL can also be maintained as closing below the low of the breakout candle
Now, why do I prefer BTST over swing trades? The primary reason is that I have observed that 90% of the stocks give most of the movement in just 1-2 days and the rest of the time they either consolidate or fall
Cup and handle Breakout in KELLTON
BUY TODAY SELL TOMORROW for 5%

KellonTech Solution - H &S Pattern Formation WTFKellonTech Solution - H &S Pattern Formation on WTF. Pattern Target -210
SL - 142

Long Kellton techgood improving fundamentals
recently made higher highs and broke previous days high
low risk high reward setup
cmp 150
sl 135
target 200

Kellton Tec - Might head towards all time high and surpass itKellton Tec - Might head towards all time high and surpass it this time to hit 200+ levels..
Good to Go Long with todays low as SL

Breakout in Kellton!Chart -> Kellton Tech Daily
CMP: 151
Targets: 165, 182
SL: 147 Daily Close
Disclaimer: This is for educational purposes only, not any recommendations to buy or sell. As I am not SEBI registered, please consult your financial advisor before taking any action.


KELLTONTEC - 2.5 year long Cup & Handle Pattern BreakoutHere's a technical analysis of the KELLTONTEC stock chart:
Key Observations
Cup and Handle Pattern:
The chart shows a cup and handle formation, which is a bullish continuation pattern indicating the potential for an upward breakout. The "cup" forms after a rounded bottom, and the "handle" represents a minor consolidation before a breakout attempt.
Major Resistance Area:
There is a well-defined major resistance area that the stock previously tested. After breaking above this level, the stock is now consolidating, creating a strong base before possibly moving higher.
17-Week Small Base:
The stock has been consolidating for 17 weeks, forming a small base just above the major resistance area. This base suggests that the stock is stabilizing, and this consolidation could provide support for a strong breakout.
128-Week Strong Base:
The stock is building on a much larger 128-week base. This extended period of accumulation signifies that the stock has gained a significant foundation, increasing the probability of a sustained move if it breaks out.
Volume Analysis:
High volume during upward moves and low volume during pullbacks indicates healthy demand. The low volume during consolidation suggests that selling pressure is minimal, while high volume spikes during upward movements indicate buyer interest.
Volume also picked up around the 20-week EMA, showing support from buyers near this level.
Bounce from 20-Week EMA:
The price has consistently bounced off the 20-week EMA, showing it as a strong support level. This reinforces the uptrend and indicates buying demand whenever the stock approaches this EMA.
Trade Setup with Key Levels
Entry Point:
Breakout Entry: Enter above the high of the handle at around 160-165 for breakout confirmation.
Targets:
Target 1: 225 – Based on initial resistance.
Target 2: 280 – A higher resistance level, achievable if the breakout gains momentum.
Target 3: 373 – A longer-term target that aligns with the larger base breakout potential.
Target 4: 450 – For a longer-term position, based on the depth of the cup and potential for an extended move.

KELLTON Trendline breakoutafter rallying 100% it has consolidated for almost 4months. followed by giving a trendline breakout.
breakout was with a good volume.
yesterday closed near day-high.

Kellton TechKellton Tech had given the all time high breakout and then come into the correction/consolidation mode.
Now it is taking support at the ATH breakout and ready for the breakout of the correction.

KELLTONTEC Long IdeaKELLTONTEC broke out from years long consolidation and now consolidating near retest zone.
It is good buy near retest zone if at all it comes to that. Or you can buy after channel breakout.
Stoploss is weekly close below retest zone. Will update targets later.
Trade as per risk management.
NOTE: No idea about Fundamentals of company. It is just technical take.

KELLTON TECH SOLUTIONS By KRS ChartsDate: 11th July 2024
Time: 9:40AM
Why KELLTON TECH?
1. Currently Sustained at All-time High Price with Strong Breakout.
2. Cup & Handle Chart Pattern is visible in Weekly and Monthly TF. Also Volume is noticeably increased from year 2021 compared to its previous years.
3. RSI above 60 and Positive Crossover in MACD.
120 to 130 Rs can be better price if Correct little bit from here
If it breaks Neckline at least in Daily TF,
It can achieve 255 Rs price point from current price level.

Kellton Tech Solutions Ltd ₹ 138 Kellton Tech Solutions Ltd
₹ 138
2.70%
27 Sep - close price
EXPORT TO EXCEL
FOLLOW
kelltontech.com
BSE: 519602
NSE: KELLTONTEC
ABOUT
Kellton Tech Solutions Ltd offers services in digital transformation, ERP and other IT services. It has operations across US, Europe, India and Asia-Pacific with a team of ~1,800 employees.
KEY POINTS
Services Offered
Agile software development, digital commerce & marketing, digital integration, outsourced product development, platform modernization, professional services, technology consulting, testing & automation and others.
READ MORE
Market Cap
₹ 1,340 Cr.
Current Price
₹ 138
High / Low
₹ 184 / 72.5
Stock P/E
19.6
Book Value
₹ 45.5
Dividend Yield
0.00 %
ROCE
15.9 %
ROE
15.7 %
Face Value
₹ 5.00
Add ratio to table
eg. Promoter holding
EDIT RATIOS

KELLTONTEC - Weekly AnalysisIn the Weekly Chart of KELLTONTEC ,
we can see that, it is about to retest the breakout.
Let it retest completely and create a Bullish Candle or pattern or show a reversal style.
Expected momentums is shown in chart.


KelltonTech-An ATH breakout which you shouldn't miss!Kellton tech has given a weekly breakout from an ATH supply zone of 120-130 with very heavy volumes.
Stock has formed cup and handle pattern since 2017 and now looking strong for a big quick uptrend.
This stock is a potential multibagger with decent fundamentals.

Kelton tech solutionThis stock breakout 110 above target is 240 rs fundamentally good stock this Quarter results is bad but definitely this stock reached 240 breakout after

Cup and Handle breakout in all time framesGood volume buildup in daily and weekly timeframe.
Cup and handle breakout with good volume.
RSI indicates good.
Smallcap⚠️
Fundamental are OK.
FII stake has been increased.
NOTE: I do my analysis, do yours before trade.

KELLTONTEC - NEXT 86% RETURN STOCKKelltontec has given breakout of Rounding bottom pattern on monthly chart. Targets are marked on chart with SL of the stock.

KELLTON TECH SOLUBuy with sl 102 closing basis target 250+ 300+
Breakout given after more than 2 years.


Kelltontec - Breakout above 135-40.Kellton Tech Solutions Ltd offers services in digital transformation, ERP and other IT services. It has operations across US, Europe, India and Asia-Pacific with a team of ~1,800 employees.
Looks like near the breakout level. Good to buy on dip and buy above 135-40 will be breakout levels.
Cup and handle pattern formation and on the breakout we can see the straight up move to the 500 or more...
Market Cap: 1190 Cr.
Promoter holding: 51.9%
FII holding: 0.79%
DII holding: 0.00%
Public holding: 47.3%
