KFINTECH 1 Week Tme Frame 📌 Current Price Context
Last close / recent price: ~₹1,018–₹1,019 per share on NSE.
The stock has been weakening over the past week (down ~‑4‑5%).
Price range today: high ~₹1,053 / low ~₹1,016.
📊 Key Pivot & Weekly Levels (1‑Week Focus)
🔹 Pivot (Reference)
Weekly pivot: ~₹1,024 area (central week
Kfin Technologies Limited
No trades
Next report date
—
Report period
—
EPS estimate
—
Revenue estimate
—
20.10 INR
3.33 B INR
11.08 B INR
94.88 M
About Kfin Technologies Limited
Sector
Industry
CEO
Venkata Satya Naga Nadella
Website
Headquarters
Hyderabad
IPO date
Dec 29, 2022
Identifiers
2
ISIN INE138Y01010
KFin Technologies Ltd. engages in the provision of software as a service based end-to-end transaction management, channel management, compliance solutions, data analytics, and digital services. It operates through the following segments: Registry Services, Data Processing Services, and Pension Services. The company was founded on June 8, 2017 and is headquartered in Hyderabad, India.
Related stocks

KFINTECH at historical demand zoneToday after a fall, this stock entered a historical demand zone and had shown a jump whenever it hit this zone.So i am keeping eyes on this zone for next few trading sessions. A bounce from here further needed confirmation above 1075 for strong rally otherwise a dead cat bounce. but if fails to hold

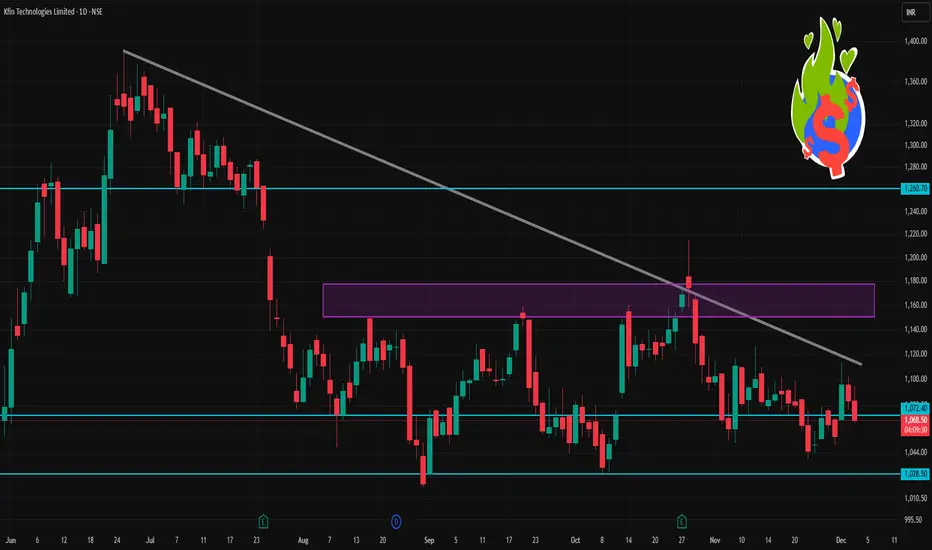
KFINTECH – Daily | Compression → Breakout SetupKFINTECH has been in a long consolidation phase after a strong move and is now trading near an important demand zone. Price is forming higher lows, indicating selling pressure is reducing.
This setup looks like a build-up before a directional move.
🔹 Trend: Neutral → Turning bullish
🔹 Support Zone

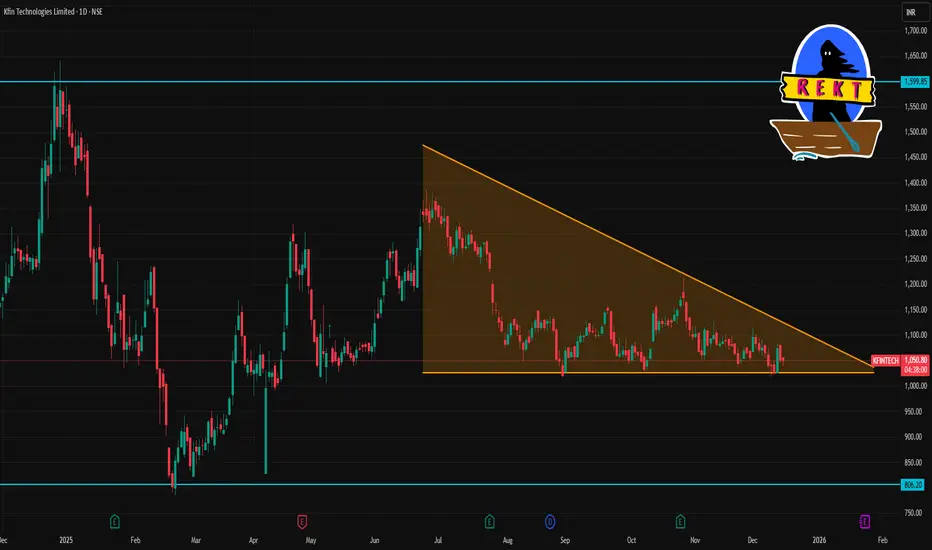
KFIN Technologies: Consolidation Breakout SetupKFIN Technologies is forming a constructive base after a strong prior move, with price compressing between well-defined demand and supply zones. The structure suggests accumulation, with momentum likely to expand once the range resolves.
The 1020–1030 zone continues to act as a strong demand area,

KFINTECH 1 Day Time Frame 📌 Live Price Context
Current price: ~₹1,051.7 on NSE (latest update)
Today’s range: ~₹1,045.6 (low) — ₹1,081.5 (high)
📊 Daily Pivot Support & Resistance (Accurate Today)
Level Price (₹)
R3 ₹1,109.50
R2 ₹1,095.50
R1 ₹1
KFINTECH 1 Day Time Frame 📊 Current Snapshot (as of right now)
Reported day’s trading‑range so far: ~ ₹ 1,066.70 (low) to ~ ₹ 1,095.00 (high)
Opening price: ~ ₹ 1,083.80
Previous close: ~ ₹ 1,083.40
Market‑wide context: 52‑week high ~ ₹ 1,641.35, 52‑week low ~ ₹ 784.15
📌 Key Intraday / Short‑Term Levels (Classic Pivot‑S
KFINTECH 1 Week Time Frame 🔍 Weekly Structure & Level View
Support zones
Immediate support around ₹1,054-₹1,060 (just under S1).
Deeper support around ₹1,010-₹1,020 (S2 zone).
If broken, next meaningful structural support around ₹930-₹950 (S3).
Also, from Market Screener: mid-term support ~ ₹1,021.20.
Resistance zones
Key
BUY TODAY SELL TOMORROW for 5%DON’T HAVE TIME TO MANAGE YOUR TRADES?
- Take BTST trades at 3:25 pm every day
- Try to exit by taking 4-7% profit of each trade
- SL can also be maintained as closing below the low of the breakout candle
Now, why do I prefer BTST over swing trades? The primary reason is that I have observed that

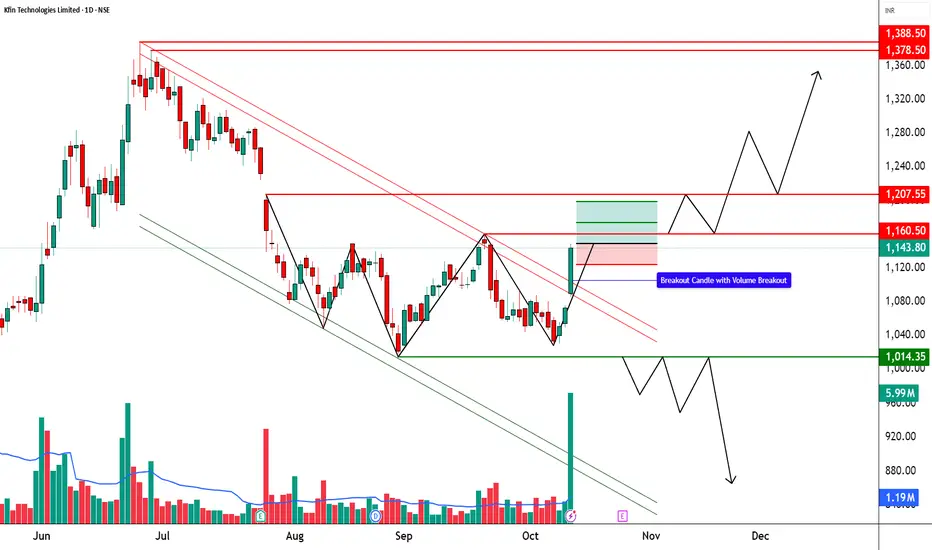
KFINTECH - Bullish Breakout from Consolidation | STWP AnalysisTicker: NSE: KFINTECH | Sector: Financial Services & Technology
CMP: 1149.00
Rating: ⭐⭐⭐⭐ (Bullish Breakout Setup – Educational Purposes Only)
Pattern Observed: 📈 Chart Pattern – Range Breakout from Base Support
Candlestick Pattern: Bullish Marubozu | Breakout Candle
📈 KFin Technologies – Bullish B
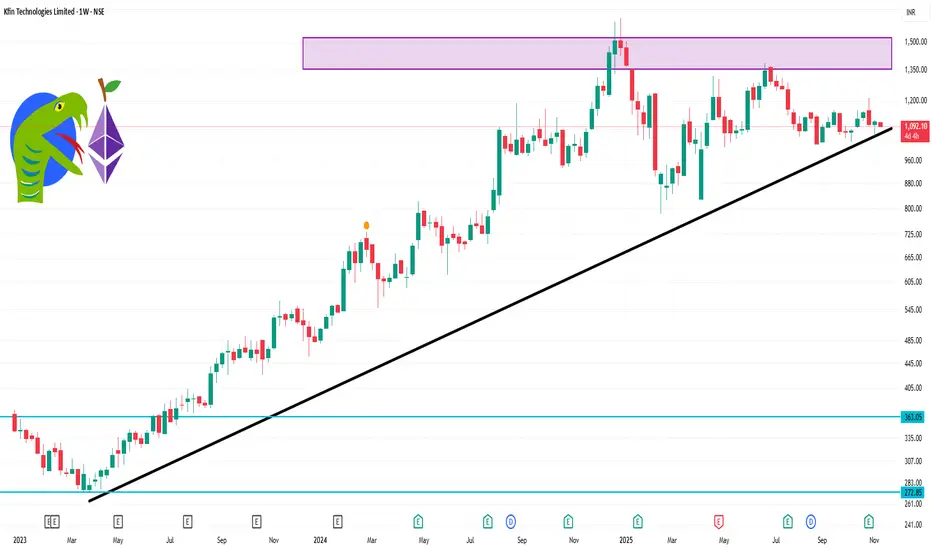
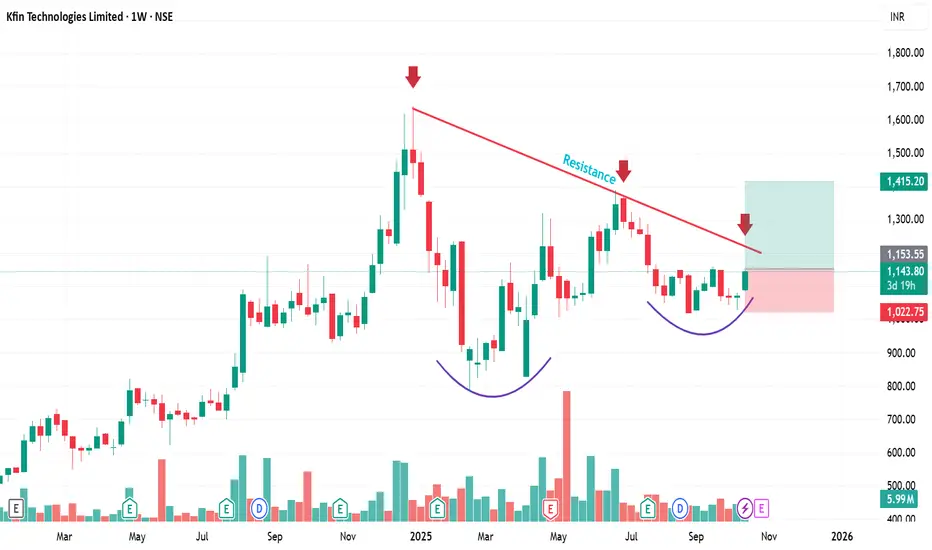
KFin Technologies (NSE) – Weekly Chart AnalysisStock is forming a rounding bottom pattern and testing the falling resistance trendline. A breakout above it may trigger a bullish reversal.
Entry: Above ₹1,155
Stop loss: ₹1,022
Target: ₹1,415
Key Highlights:
SEBI case settled with no major financial impact.
General Atlantic clarified no stake sa
See all ideas
Summarizing what the indicators are suggesting.
Neutral
SellBuy
Strong sellStrong buy
Strong sellSellNeutralBuyStrong buy
Neutral
SellBuy
Strong sellStrong buy
Strong sellSellNeutralBuyStrong buy
Neutral
SellBuy
Strong sellStrong buy
Strong sellSellNeutralBuyStrong buy
An aggregate view of professional's ratings.
Neutral
SellBuy
Strong sellStrong buy
Strong sellSellNeutralBuyStrong buy
Neutral
SellBuy
Strong sellStrong buy
Strong sellSellNeutralBuyStrong buy
Neutral
SellBuy
Strong sellStrong buy
Strong sellSellNeutralBuyStrong buy
Displays a symbol's price movements over previous years to identify recurring trends.
MOCAPITAL
Motilal Oswal Nifty Capital Market ETF Exchange Traded Fund UnitsWeight
4.00%
Market value
484.25 K
USD
MOSMALL250
Motilal Oswal Nifty Smallcap 250 ETF Units Exchange Traded FundWeight
0.72%
Market value
115.05 K
USD
Explore more ETFs
Frequently Asked Questions
The current price of KFINTECH is 967.70 INR — it has decreased by −2.49% in the past 24 hours. Watch Kfin Technologies Limited stock price performance more closely on the chart.
Depending on the exchange, the stock ticker may vary. For instance, on NSE exchange Kfin Technologies Limited stocks are traded under the ticker KFINTECH.
KFINTECH stock has fallen by −4.19% compared to the previous week, the month change is a −9.58% fall, over the last year Kfin Technologies Limited has showed a −16.75% decrease.
We've gathered analysts' opinions on Kfin Technologies Limited future price: according to them, KFINTECH price has a max estimate of 1,400.00 INR and a min estimate of 1,150.00 INR. Watch KFINTECH chart and read a more detailed Kfin Technologies Limited stock forecast: see what analysts think of Kfin Technologies Limited and suggest that you do with its stocks.
KFINTECH reached its all-time high on Dec 30, 2024 with the price of 1,641.35 INR, and its all-time low was 272.00 INR and was reached on Mar 20, 2023. View more price dynamics on KFINTECH chart.
See other stocks reaching their highest and lowest prices.
See other stocks reaching their highest and lowest prices.
KFINTECH stock is 4.34% volatile and has beta coefficient of 2.47. Track Kfin Technologies Limited stock price on the chart and check out the list of the most volatile stocks — is Kfin Technologies Limited there?
Today Kfin Technologies Limited has the market capitalization of 167.04 B, it has decreased by −1.00% over the last week.
Yes, you can track Kfin Technologies Limited financials in yearly and quarterly reports right on TradingView.
Kfin Technologies Limited is going to release the next earnings report on Feb 13, 2026. Keep track of upcoming events with our Earnings Calendar.
KFINTECH earnings for the last quarter are 5.40 INR per share, whereas the estimation was 5.40 INR resulting in a 0.00% surprise. The estimated earnings for the next quarter are 5.10 INR per share. See more details about Kfin Technologies Limited earnings.
Kfin Technologies Limited revenue for the last quarter amounts to 3.09 B INR, despite the estimated figure of 3.03 B INR. In the next quarter, revenue is expected to reach 3.58 B INR.
KFINTECH net income for the last quarter is 933.13 M INR, while the quarter before that showed 772.57 M INR of net income which accounts for 20.78% change. Track more Kfin Technologies Limited financial stats to get the full picture.
Yes, KFINTECH dividends are paid annually. The last dividend per share was 7.50 INR. As of today, Dividend Yield (TTM)% is 0.77%. Tracking Kfin Technologies Limited dividends might help you take more informed decisions.
Kfin Technologies Limited dividend yield was 0.73% in 2024, and payout ratio reached 38.67%. The year before the numbers were 0.94% and 39.77% correspondingly. See high-dividend stocks and find more opportunities for your portfolio.
As of Feb 9, 2026, the company has 6.55 K employees. See our rating of the largest employees — is Kfin Technologies Limited on this list?
EBITDA measures a company's operating performance, its growth signifies an improvement in the efficiency of a company. Kfin Technologies Limited EBITDA is 5.38 B INR, and current EBITDA margin is 46.84%. See more stats in Kfin Technologies Limited financial statements.
Like other stocks, KFINTECH shares are traded on stock exchanges, e.g. Nasdaq, Nyse, Euronext, and the easiest way to buy them is through an online stock broker. To do this, you need to open an account and follow a broker's procedures, then start trading. You can trade Kfin Technologies Limited stock right from TradingView charts — choose your broker and connect to your account.
Investing in stocks requires a comprehensive research: you should carefully study all the available data, e.g. company's financials, related news, and its technical analysis. So Kfin Technologies Limited technincal analysis shows the strong sell today, and its 1 week rating is sell. Since market conditions are prone to changes, it's worth looking a bit further into the future — according to the 1 month rating Kfin Technologies Limited stock shows the sell signal. See more of Kfin Technologies Limited technicals for a more comprehensive analysis.
If you're still not sure, try looking for inspiration in our curated watchlists.
If you're still not sure, try looking for inspiration in our curated watchlists.