KPIT MAKIG F&P PATTERNKPITmaking f&p pattern
trading above 20 ema
target can be 1000
educational idea only
KPITTECH trade ideas

Extra-ordinary gains for kpit tech will end soonkpit tech, a tech company which was listed on 2019 and since then the stock is quite giving extraordinary gains. if you look at the chart from lows it has given 22x returns but if you see its fundamentals then its revenues and profits have merely grown 2x. so clearly i see its fundamentals have deviated from its price and in this type of market where stocks are getting butchered , its still commaning a PE of 70! . also on charts i see its lacking momentum at highs and RSI indicating a bearish divergence .so after all this i will short the stock till its mean . thank you

KPIT TECH--RETESTED TO BOX~All the information given in the chart is for the educational purpose only.
~Do your own research before investing.
~This is not my recommendation.
~My recommendation--LEARN MORE EARN MORE.

KPIT LOOKS VERY BULLISH, ALL TIME HIGHFundamentals : Strong, Consistent growth Sales, Profits, EPS, Growing Reserves Vs Low Debt, FII holding increased significantly.
High Dividends payout, showing strength in weak market!
Technicals : Bullish, ATH, Broken C&H Pattern with good Vol, above MAs.
R1: 1000
R2: 1100
R3: 1200
S: 765

KPITTECH#Watchlist
#KPITTECH (3 D)
Ready to ATH Breakout ?
Breakout will confirm above 910
1- Positive chart structure
2- Horizontal breakout of 439 days
3- Weekly Resistance of 62 weeks Breakout
Keep on Radar.
#Disclaimer:-View shared it for educational purposes only.

Potential Breakout High RRRWeekly Breakout
Classical Cup & Handle Pattern
With 10% as Stop Loss
Target 35% from CMP

LONG CALL ON KPIT TECHBreakout on the stock
Entering blue sky zone
Fib targets would be around 950
Stop loss at 875
I am just representing my views
For educational purpose only

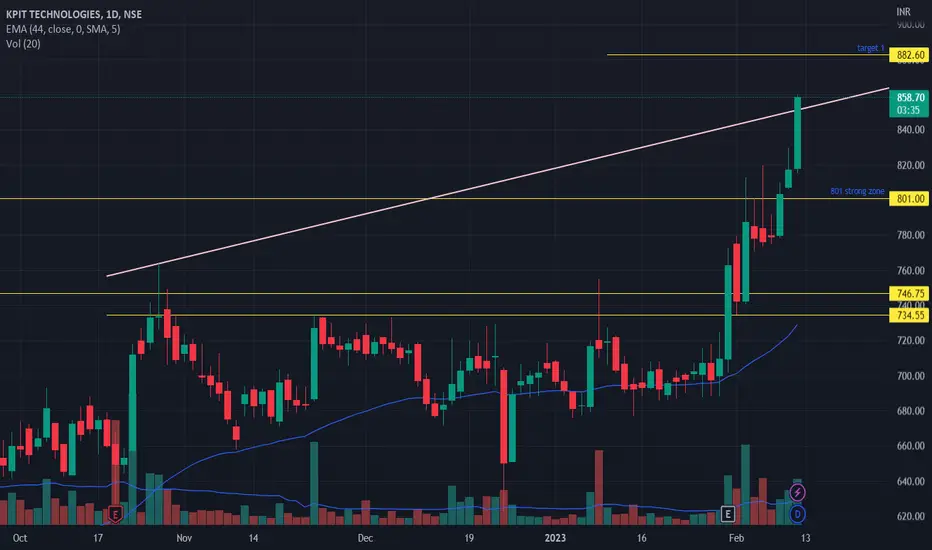
KPIT Technologies Ltd - Drifting towards breaking trend lineAn india based global technology company focussed on automobile engineering and mobility solutions. Stock under strong resistance zone, Retested and bounced back . Respected the resistance line so many times .So if it bounce over from here , can expect a good movement.

Cup & Handle + VCP BOKPITTECH
- Gave Break out of Cup & Handle + Volatility
contraction pattern.
- Good volume during BO and follow up buying
- Consolidated on the upper side when the market was
weak.
- Retested and then again BO in Weekly tf.

KPITTECH near ATH with good momentum and volume KPITTECH has made a breakout recently and price retested that resistance, now that stock is near ATM with good momentum.
Closing above 870 on daily basis, will make a quick move on upper side
Note : It's your hard earned money always trade with SL, I'm just sharing my analysis

KPIT TECHNOLOGIES : Resistance BreakoutAfter numerous rejections from the resistance, a breakout finally occurred.
The price is above the 200-day moving average.
Price is trending above its 20-day moving average.
The breakout candle has proper volume, so it can't be called a fake breakout.
Resistance Breakout in KPITTECH

Types of Alerts on TradingViewHey Everyone! 👋
While alerts have a ton of potential applications when it comes to trading, they are often underutilized because it can take some time and ingenuity to build a system where they can work well.
Alerts can turn the experience of trading from a constant search for ideas - and always feeling behind - into a relaxing job of waiting for your own pre-approved conditions to trigger before taking action. In short, alerts can make you much more well-prepared for the market’s ups and downs. 🔍
In this post, we will look at the two distinct types of alerts available on our platform.
Our alerts are categorized into two types based on resource requirements:
➡ Price alerts
➡ Technical alerts
Each alert type has a separate limit on the number of active alerts based on the subscription. We are happy to announce that we have recently doubled the combined limit for both alert types. 🎉
The current limits for active alerts are as follows:
As shown in the table, the Basic plan includes one price alert and one technical alert, while the Premium plan provides access to a much higher number of alerts. Specifically, users on the Premium plan can enjoy up to 400 price alerts and 400 technical alerts.
Now, you might be wondering about the distinction between price and technical alerts. What sets these two apart? Let's dive into the specifics of each type to gain a better understanding of their unique features and benefits.
💸 Price Alerts
An alert is considered a price alert when the following two conditions are met:
1. Only a symbol is used in the alert (for any type of chart: Bars, Renko, PnF, etc) and a price value
2. One of the following is selected as the trigger condition:
• Crossing
• Crossing Up
• Crossing Down
• Greater Than
• Less Than
For example , the following alert on a candlestick chart would be considered a price alert:
👨💻 Technical alerts
An alert is considered a technical alert if any of the following conditions are met:
1. The alert uses an overlay symbol, indicator, drawing or strategy
2. One of the following is selected as the trigger condition:
• Entering Channel
• Exiting Channel
• Inside Channel
• Outside Channel
• Moving Up
• Moving Down
• Moving Up %
• Moving Down %
For example , the following alert will be considered a technical alert since the trigger condition is set as “Moving up %”.
We hope that this post has provided you with a clearer understanding of the distinct types of alerts available on TradingView. However, if you require further assistance with setting up or managing your alerts, we recommend visiting our Help Center .
Thanks for reading! Hope this was helpful.
See you all next week. 🙂
– Team TradingView
Feel free to check us out on Instagram , and Twitter for more awesome content! 💘

KPITTECH Bullish; above 856 on Thursday 16 Mar for IntradayExercise caution as broader market is bearish.
Please check out the INTRADAY Trading Strategy in the COMMENTS section below during the live market hours:
---------------------------------------------------------------------------------------------------------------------
1) Impulse upmove stage: The strong upmove (nearly upto 2% from breakoutprice) happens within the first five to 15 minutes. "High Risk Traders" buys in hope of another 2% upmove intraday.
"High Risk Traders" may have to patiently wait through the Pullback-Consolidation stage to realize profits. High risk/High reward set up as breakouts may fakeout (reversal)also
2) Pullback-Consolidation stage: After the above "Impulse upmove stage"; the price may then pull back and move sideways (between "Open" price and "High" of the above "Impulse upmove stage").
Safe traders with minimum risk profile may Wait for a breakout from the consolidation to enter at this stage to relize high profits in the final intraday final "Breakout continuation" stage
3) Breakout continuation: Stocks often in the third stage breaks up above the "High" of the first "Impulse upmove stage" and continue to go higher again.
Both Safe Traders/High Risk Traders may book profits at this stage
Stop Loss: You may keep the stop loss @ "Open" price of the day OR "Breakoutprice"
The above information is not meant to be, and do not constitute, financial, investment, trading, or other types of advice or recommendation.

Cup & Handle BO#BREAKOUTSTOCKS
- Cup and handle BO and then a shallow pull back with
dried up volume and took support at Fibo 50%
- Morning star pattern
- Increase in volumes
- All imp. avg. below it along with bullish W&M RSI

BUY TODAY SELL TOMORROW for 5% DON’T HAVE TIME TO MANAGE YOUR TRADES?
- Take BTST trades at 3:25 pm every day
- Try to exit by taking 4-7% profit of each trade
- SL can also be maintained as closing below the low of the breakout candle
Now, why do I prefer BTST over swing trades? The primary reason is that I have observed that 90% of the stocks give most of the movement in just 1-2 days and the rest of the time they either consolidate or fall
Resistance Breakout in KPITTECH
BUY TODAY SELL TOMORROW for 5%

KPIT Technologies Limited KPITTECH:- Cup and handle pattern has formed, don't plan until proper breakout is found, keep an eye till strong stock is there
Hello traders,
As always, simple and neat charts so everyone can understand and not make it too complicated.
rest details mentioned in the chart.
will be posting more such ideas like this. Until that, like share and follow :)
check my other ideas to get to know about all the successful trades based on price action.
Thanks,
Ajay.
keep learning and keep earning.

KPIT TECH - LONG TERM - HARMONICSPotential Bullish butterfly yet to complete.
PRZ marked with the completion of the above-mentioned pattern.
Also, potential targets on the CD retracement are marked with fib retracement plot.

KPITTECH - Long Setup, Move is ON..NSE:KPITTECH
✅ #KPITTECH trading above Resistance of 835
✅ Next Resistance is at 990
Related charts:
Charts are self-explanatory. Levels of breakout, possible up-moves (where stock may find resistances) and support (close below which, setup will be invalidated) are clearly defined.
Disclaimer: This is for demonstration and educational purpose only. This is not buying or selling recommendations. I am not SEBI registered. Please consult your financial advisor before taking any trade.

Break of trendline1.RSI and stock are moving in same trend
2.break of trendline
3.kpittech is in all time high
good stock for btst trade
KPITTECH - All Time High Breakout - Swing TradeThose who study charts on regular basis, would be familiar that when a stock price breaks its ATH level on a higher Time frame, in majority of cases, it goes much above that level. Similar is the setup in this stock which has been in uptrend for quite long and has shown strength even during market correction recently.
The analysis is done on weekly as well as on Daily TF hence price may take few weeks to few months in order to reach the targets.
Trade setup is explained in image itself.
The above analysis is purely for educational purpose. Traders must do their own study & follow risk management before entering into any trade
Checkout my other ideas to understand how one can earn from stock markets with simple trade setups. Feel Free to comment below this or connect with me for any query or suggestion regarding this stock or Price Action Analysis.

CUP & HANDLE FORMATION BREAKOUTCup & handle formation created in Daily Chart.
Expecting Bounce and Trend change after closing on higher level.

KPIT Tech - My Analysis and TargetsYou can keep an eye on Kpit tech if you get entry again near the breakout levels.

KPIT Technologies - In a strong resistance zoneAn india based global technology company focussed on automobile engineering and mobility solutions. Only for educational purpose.Not a recommendation . Stock under strong resistance zone. Respected the resistance level 2-3 times .So if it bounce over from here , can expect a good flow to upside.
