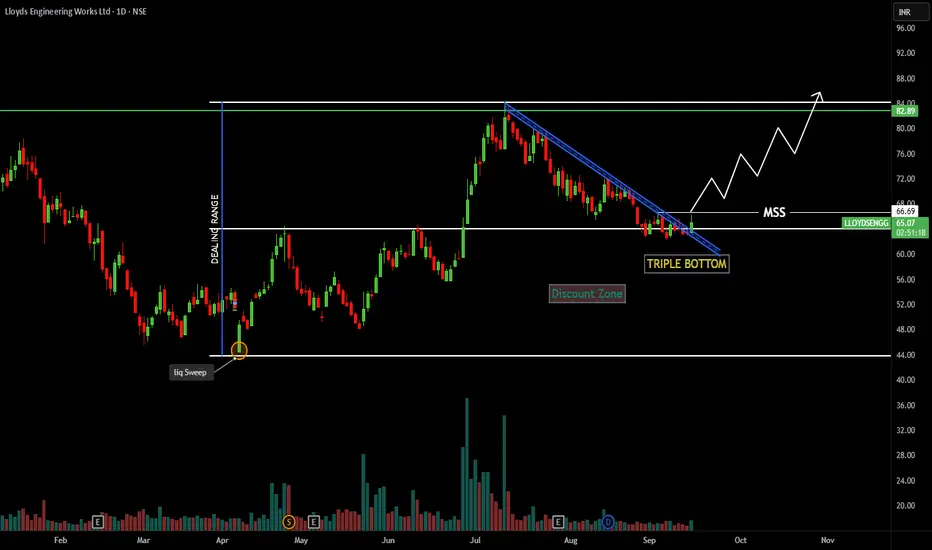
LLOYEDS ENGINEERINGPrice Structure:
Liquidity Sweep: Price earlier swept liquidity at the lows (highlighted in yellow circle), which often indicates smart money accumulation.
Dealing Range: Clear defined range with upper resistance near 82.89 and lower support around 44.
Discount Zone: Price traded back into the lower range (discount zone), offering institutional buying opportunity.
Triple Bottom Formation: Strong base formed near ₹60 zone – confirming demand.
📉 Recent Price Action:
A downtrend channel (blue trendline) was broken to the upside.
Today’s green candle shows bullish intent with increased volume.
Market Structure Shift (MSS): Price breaking above minor resistance signals buyers are regaining control.
📈 Future Outlook:
If the triple bottom holds and MSS sustains, stock may start a higher-high, higher-low rally.
First resistance: 72–74 zone (short-term target).
Major resistance: 82.89 (previous high / range top).
A breakout above ₹83 could open the way to ₹90+ levels.
⚠️ Risk Factors:
Breakdown below ₹60 will invalidate bullish setup (triple bottom fails).
Watch overall market sentiment and volume confirmation.
LLOYDSENGG trade ideas
lloyds engg buy opportunitybuy opportunity for lloyds engg.
good stock volumes.
potential breakout.
fib level of 50%
expect a target of 83 in the coming weeks and months

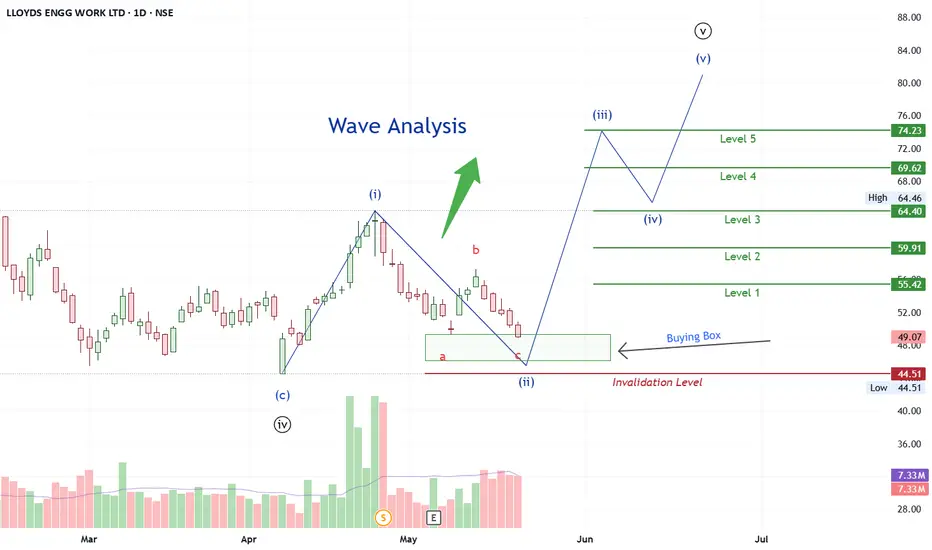
LLOYDSENGG LongThe Elliott Wave Theory's description of the structure and pattern of price movements in financial markets is known as the Elliott Wave Structure.
The Elliott Wave analysis indicates that the stock has completed waves (i),(ii),(iii) and (iv), which are shown as black circle numbers on the daily chart. Wave (v) appears to be underway at this time.
Wave (v) in black circle, also known as the impulse wave, unfolding into five waves, which are illustrated in blue colour.
Wave (i) in blue colour is finished.
wave (ii) i.e. corrective wave unfolding in a-b-c pattern. wave (ii) is about to finish.
Buy on dip.
wave (iii) in blue colour will start after the completion of wave (ii).
The double Bottom pattern is forming i.e. a bullish reversal pattern.
(The double Bottom pattern is a bullish reversal pattern)
The falling wedge pattern is also forming on the chart i.e. a bullish reversal pattern
(The falling wedge is a bullish reversal pattern)
Wave levels are depicted on the chart.
Level of Invalidation
The invalidation level of 44.51 has been identified as the start point of wave (i). If the price falls below this level, it means that the projected Elliott Wave pattern is not as it appears.
I'm not a registered Sebi analyst. My research is done solely for academic purposes.
Please consult your financial advisor before trading or investing. I bear no responsibility for your profits or losses.
Regards,
Dr Vineet
BUY TODAY SELL TOMORROW for 5%DON’T HAVE TIME TO MANAGE YOUR TRADES?
- Take BTST trades at 3:25 pm every day
- Try to exit by taking 4-7% profit of each trade
- SL can also be maintained as closing below the low of the breakout candle
Now, why do I prefer BTST over swing trades? The primary reason is that I have observed that 90% of the stocks give most of the movement in just 1-2 days and the rest of the time they either consolidate or fall
Cup and Handle Breakout in LLOYDSENGG
BUY TODAY SELL TOMORROW for 5%

Good momentum stock, gave clean rally, pulled back and consolidaGood momentum stock, gave clean rally, pulled back and consolidated forming narrow ranges ready for B.O ( The output of the BO is based on mkt condition)

#LLOYDSENGG CMP 63.50 ✅ Fundamentals are average(above) with 30% YoY revenue and PAT expansion, a strong 71.6% EBITDA margin.
✅ Content acquisition cost rising to 25-27% of revenue in FY26, indicating higher investments in music rights.
✅FIIs holding gave increased, with average increment of 84%
Buying cheaper the better. Upside price will be safe above 76.50
Study before investing.
Happy Investing
Girish Anchan
W.M.A

BUY TODAY SELL TOMORROW for 5% DON’T HAVE TIME TO MANAGE YOUR TRADES?
- Take BTST trades at 3:25 pm every day
- Try to exit by taking 4-7% profit of each trade
- SL can also be maintained as closing below the low of the breakout candle
Now, why do I prefer BTST over swing trades? The primary reason is that I have observed that 90% of the stocks give most of the movement in just 1-2 days and the rest of the time they either consolidate or fall
Resistance Breakout in LLOYDSENGG
BUY TODAY SELL TOMORROW for 5%

LLOYDSENGGLLOYDSENGG showing strength and gave resistance breakout with decent volume. Seems it may continue for new ride. And it may show uncharted zone as well. Keep it on radar.

Stock Analysis: Lloyds Engineering Works Ltd.Introduction:
Lloyds Engineering Works Ltd is primarily engaged in the design, Manufacturing, and Commissioning of heavy equipment, machinery & systems for the HydroCarbon Sector, Oil & Gas, Steel Plants, Power Plants, Nuclear Plant Boilers, and Turnkey Projects
Fundamentals:
Market Cap: ₹ 9,913 Cr.; Stock P/E: 102 (Ind. P/E: 43.32) 👎;
ROCE: 28.3% 👍 ; ROE: 26.2% 👍;
3 Years Sales Growth: 107% 👍; 3 Years Profit Growth: 442% 👍;
3 Years Stock Price CAGR: 58% 👍;
Cons:
• Stock is trading at 22.2 times its book value 👍
• Promoter holding has decreased over the last quarter -0.87%
Technicals:
The stock has given a strong breakout.
The stock is in a strong Bullish Momentum - Above Short, Medium and Long Term averages.
Stock with consistent financial performance, quality management, and strong technical momentum indicating good investor enthusiasm.
Currently valued at Good to expensive valuation
20 EMA (Black Line) is above 50 EMA (Orange Line) and 100 EMA (Sky Blue Line) in the daily charts, confirming the bullish trend.
Resistance levels: 88, 93
Support levels: 83, 73, 65

Potentially a multi bagger for long-term holders Lloyds Engineering has shown a strong uptrend in recent years,
•with a consistent increase in its stock price. Technical indicators suggest bullish momentum, •rising 50-day moving average crossing above the 200-day moving average.
•The stock has formed a higher high and higher low pattern, indicating a potential
continuation of the uptrend.

UPTREND STOCK ON SUPPORT!The stock is currently at the support zone of its uptrend and also taking support on the 44 SMA.
The targets are mentioned for swing trading and one can hold it for short to long term as it will always have a new high if the uptrend continues.
DO NOT TRADE IF BREAKS THE TREND LINE.
DISCLAIMER - Analyse yourself before investing.
HAPPY TRADING

LLoyds Engineering - Can Double from here. Best above 92LLoyds - has posted Excellent results today, and there has been increase in FII/DII stake. One can enter at current price above 92 with strict stop loss of 57. One can top up when it falls up to 58.
Disclaimer : Educational content. Please do your own research.

LLYODSENGG - Positional TradeFundamentally Good, Technically Promising - Swing Trade opportunity has gone however we can still expect some positional gains.

LLOYDSENGG BULLISH BREAKOUTIts a up flag breakout with huge volume.breakout is happened after a long consolidation .

LLOYDS Engineering Works Looking StrongLLOYDS Engineering Works Looking Strong..
Great Volume..
Strong Breakout..
Education Purpose Only... Please Consult Your Financial Adviser Before investing..
Please Maintain Strict Stoploss...
Book 70% at Target 1 and Rest Trail and Book at Target 2 ...
Don't Risk More than 1% or 2% of your capital in a single Trade..

#LLOYDSENGG (Weekly)⚡️Almost Debt Free
⚡️5Y Profit Growth of 79% CAGR
⚡️Symmetrical Triangle Pattern
⚡️6 months long consolidation
⚡️Double Doji Breakout
🔴 SL 46
🟡 CMP 48
🟢 TGT 53/60/72

Lloyds Engineering WorkGenerally Speaking , charts of the same commodity/ equity , tend to have similar pattern sequences which tend to repeat over & over again. They seem to favor certain behavior patterns
This is called as the Fractal Nature of Patterns!
Here in the case of Lloyds Engineering, we can see that the stock usually makes a symmetrical triangle, wears out all the weak holders, tests the patience of strong holders & then usually starts it upward journey.
The breakout looks strong associated with good volumes

Llyod Engg WorksTechnical structure for LLoyd Engg Works shows a slant Volume Contraction Pattern. This is very bullish pattern considering the stock should be in poised in Stage 2. Havent much gone about to the fundamental aspect so please make your own informed decision.

LLOYDSEN Consolidation and Ascending Triangle Breakout Expected"We can see that the stock is poised for a consolidation breakout and an ascending triangle breakout. If the stock successfully breaks out and maintains its position above the resistance level, it is likely to experience an upward movement in the coming days.
