Divergence SecretsOption Trading in India
India has seen a boom in retail options trading.
1. Exchanges
NSE (National Stock Exchange): Leader in index & stock options.
BSE (Bombay Stock Exchange): Smaller but growing.
2. Popular Underlyings
Nifty 50 Options (most liquid).
Bank Nifty Options (very volatile).
Stock Options (Infosys, Reliance, HDFC Bank, etc.).
3. SEBI Regulations
Compulsory margin requirements.
Weekly index expiries (Thursday).
Physical settlement of stock options at expiry.
Option trading is a double-edged sword. It can create wealth through leverage, hedging, and smart strategies. But it can also destroy capital if misused without understanding risks.
The secret is balance:
Learn the basics.
Practice with small positions.
Respect risk management.
Master volatility and Greeks.
If stocks are like playing cricket, options are like playing 3D chess—complex, dynamic, but highly rewarding for disciplined traders.
M&M trade ideas

A simple Shorting Opportunity in Mahindra & MahindraMahindra & Mahindra has been consolidating under a triangular Pattern, which has given break down.
It can go down further as per the width of the triangle.
Please refer chart for more details.

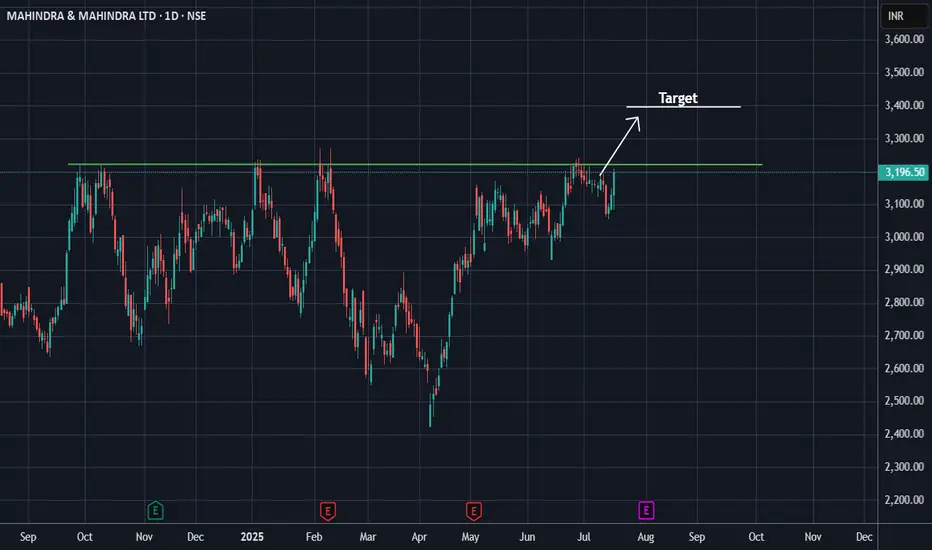
M&M (Mahindra & Mahindra)It's been a while since M&M is testing this resistance.
Looking strong, moving above key EMAs, good volume, continuously contracting near the resistance. If it sustains this level then it may give a good upside move.
Keep eyes on it.
Must use SL, it always safeguard your Capital.
✅ If you like my analysis, please follow me as a token of appreciation :)
in.tradingview.com/u/SatpalS/
📌 For learning and educational purposes only, not a recommendation. Please consult your financial advisor before investing.
M&M FLAG PATTERN BREAKOUTM&M Breaking flag pattern on daily chart
with huge volume,good volume building last week
MACD crossover done
RSI bullish around 70
trading above 20 ema
target1 3600 target2 4000
retest level around 3300,sl 3050
DO YOUR OWN ANALYSIS BEFORE INVESTING

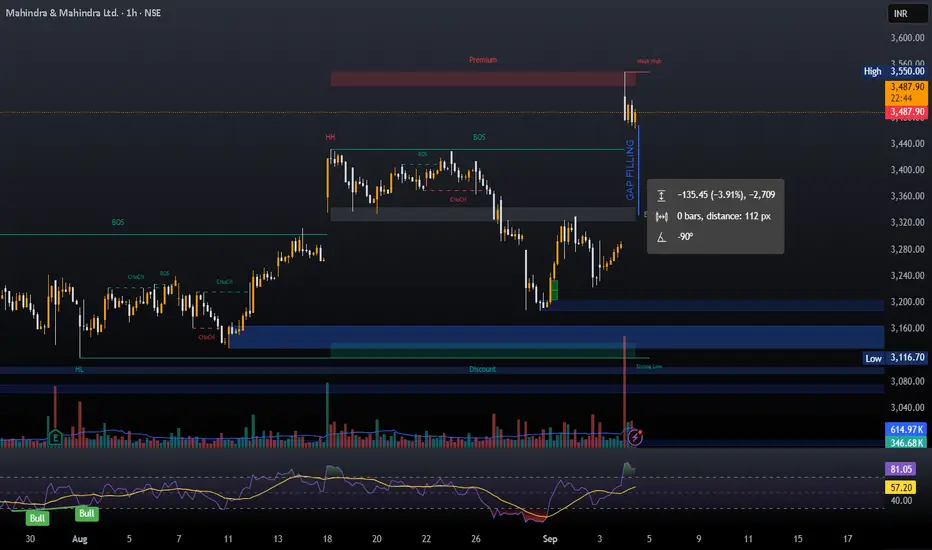
M&M ShortThe GST news has already been factored in and M&M was already trading at its al tie high. A gap up at all time high always gives an opportunity for a sell trade for the gap filling. One can look for sell in M&M with 3550 as resistance zone. Keep track of this chart and see if this concept works or not. Follow for more such concepts.
Jai Shree Ram.
Any correction is a buying opportunityM&M CMP 3696
Elliott- The stock has reached its first resistance at 3735. A three wave correction should happen from here. Which will again be a buying opportunity. AS the next tgt is at 4200 and then the final tgt of 4600.
Fibs- the correction to 50% at 2416 from a higher swing is strength.

Currency Trading (Forex Trading)1. Introduction to Currency Trading
Currency trading, also called foreign exchange trading or forex trading, is the global marketplace where national currencies are bought and sold against each other. It is the largest and most liquid financial market in the world, with a daily trading volume exceeding $7 trillion (according to BIS 2022 report).
Unlike stock markets, which operate in specific exchanges (like the NYSE or NSE), forex is a decentralized market that operates 24 hours a day, five days a week, spanning across global financial hubs: Sydney, Tokyo, London, and New York.
The main purpose of forex trading is:
Facilitating international trade and investment – businesses need currency exchange.
Speculation and profit-making – traders attempt to profit from price fluctuations.
Hedging – corporations and investors manage currency risk.
2. History of Currency Trading
To understand modern forex, let’s go back in time:
Gold Standard Era (1870s – 1914): Currencies were pegged to gold. Stable but restrictive.
Bretton Woods System (1944 – 1971): Post-WWII, the US dollar was pegged to gold, and other currencies were pegged to the dollar. This system collapsed in 1971 when the US ended gold convertibility.
Free-Floating Exchange Rates (1971 onwards): Major currencies started floating freely, driven by supply and demand.
Digital and Online Forex (1990s – present): With the internet and trading platforms, forex became accessible to retail traders worldwide.
Today, forex is a technology-driven global marketplace where even small investors can trade currencies with a click.
3. Basics of Currency Pairs
Currencies are traded in pairs, since one currency is exchanged for another.
Example: EUR/USD = 1.1000
This means 1 Euro = 1.10 US Dollars.
If you think the Euro will strengthen, you buy EUR/USD.
If you think the Euro will weaken, you sell EUR/USD.
Categories of Currency Pairs:
Major Pairs: Most traded, always include the USD (e.g., EUR/USD, GBP/USD, USD/JPY).
Minor Pairs (Crosses): Don’t include USD (e.g., EUR/GBP, AUD/NZD).
Exotic Pairs: Combine a major currency with one from an emerging economy (e.g., USD/INR, EUR/TRY).
4. How the Forex Market Works
Forex operates on an OTC (Over-the-Counter) model – no central exchange. Instead, it works via a network of:
Banks & Central Banks (liquidity providers).
Hedge Funds, Corporations, and Governments (large participants).
Retail Brokers who provide platforms for individuals.
Market Sessions:
Sydney Session: Opens the week, low liquidity.
Tokyo Session: Active Asian trading.
London Session: Very liquid, overlaps with Asia and US.
New York Session: High volatility, overlaps with London.
Because of these time zones, the forex market is effectively open 24/5.
5. Key Players in Currency Trading
Central Banks: Control money supply and interest rates, e.g., US Federal Reserve, ECB, RBI.
Commercial Banks: Provide liquidity, facilitate global trade.
Hedge Funds & Institutions: Speculate with billions of dollars.
Corporations: Hedge currency risk for imports/exports.
Retail Traders: Individuals trading via brokers.
6. Why Do People Trade Currencies?
Speculation: Profit from price changes.
Hedging: Protect against currency fluctuations.
Diversification: Alternative to stocks and commodities.
Accessibility: Low entry cost, leverage availability.
7. Key Concepts in Forex Trading
(a) Bid & Ask Price
Bid Price: Price at which market buys from you.
Ask Price: Price at which market sells to you.
Spread: Difference between bid and ask (broker’s fee).
(b) Pips & Lots
Pip (Percentage in Point): Smallest price movement (e.g., 0.0001 in EUR/USD).
Lot: Standard unit of trading (100,000 units of base currency).
Standard Lot = 100,000
Mini Lot = 10,000
Micro Lot = 1,000
(c) Leverage & Margin
Leverage: Allows traders to control large positions with small capital (e.g., 1:100).
Margin: Deposit required to open a leveraged trade.
(d) Long & Short Positions
Long (Buy): Betting on currency appreciation.
Short (Sell): Betting on currency depreciation.
8. Fundamental Analysis in Forex
Fundamental analysis examines economic, political, and financial factors that influence currencies.
Key Drivers:
Interest Rates: Higher rates attract capital → stronger currency.
Inflation: High inflation → weaker currency.
GDP Growth: Strong economy → strong currency.
Employment Data: (e.g., US Non-Farm Payrolls).
Trade Balance: Surplus strengthens currency, deficit weakens it.
Geopolitics: Wars, elections, policy shifts affect currencies.
Example: If the US Federal Reserve raises interest rates, the USD often strengthens.
9. Technical Analysis in Forex
Traders also rely on charts and indicators to predict price moves.
Common Tools:
Candlestick Patterns: e.g., Doji, Engulfing.
Support & Resistance Levels.
Trendlines & Channels.
Indicators: Moving Averages, RSI, MACD, Bollinger Bands.
Chart Patterns: Head & Shoulders, Triangles, Flags.
Technical analysis helps traders time entries and exits more precisely.
10. Types of Currency Trading
(a) Spot Trading
Immediate exchange of currencies at current market price.
Most common type for retail traders.
(b) Forward Contracts
Agreement to exchange currency at a future date, fixed rate.
Used for hedging.
(c) Futures Contracts
Standardized contracts traded on exchanges (e.g., CME).
Regulated and transparent.
(d) Options
Right (but not obligation) to buy/sell currency at a set price.
Used for hedging and speculation.
(e) CFDs (Contracts for Difference)
Popular in retail forex.
No physical delivery of currency, only speculation on price changes.
Conclusion
Currency trading is a dynamic, global, and highly liquid market that offers immense opportunities and risks. It plays a vital role in the global economy by enabling trade, investment, and financial stability.
For traders, success in forex requires:
Solid understanding of fundamentals and technicals.
Strict risk management.
Strong psychological discipline.
While the potential rewards are high, forex trading is not a shortcut to riches. It’s a skill-based profession that requires patience, practice, and continuous learning.

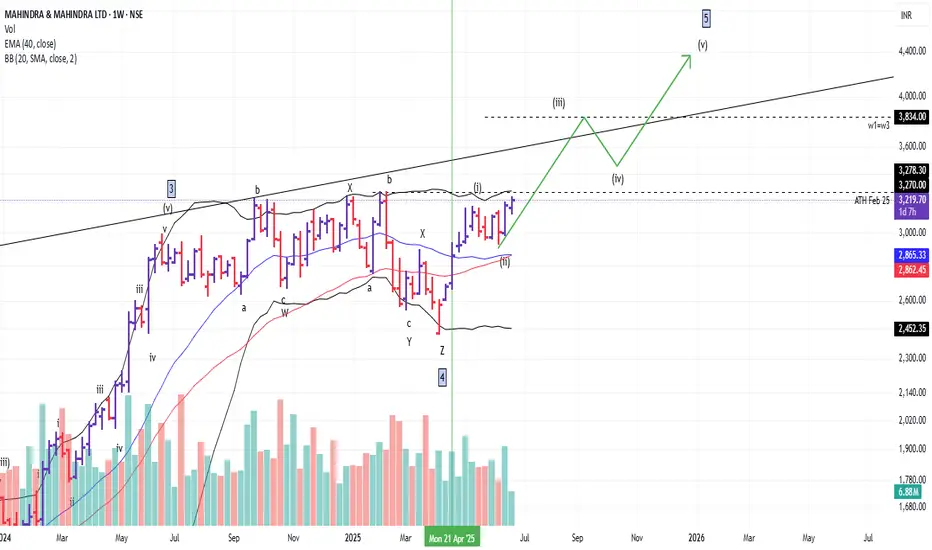
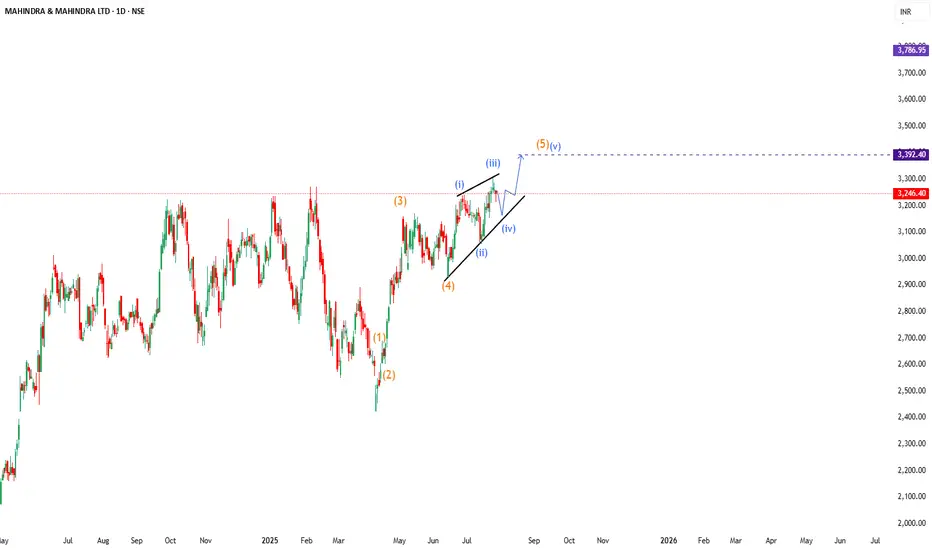
M&M Bullish ViewProbability of M&M making fresh highs in wave 5. wave 3 of wave 5 is likely to start. Targets as shown in path
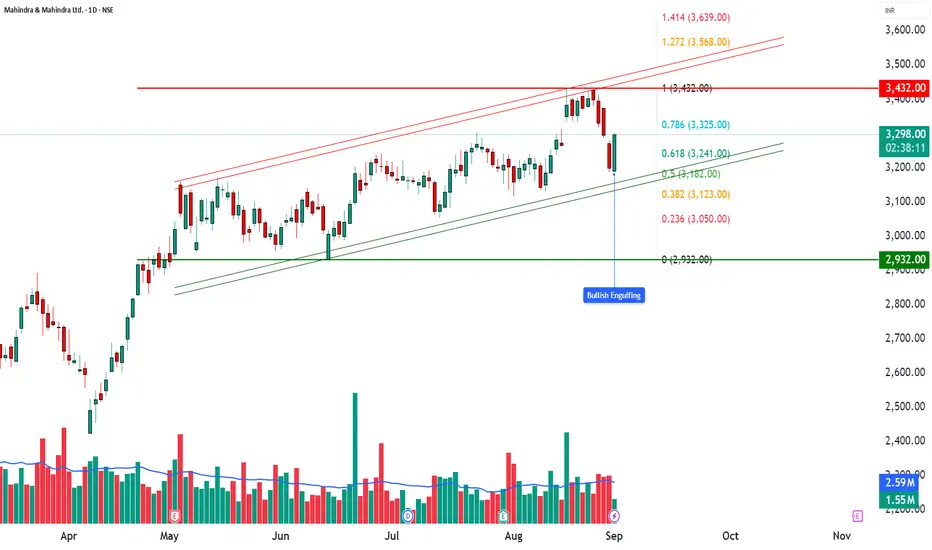
M&M | How to Trade a Bullish Engulfing in a Rising Channel🚘 M&M | How to Trade a Bullish Engulfing in a Rising Channel
📊 Stock: Mahindra & Mahindra Ltd (M&M)
⏳ Timeframe: Daily
📈 Chart Pattern: Rising Channel
🕯 Candlestick Pattern: Bullish Engulfing
________________________________________
🔹 Pattern Overview
M&M is currently trading within a Rising Channel, a structure that often reflects sustained bullish momentum. On the latest daily chart, a Bullish Engulfing candlestick has been formed, signaling renewed buying interest after a brief phase of consolidation.
________________________________________
The setup looks stronger with a Bullish Marubozu and an Open = Low candle, showing aggressive demand from the open. Price is holding well above VWAP, confirming bullish bias. A BB Squeeze Off signals volatility expansion ahead, while the recent false breakdown indicates sellers got trapped and buyers are back in control.
________________________________________
🔹 Key Levels to Watch
Resistance Zones: 3335 – 3374 – 3445
Support Zones: 3224 – 3152 – 3113
________________________________________
🔹 Technical Indicators Snapshot
RSI is at 52, sitting in the neutral zone but leaving room for upside momentum if buying picks up. The MACD shows a bearish crossover, which is an early caution signal to watch. CCI at -14 indicates neutral sentiment with no strong bias, while Stochastic at 55 is mid-range, suggesting neither overbought nor oversold conditions at the moment.
________________________________________
🔹 Candle Analysis
Candle 1 (Yesterday): High 3280 | Low 3187
Candle 2 (Today): High 3302.10 | Low 3191.10
👉 The today’s candle engulfed the previous session’s body, confirming the Bullish Engulfing pattern.
________________________________________
🔹 Trading View (Educational Insight Only)
A Bullish Engulfing inside a Rising Channel generally indicates continuation of the prevailing uptrend. If price manages to probably sustain above the 3335–3374 zone, it may signal strength for further upside. On the other hand, if the stock probably slips below the 3224–3152 support zone, it could lead to short-term profit booking.
________________________________________
📌 “All price levels mentioned are as observed at the time of writing and may change with market movements. Readers are advised to track live prices before making any trading or investment decision.”
⚠️ Disclaimer – Please Read Carefully
The information shared here is meant purely for learning and awareness. It is not a buy or sell recommendation and should not be taken as investment advice. I am not a SEBI-registered investment advisor, and all views expressed are based on personal study, chart patterns, and publicly available market data.
Trading — whether in stocks or options — carries risk. Markets can move unexpectedly, and losses can sometimes exceed the money you have invested. Past performance or past setups do not guarantee future results.
If you are a beginner, treat this as a guide to understand how the market works — practice on paper trades before risking real money. If you are experienced, always assess your own risk, position sizing, and strategy suitability before entering trades.
Consult a SEBI-registered financial advisor before making any real trading decision. By engaging with this content, you acknowledge full responsibility for your trades and investments.
💬 Found this useful?
🔼 Give this post a Boost to help more traders discover clean, structured learning.
✍️ Drop your thoughts, questions, or setups in the comments — let’s grow together!
🔁 Share with fellow traders and beginners to spread awareness.
👉 “If you liked this breakdown, follow for more clean, structured setups with discipline at the core.”
🚀 Stay Calm. Stay Clean. Trade With Patience.
Trade Smart | Learn Zones | Be Self-Reliant 📊
GST Rate Cut and Its Impact on M&MGST Rate Cut Proposal: The Indian government is on the verge of reducing GST on cars, two-wheelers, three-wheelers, trucks, and buses from the current 28% down to 18%. The new recommendations seek to eliminate the 12% and 28% slabs, retaining only 5% (for essentials and EVs) and 18% for most internal combustion engine (ICE) vehicles. Luxury cars may have a new 40% bracket.
Projected Impact:
According to Nomura, this GST reduction could generate a “multiplier effect” on demand, resulting in a 10–15% increase in auto sales, with Mahindra & Mahindra and Maruti Suzuki positioned to benefit the most. Popular Mahindra models like the Bolero and XUV700 could see immediate price cuts (Bolero by approximately 10%, XUV700 by approximately 7%), thereby improving affordability and volume.
Anticipated margin improvement for OEMs like M&M could be as much as 1–1.5 percentage points if they maintain current discount structures after the tax cut; if the reductions are passed on, consumers benefit directly through price drops.
M&M Stock – GST Cue
GST Impact: The government is set to reduce GST on cars and SUVs from 28% to 18%, likely before Diwali 2025. This policy benefits Mahindra & Mahindra directly by lowering vehicle prices and potentially spurring demand.
Buying Price: M&M is consolidating near ₹3,375–₹3,385. Immediate supports are at ₹3,360 and ₹3,345—ideal zones for accumulation.
Target: With positive tax news and strong technical momentum, short- to medium-term upside targets are ₹3,500, ₹3,600, and possibly ₹4,000, if the uptrend continues
GST cuts are a strong fundamental trigger. Buying near ₹3,360–₹3,385 with a medium-term target of ₹3,500–₹3,600, and a stop loss below ₹3,320, is a favorable trading strategy for M&M amid these cues.
Disclaimer: lnkd.in
Wave Theory Applied , Ending Diagonal Pattern I have been Using Wave Theory for over a 20 Years in my Life and every time I see Patterns
which are logical & Self Explanatory I know what i am looking at ,
In this pattern Friends i see an Ideal pattern which ends the Motive wave after an strong
momentum in its prices ,
I have always said market repeat in itself , I wonder how people interoperation would be
This is education content if you have any Questions please feel free to comment below i will try
to explain
Good luck
M&M Short term Swing trade with 1:3.5 RRIf Nifty holds its current level of 24,600 and is not bearish for next two-three trading sessions then
there are high chances that this setup will work and buyers will take control in M&M.
It is a supply & demand + Trend + Liquidity Trap based setup.
The setup looks good but the only concern is the overall market sentiment so take your risk accordingly.
Good Risk to Reward for first Target is 1:3.5
Let me know if you have any questions or doubts.
Happy to help!
Gaurav.

M&M _ Rising Wedge Formation📊 M&M – Technical & Educational Snapshot
Ticker: NSE: M&M | Sector: 🚙 Auto
CMP: ₹2,7XX (as of 16 Aug 2025)
Rating (for learning purpose): ⭐⭐⭐⭐
Pattern Observed: 📉 Rising Wedge Formation (Bearish Reversal Case Study)
🔑 Key Reference Levels (For Learning)
Support / Breakdown Zone: Lower wedge trendline
Resistance / Rejection Zone: Upper wedge trendline
Bearish Projection (Case Study): ~₹2,410
Bullish Continuation (Alternative View): ~₹3,300
📌 Pattern Observations
✅ Price forming higher highs & higher lows but within converging trendlines
✅ Momentum slowing → smaller swings inside wedge
✅ Typical bearish reversal structure (confirmation needed)
✅ Volume + RSI divergence can add conviction
📝 STWP Trade Analysis (Educational Illustration Only)
1️⃣ Bearish Breakdown (Primary Scenario)
Observation: Breakdown below wedge support often studied as bearish signal
Stop Loss (Learning Reference): Above upper wedge / recent swing high
Downside potential: ₹2,410 (measured move projection)
2️⃣ Bullish Breakout (Alternative Scenario)
Observation: Breakout above wedge resistance may lead to continuation
Stop Loss (Learning Reference): Below wedge / recent swing low
Upside potential: ₹3,300
📊 Risk Management & Confirmation
Traders typically wait for daily close outside wedge boundaries
Volume confirmation is key → spikes above average strengthen the move
RSI divergence often adds confidence to the setup
📌 Summary (Learning View Only)
The M&M Rising Wedge is a classic reversal study.
Key lesson: A wedge pattern teaches how slowing momentum can shift market control — but confirmation with volume + price close is essential before validating either direction.
⚠️ Disclaimer – Please Read Carefully
The information shared here is meant purely for learning and awareness. It is not a buy or sell recommendation and should not be taken as investment advice. I am not a SEBI-registered investment advisor, and all views expressed are based on personal study, chart patterns, and publicly available market data.
Trading — whether in stocks or options — carries risk. Markets can move unexpectedly, and losses can sometimes be larger than the money you have invested. Past performance or past setups do not guarantee future results.
If you are a beginner, treat this as a guide to understand how the market works — practice on paper trades before risking real money. If you are an experienced trader, remember to assess your own risk, position sizing, and strategy suitability before entering any trade.
Consult a SEBI-registered financial advisor before making any real trading decision.
By reading, watching, or engaging with this content, you acknowledge that you take full responsibility for your own trades and investments.
________________________________________
💬 Found this useful?
🔼 Give this post a Boost to help more traders discover clean, structured learning.
✍️ Drop your thoughts, questions, or setups in the comments — let’s grow together!
🔁 Share with fellow traders and beginners to spread awareness.
✅ Follow simpletradewithpatience for beginner-friendly setups, price action insights & disciplined trading content.
🚀 Stay Calm. Stay Clean. Trade With Patience.
Trade Smart | Learn Zones | Be Self-Reliant 📊
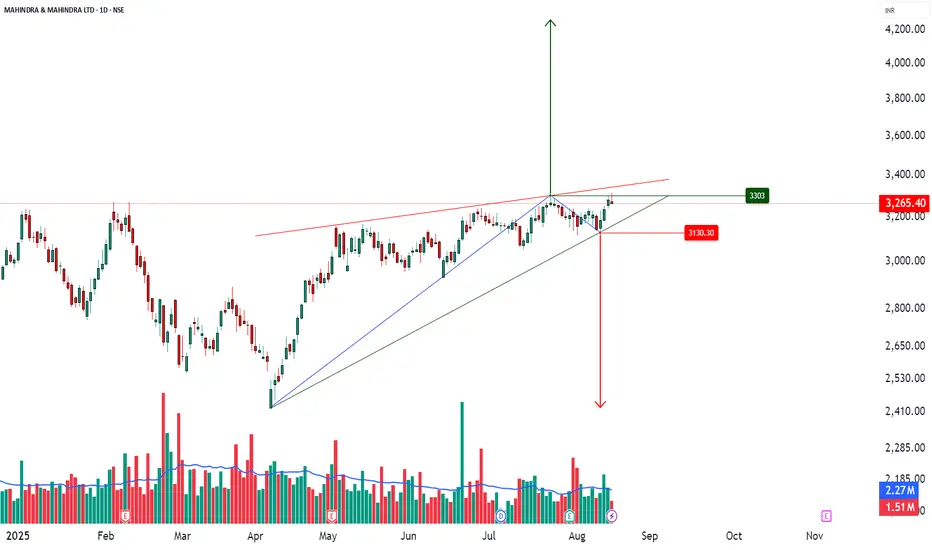
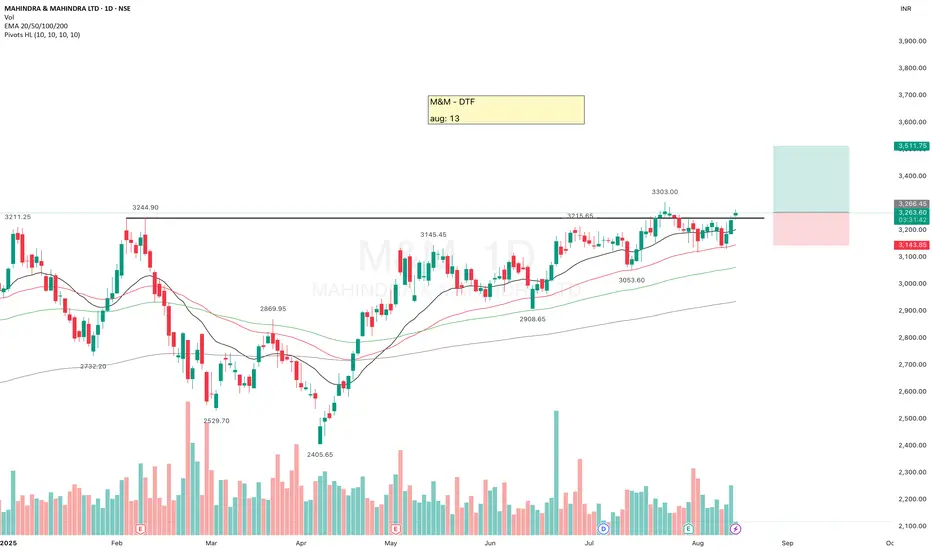
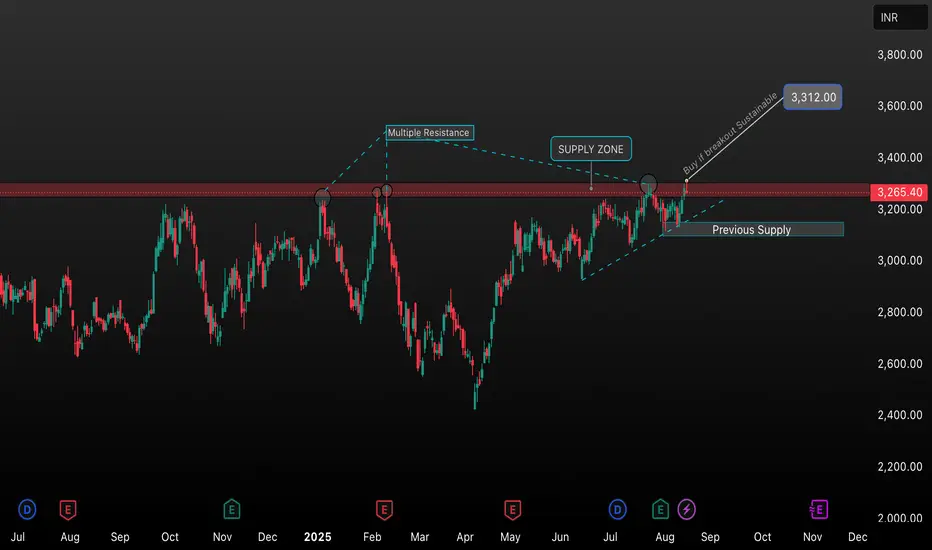
M&M Key Resistance Breakout – Supply Zone AnalysisThis chart highlights the crucial price action of M&M around the 3,265–3,300 INR supply zone. The region has acted as multiple resistance points in the past, making it a significant barrier for bulls. The current move shows a potential breakout above this supply zone, with a breakout target projected towards 3,312 INR. Traders should watch for a sustained close above this level for possible long opportunities. The previous supply now turns into a potential support level, strengthening the bullish bias if retested successfully.
Key Levels:
• Resistance/Supply Zone: 3,265–3,300 INR
• Breakout Target: 3,312 INR
• Support (Previous Supply): Around 3,200 INR
Trading Plan:
Wait for confirmation of a sustained breakout above the supply zone. If the price holds above, consider a buy entry targeting 3,312 with a stop loss below the previous supply.
Feel free to edit/shorten this for your specific style or requirements!
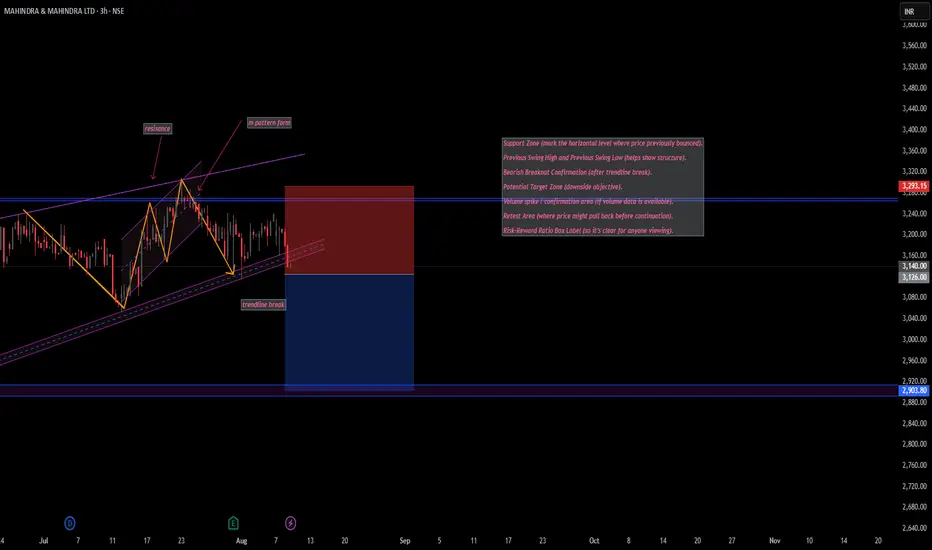
Mahindra & Mahindra – Trendline Breakout Signals Potential Downs📉 Mahindra & Mahindra – Bearish Setup Analysis
Pattern Formation: A clear M pattern has formed near the major resistance zone around ₹3,293, indicating potential trend exhaustion.
Trendline Break: Price has decisively broken the rising trendline, signaling a shift from bullish to bearish momentum.
Support Zone: Next strong support lies near ₹2,903, which is also the target zone based on the M pattern breakdown.
Risk–Reward: Short entry considered around ₹3,140 with stop-loss above ₹3,293 (resistance zone) and target near ₹2,903 offers a favorable R:R setup.
Market Structure: Recent lower highs and lower lows after the M pattern support the bearish bias.
Confirmation: Watch for a possible pullback/retest towards the broken trendline before further downside movement.
Summary:
If the breakdown sustains below the trendline, M&M could see further downside towards ₹2,903. A failed breakdown (price closing back above ₹3,200) would invalidate this bearish setup.
M&M ANALYSIS 07-AUG-2025LTP: 3210
Supports: 2934/2360
Resistances: 3300
As long as the above supports hold, we can see 3300 first.
Further targets,
3500-3666-3743
4189-4377-4777
5134 (ultimate target 1)
5534
5780-6088 (ultimate target 2)
6587, 7285
7870 (ultimate target 3)
8701, 10000*

M_M C Wave CorrectionTriple Bearish Divergences
Elliot Impulse completed (1-2-3-4-5 Complete)
Elliot Correction In Progres (A Complete, B Complete, C may start).

M&M SHORT IDEAM&M has formed a negative candle in Wedge pattern, if the day closing is below the lower line of the wedge, it can fall further to up to 2990-2970 levels.
Monday and Tuesday should confirm if it is breaching a key support line.

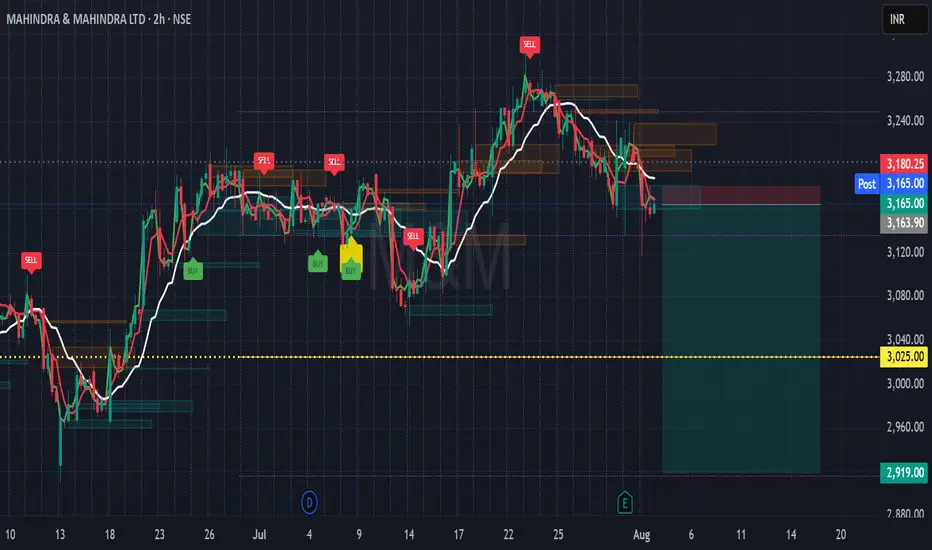
M&M Short Setup-Rejection from Supply Zone + Trend ConfirmationThis 2H chart on Mahindra & Mahindra Ltd. reflects a structure-aware short opportunity, based on price rejection from a key resistance zone and alignment with Leola Lens SignalPro logic.
🔎 Technical Structure Highlights:
🔴 SELL signal confirmed as price failed to sustain above recent supply clusters.
🟤 Multiple rejection blocks visible near ₹3,180 — now acting as resistance.
⚪ Price broke below the adaptive white base trendline, turning it into overhead pressure.
🟡 Prior yellow caution marker (trend shift risk) proved meaningful as momentum faded.
🟥 Defined invalidation level above ₹3,180.25.
🟢 Bearish targets align with previous demand zones near ₹3,025 and ₹2,919.
📌 Context Note:
Trend has shifted from congestion to downside acceleration. A clean break of recent structure suggests caution for longs. Watch for volatility around upcoming earnings.
📚 This is a technical case study — for educational use only.
Always trade with risk controls and your own judgment.
#M&M #Mahindra #NSEStocks #PriceAction #ShortSetup #StructureTrading #TechnicalAnalysis #SignalPro
Mahindra and Mahindra Leverage TradeFor the very first time I am publishing this idea that I recorded today. M&M has been consolidating for a while, it made a high if 3222 in September 2024 and has been consolidating for 11 months. Has tried to breach the level many times, but failed. Had been tracking this recent move. I mostly take the leveraged trades so the stock fits the pick. Started picking up around 3180 when it bounced back from the lows of 3152. I bought 3200 calls, with an Avg price of 65. Scaled up with 3300 Calls at an avg price of 31. All journaled and recorded live today. Not a rocket science, just tracking the simple candlestick patterns. Also had HDFC Life 740 calls which I squared off today and made some profits, which gave me additional leverage to carry on additional risk of 3300 call. Also bought some position in MTF at an avg price of 3210. As of now trade seems safe. Would post as we go along and close the trade. Hope for the best.


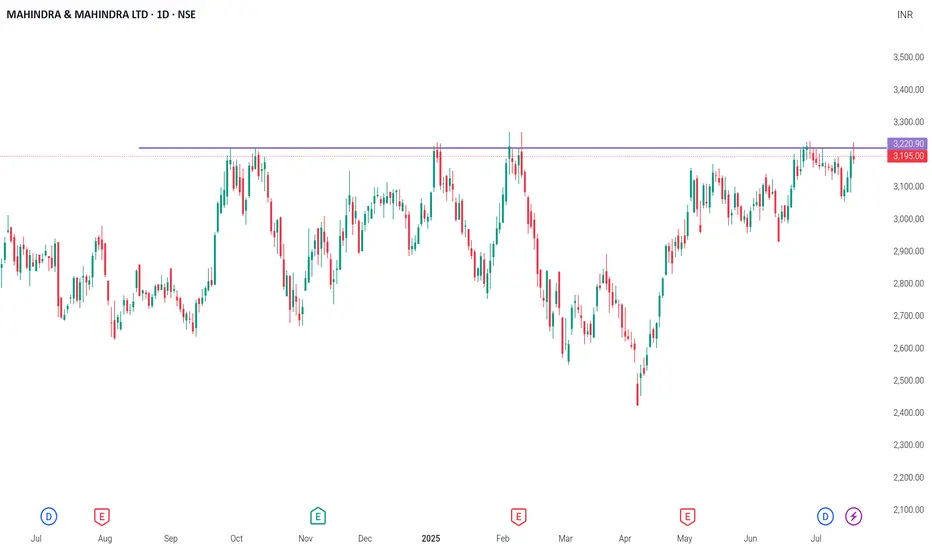
At Critical Resistance!testing a strong resistance zone near ₹3,220
A level that has rejected price multiple times in the past 10 months.
🟢 If it breaks out, we could see a fresh bullish rally toward new all-time highs.
🔴 If rejected, expect sideways or bearish pressure back to the ₹3,000–₹3,100 zone.
This is a make-or-break level
Smart money is watching.
M&M (Simple Breakout)Stock has consolidated and retested the resistance multiple times. A breakout is imminent.