MANAPPURAM trade ideas


Manappuram Finance : Getting Ready for a BIG Upmove?Gave strong BO from its trend channel lines and now taking support at 32% retracement of wave 3 high. Currently, in minor wave ii of 5. Rising gold prices will provide more fuel to its rally. No divergences.
Looking for target of 172 and more.


Flag pattern and double bottomThe stock is making a flag pattern and looks good above 170 for further upmove


Intraday / Swing Setup: Looks good between 167-169Intraday / Swing Setup: Looks good between 167-169 for the target of 180/190+ with strict SL of 162.
Note: I am not a SEBI register and view is only for educational purpose as well as personal, always consult your financial advisor before investing or trading

LONG MANAPPURAM ATCURRENT LEVEL; TARGET 170-175 IN 8-10 SESSIONSMANAPPURAM TURNS STRONG WITH LATEST PRICE ACTION, FRESH LONG CAN BE INITIATED WITH CURRENT LEVEL.
TARGET OPENS FOR 171-175 LEVELS IN 8-10 SESSIONS.

MANAPURAM Finance50% retracement is called as the healthy retracement in an Up-move.
POINT OF CONCERN :-
1.The formation of DOJI
(Which may also seems the sign of a price reversal Move)
BUT!!!!!
2.As we see in the next candle, buyers have pushed the price as soon as it came closer to 0.5%, hence hope is alive.
So, lets see and hope for the best!

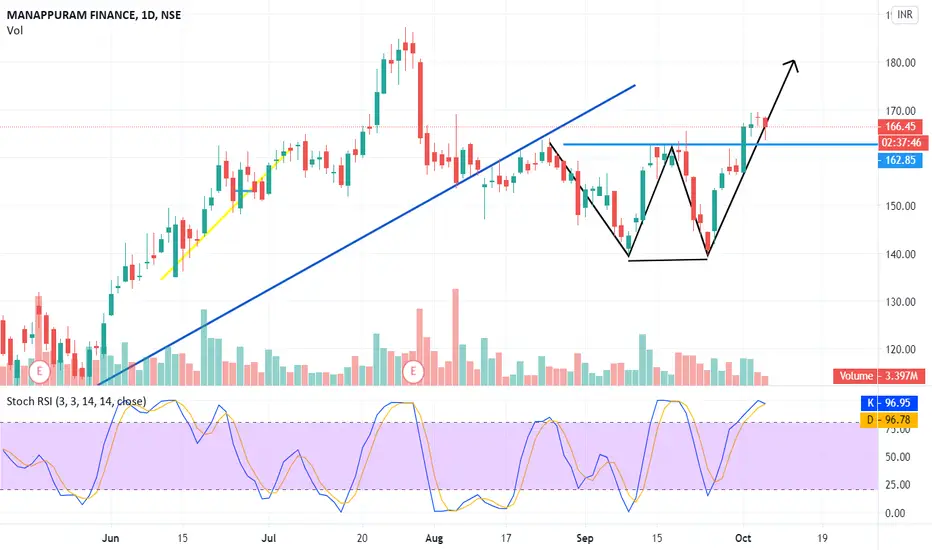
Manappuram - double bottom and sustains above necklinesince it made a double bottom recently and carried that momentum forward may be we will be able to see an uptrend here. keep SL
MANAPPURAM LOOKING GOOD FOR LONG ABOVE 1701. HAS BEEN IN GOOD MOMENTUM
2. SECTOR IS ALSO PERFORMING WELL
3. RESISTING AT ITS 0.618% (GOLDEN RATIO) LEVEL
4. FORMED DOUBLE DOJI ON DAILY TIME FRAME
INTRADAY : DOWN SIDE
SHORTS CAB BE INITIATED IF PDL BREAKS (166.5) FOR TARGET OF 164.5


MANAPURAM FINANCE ANALYSIS 11.06.2020BUY 164 TO 162
TARGET 170
IF IT BREAK 170 AND CLOSED ABOVE 170 IN DAY CANDLE AND THEN NEXT TARGET UP TO
TARGET 178 TO 184

Manappuram bullish on DailyAll ichimoku components are aligned favourably. Please check for yourself and post in your comments. All opinions and analysis is heartily welcomed.

Go long above resistance 169.15The stock gave a double bottom breakout. Looks good above the resistance of 169.15

Manappuram - Given BO looks goodStudy for educational purpose:-
Structure looks good. Broken 7 days high with high volume. BO above trend line with vol.
Double bottom formation.
Momentum is upwards; RSI looks good. Buy on dips. First target 170 and if crosses 169 and sustains it will reach 180.
OC slightly bullish.
Buy on dips.

MANAPPURAM LONG- Pole & FlagThe Stock has formed Pole flag pattern and looks bullish.
These are my personal views, Kindly trade on your own analysis.

MANAPPURAM | Seeing a Flag formation in Daily time frameMANAPPURAM | Seeing a Flag formation in Daily time frame & Weekly time frame shows strong rejection in downside.
After a scary H&S pattern the stock gave Wedge breakout but broad market pulled the price down again.
Personally one more strong conviction it has taken a great 20 EMA support in Weekly pattern.
CMP : 153
Strong demand zone : 140
Target : 180,190


MANAPPURAM is Making Symmetrical Triangle Pattern (Breakout)Manappuram Finance Limited : Non-Banking Financial Company ( NSE:MANAPPURAM ) is Making Symmetrical Triangle Pattern (PATTERN BREAKOUT TRADE).
This can become a very good trade for iNTRADAY Traders.
Target + StopLoss: There is no target here. You keep the first target as much as the StopLoss you put. And the StopLoss will be the Low/High of the candle that BROKE this pattern. Or Low/High swing backward inside the pattern.
And as soon as you get a profit of 0.70% of your TARGET , you will trail your StopLoss and bring it to the entry point. And as soon as your first target is hit, you will release half of your total quantity and continue to trail your StopLoss above the last swing Low/High.
Target and StopLoss are never already FiXED in the chart pattern.
You always have to trade only by M oney Management, P osition Sizing, S topLoss Trailing. This is the way to stay in PROFiT .
If you want to get something good like this EVERYDAY then follow me here on TradingView now.
Chart Published By Ravinder Sharma
Thank U.

Double bottom - still 163 above is good.Price made a double bottom at 140 level and went up by 13 points last trading day. Still 163 above is the buying level as discussed previously but when you see a double bottom one can risk with small stop loss and definitely you will be in a good position when it reaches 163 !!! Think about it.

