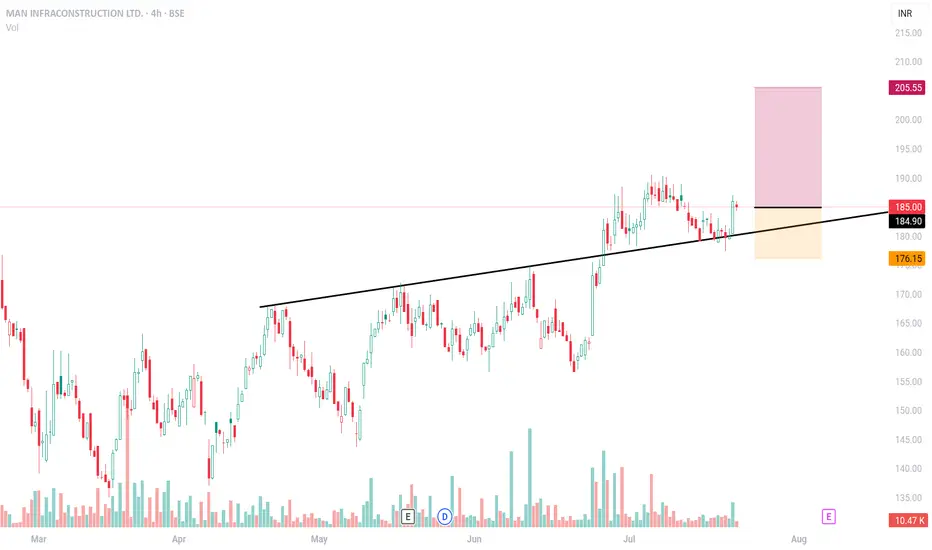
Short term swing setupExpecting 10 % up move from this price range
#Tight SL
#If price lagging. Exit from position
Next report date
≈
August 7
Report period
Q1 2025
EPS estimate
—
Revenue estimate
—
7.58 INR
2.83 B INR
11.07 B INR
117.57 M
About MAN INFRA LTD
Sector
Industry
CEO
Manan Parag Shah
Website
Headquarters
Mumbai
Founded
2002
ISIN
INE949H01023
FIGI
BBG000R3LDC8
Man Infraconstruction Ltd. operates as a holding company, which engages in the construction business. It operates through the Engineering, Procurement, and Construction (EPC), and Real Estate business segments. The company was founded by Prabodh Shah on August 16, 2002 and is headquartered in Mumbai, India.
15%
20%
25%
30%
35%
Q4 '23
Q1 '24
Q2 '24
Q3 '24
Q4 '24
0.00
900.00 M
1.80 B
2.70 B
3.60 B
Revenue
Net income
Net margin %
Revenue
COGS
Gross profit
Op expenses
Op income
Non-Op income/ expenses
Taxes & Other
Net income
0.00
800.00 M
1.60 B
2.40 B
3.20 B
Revenue
COGS
Gross profit
Expenses & adjustments
Net income
0.00
800.00 M
1.60 B
2.40 B
3.20 B
Q4 '23
Q1 '24
Q2 '24
Q3 '24
Q4 '24
0.00
1.20 B
2.40 B
3.60 B
4.80 B
Debt
Free cash flow
Cash & equivalents
No news here
Looks like there's nothing to report right now


MANINFRA Trading Above Demand Zone (139.95-135.85)MANINFRA is currently trading at 139.96, above its demand zone range of 139.95 to 135.85. Investors may watch for potential reactions or reversals from this level.
Disclaimer: This analysis is for informational purposes only and should not be considered financial advice. Please perform your own due
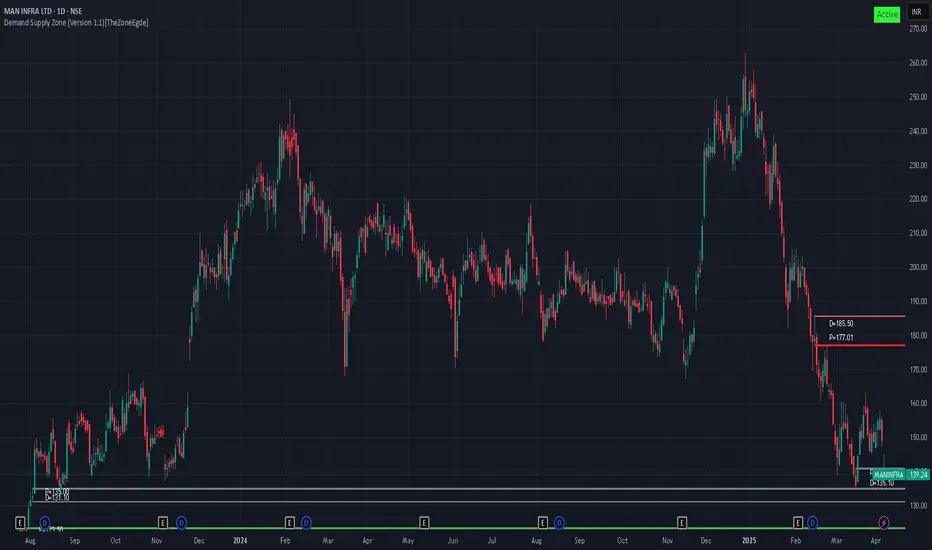
MANINFRA Trading Within Demand Zone (139.95-135.85)The stock MANINFRA is currently trading at 139.06, within its demand zone ranging from 139.95 to 135.85. The last leg out occurred on 2023-08-28.
Disclaimer: This analysis is for informational purposes only and should not be considered financial advice. Please perform your own due diligence or cons

MANINFRA Trading Within Demand ZoneMANINFRA is currently trading at ₹147.95, within the demand zone ranging from ₹147.9 (baseHigh) to ₹143.8 (baseLow), identified on 20th November 2023. This zone may act as a support level, potentially attracting buyers. Investors should monitor price action for signs of stability or reversal before

MAN INFRA: potential upside move<Man infra has successfully given breakout of two good chart patterns.
<Flag and pole which is clearly visible.
<Triangle pattern which can be seen if we draw a line from top red candle to the <breakout candle respecting all the wicks.
<We are learning this trade respecting the flag pattern.
<The st

MANINFRA looks for for short term After a long uptrend ; the stock accumulated since almost 1 year,
There is very low volume trading in accumulation (Consolidation) phase
stock gave BO with volume and massive 10% bullish marubozu candle breaking previous lower high in last trading session; but strong buying force left some ineffi

Technical Analysis for Man Infraconstruction (MANINFRA):
Time Frame: 1 Hour
Trade Type: Swing trade for 10 days
Key Highlights:
Breakout of resistance zone
Strong volume confirming the breakout
Consolidation breakout
Bullish momentum in a higher time frame
Entry Strategy: Entry activated
Stop Loss (SL): ₹237.50
Target: ₹295
Risk-Reward Ratio: Favorable


See all ideas
Summarizing what the indicators are suggesting.
Oscillators
Neutral
SellBuy
Strong sellStrong buy
Strong sellSellNeutralBuyStrong buy
Oscillators
Neutral
SellBuy
Strong sellStrong buy
Strong sellSellNeutralBuyStrong buy
Summary
Neutral
SellBuy
Strong sellStrong buy
Strong sellSellNeutralBuyStrong buy
Summary
Neutral
SellBuy
Strong sellStrong buy
Strong sellSellNeutralBuyStrong buy
Summary
Neutral
SellBuy
Strong sellStrong buy
Strong sellSellNeutralBuyStrong buy
Moving Averages
Neutral
SellBuy
Strong sellStrong buy
Strong sellSellNeutralBuyStrong buy
Moving Averages
Neutral
SellBuy
Strong sellStrong buy
Strong sellSellNeutralBuyStrong buy
Displays a symbol's price movements over previous years to identify recurring trends.
Frequently Asked Questions
The current price of MANINFRA is 178.78 INR — it has decreased by −2.02% in the past 24 hours. Watch MAN INFRA LTD stock price performance more closely on the chart.
Depending on the exchange, the stock ticker may vary. For instance, on NSE exchange MAN INFRA LTD stocks are traded under the ticker MANINFRA.
MANINFRA stock has risen by 1.14% compared to the previous week, the month change is a 1.39% rise, over the last year MAN INFRA LTD has showed a −16.84% decrease.
MANINFRA reached its all-time high on Dec 30, 2024 with the price of 262.80 INR, and its all-time low was 9.27 INR and was reached on Mar 24, 2020. View more price dynamics on MANINFRA chart.
See other stocks reaching their highest and lowest prices.
See other stocks reaching their highest and lowest prices.
MANINFRA stock is 2.44% volatile and has beta coefficient of 2.04. Track MAN INFRA LTD stock price on the chart and check out the list of the most volatile stocks — is MAN INFRA LTD there?
Today MAN INFRA LTD has the market capitalization of 65.69 B, it has decreased by −1.13% over the last week.
Yes, you can track MAN INFRA LTD financials in yearly and quarterly reports right on TradingView.
MAN INFRA LTD is going to release the next earnings report on Aug 7, 2025. Keep track of upcoming events with our Earnings Calendar.
MANINFRA net income for the last quarter is 769.26 M INR, while the quarter before that showed 837.60 M INR of net income which accounts for −8.16% change. Track more MAN INFRA LTD financial stats to get the full picture.
MAN INFRA LTD dividend yield was 0.60% in 2024, and payout ratio reached 11.86%. The year before the numbers were 0.79% and 20.02% correspondingly. See high-dividend stocks and find more opportunities for your portfolio.
As of Jul 29, 2025, the company has 470 employees. See our rating of the largest employees — is MAN INFRA LTD on this list?
EBITDA measures a company's operating performance, its growth signifies an improvement in the efficiency of a company. MAN INFRA LTD EBITDA is 3.24 B INR, and current EBITDA margin is 29.76%. See more stats in MAN INFRA LTD financial statements.
Like other stocks, MANINFRA shares are traded on stock exchanges, e.g. Nasdaq, Nyse, Euronext, and the easiest way to buy them is through an online stock broker. To do this, you need to open an account and follow a broker's procedures, then start trading. You can trade MAN INFRA LTD stock right from TradingView charts — choose your broker and connect to your account.
Investing in stocks requires a comprehensive research: you should carefully study all the available data, e.g. company's financials, related news, and its technical analysis. So MAN INFRA LTD technincal analysis shows the neutral today, and its 1 week rating is buy. Since market conditions are prone to changes, it's worth looking a bit further into the future — according to the 1 month rating MAN INFRA LTD stock shows the buy signal. See more of MAN INFRA LTD technicals for a more comprehensive analysis.
If you're still not sure, try looking for inspiration in our curated watchlists.
If you're still not sure, try looking for inspiration in our curated watchlists.