Maruti Short Targets : 12460, 12410 Now @ 12530Maruti has given short signal today. Nifty is short now on mots of indicators. Chart analysis is clear that for few more sessions , the trend is down. Long targets earlier given are intact for positional traders, here are the short targets : 12460, 12410.
#Nifty50 #BankNifty #Sensex #StockMarketIndia #PriceAction #HNIInvestors #HedgeFund #TechnicalAnalysis #DayTrading
MARUTI trade ideas

Maruti continuous long signal : toady's 12575#Maruti moves with purpose, picking her day to act. Today's long signal 12575, aiming for 12900+, a pattern see often in last weeks. Now @ 12514. Other levels marked in saffron in the pciture.
#Nifty50 #BankNifty #Sensex #StockMarketIndia #StockMarket #HNIInvestors #HedgeFund #SwingTrading

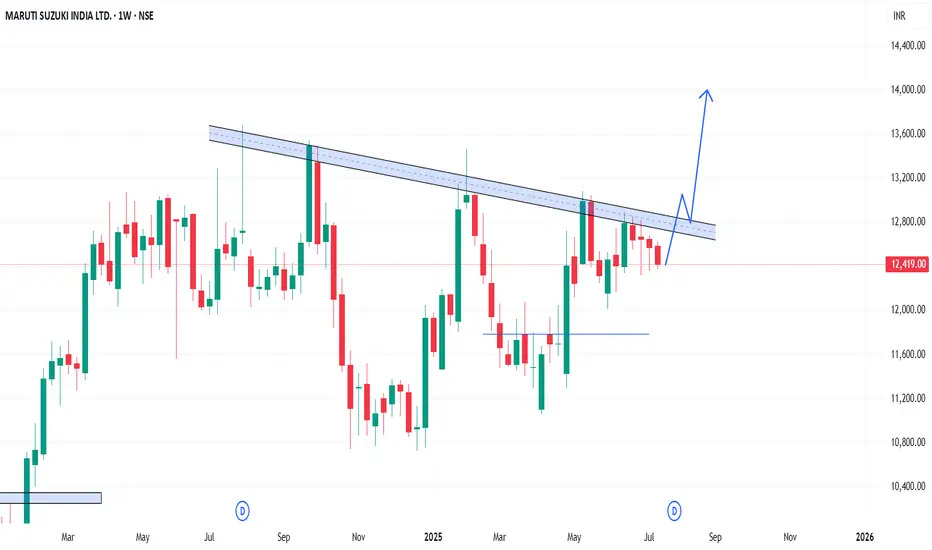
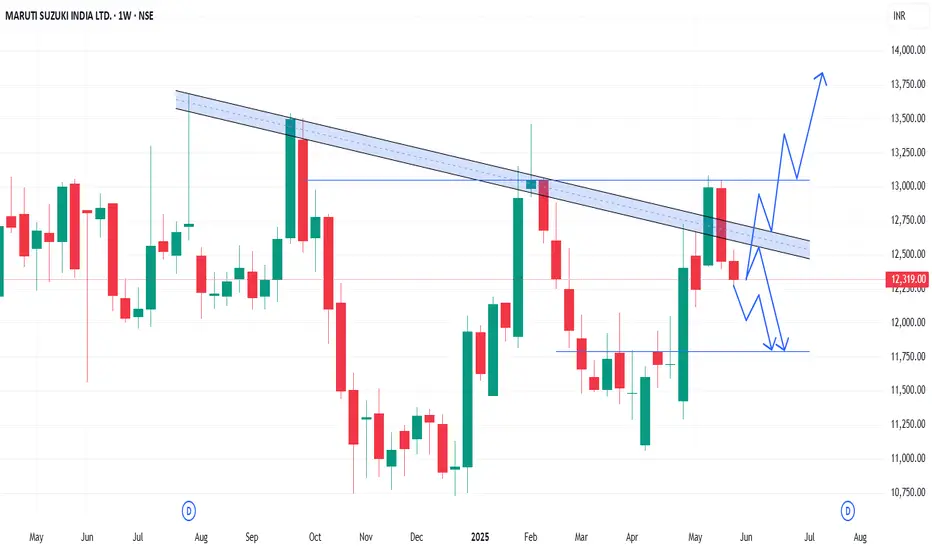
MARUTI - Weekly AnalysisIn the Weekly Chart of MARUTI ,
we can see that, Inverted Head & Shoulder failed.
It has now created 2 inside candles.
it will soon take a any of the side momentume.
My expected momentum is shown in chart.
Maruti Suzuki Cup & Handle WEEKLY Breakout Setup FormingMaruti Suzuki is forming a classic Cup & Handle pattern on the weekly chart. A breakout above the 13,547 resistance zone may ignite a strong bullish move. Until then, price may continue to consolidate in the handle formation. Traders should keep an eye on the Safe Entry and BreakOUT levels for confirmation.
📌 Key Technical Highlights:
Cup and Handle Pattern forming
Strong Resistance: 13,547
Potential Breakout Zone: 13,547–13,680
Handle support at 12,465
Downside risk exists if handle breaks below key trendline
📈 Upside Target Levels:
Target 1: 14,105
Target 2: 14,707
Target 3: 14,950
Monthly Target: 15,282
📉 Downside Risk Levels (if pattern fails):
Support 1: 12,465
Support 2: 12,133
Support 3: 11,800
Breakdown Level: 10,724
💡 Strategy Outlook:
Wait for a breakout above 13,547 with volume for confirmation. Until then, price may range inside the handle zone. Aggressive traders may play the handle bounce, while conservative traders can wait for breakout retest.
⚠️ Disclaimer:
We are not SEBI registered. This analysis is only for educational purposes. Please consult your financial advisor before making any trading or investment decisions.

Maruti - Strong Option Chain Signals for Potential Trade Setups________________________________________________________________________________
MARUTI
Bias: Bullish Bias
Strong Long Build-Up across Call strikes (12700–13500)
Simultaneous Short Build-Up on Puts — classic bullish confirmation
________________________________________________________________________________
Best CE:
Strike: 12800
LTP: ₹138.3
OI: 5,14,100 (+78,350 | +17.98%)
Volume: 17,570
Build-Up: Long Build-Up
Interpretation: High OI addition + price rise = active bullish bets at 12800
________________________________________________________________________________
Best PE:
Strike: 12600
LTP: ₹159
OI: 1,05,700 (+76,600 | +263.23%)
Volume: 10,114
Build-Up: Short Build-Up
Interpretation: Strong put writing at 12600 suggests immediate support here
________________________________________________________________________________
Best Strategy:
Bull Call Spread or Naked Call Buy
(Buy 12800 CE, Sell 13200 or 13500 CE for risk-defined play)
- Directional bullish play
- Room to run till 13200–13500 zone based on fresh CE buildup
- Ideal if Spot sustains above 12600
________________________________________________________________________________
Why:
- Long Build-Up seen from 12700 CE to 13500 CE
- Spot = ₹12650, and 12600 PE has heavy Put writing → firm base
- Call Short Covering seen at 12500, 12600 → unwinding resistance
- IVs are rising on PEs, falling on CEs → supports bullish sentiment
- 12800 CE has highest Long Build-Up + Volume → key upside breakout strike
- Above 12800, next resistance zones visible around 13200–13500 based on CE action
________________________________________________________________________________
⚠️ Disclaimer (Please Read):
• This chart is shared for educational purposes only and is not investment advice.
• I am not a SEBI-registered advisor.
• The information provided here is based on personal market observation.
• No buy/sell recommendations are being made.
• Please do your own research or consult a registered financial advisor before making any trading decisions.
• Trading involves risk. Always use proper risk management.
________________________________________________________________________________
💬 Found this helpful?
Drop your thoughts or questions in the comments below ⬇️
🔁 Share this post with your trading community.
✅ Follow simpletradewithpatience for price-action backed technical setups.
🚀 Let’s trade with patience, logic, and clarity!
Be Self-Reliant | Trade with Patience | Learn with Logic
[Intraday] Maruti 3BBR BetNote -
One of the best forms of Price Action is to not try to predict at all. Instead of that, ACT on the price. So, this chart tells at "where" to act in "what direction. Unless it triggers, like, let's say the candle doesn't break the level which says "Buy if it breaks", You should not buy at all.
=======
I use shorthands for my trades.
"Positional" - means You can carry these positions and I do not see sharp volatility ahead. (I tally upcoming events and many small kinds of stuff to my own tiny capacity.)
"Intraday" -means You must close this position at any cost by the end of the day.
"Theta" , "Bounce" , "3BB" or "Entropy" - My own systems.
=======
I won't personally follow any rules. If I "think" (It is never gut feel. It is always some reason.) the trade is wrong, I may take reverse trade. I may carry forward an intraday position. What is meant here - You shouldn't follow me because I may miss updating. You should follow the system I share.
=======
Like -
Always follow a stop loss.
In the case of Intraday trades, it is mostly the "Day's High".
In the case of Positional trades, it is mostly the previous swings.
I do not use Stop Loss most of the time. But I manage my risk with options as I do most of the trades using derivatives

MARUTIStock broke previous high with rsi above 60 in yesterdays session and made fake breakoud currently testing strong support high probablity of bounce holding with tiny SL based on candle closing only

MARUTI - Trendline Breakout in Play | Upside Targets.Maruti Suzuki is currently forming a bullish structure after breaking out from a key downward trendline. This trendline breakout, marked on the chart as “TrendLine Breakout Entry”, acts as a critical inflection point and confirms buyer interest returning near support levels.
Price is now testing the upward support trendline, and as long as it holds above the key zone of ₹12,594, the setup remains bullish.
Scenario 1: Bullish Continuation
If price sustains above the support and reclaims ₹12,732.15, it opens room for the following targets:
Target 1: ₹12,800.00
Target 2: ₹12,915.20
Target 3: ₹13,050.00
Monthly Target: ₹13,299.85
A clean move above ₹13,086 will confirm strong bullish momentum and may trigger larger positional moves toward the yellow resistance zone above ₹13,500+.
Scenario 2: Breakdown Invalidates Setup
If the price breaks below ₹12,594, and further below the next minor support at ₹12,551.40, bearish pressure could pull the price down to:
₹12,425.25
₹12,269.15
Final Support: ₹12,016.80
Trade Plan:
Entry Zone (on pullback or breakout): ₹12,594 – ₹12,732
Stop Loss: Below ₹12,551
Targets: ₹12,800 → ₹12,915 → ₹13,050 → ₹13,299
Risk-Reward: Favorable if entry is near trendline or on breakout with volume confirmation.
This trade idea is supported by both technical trendline breakout and fundamental optimism in the auto sector recovery and Maruti’s strong sales momentum. Keep watch on volume spikes and breakout candle confirmation.
Disclaimer:
This analysis is for educational purposes only. Please use your own risk management and consult your financial advisor before taking any entry or exit.

MARUTI – Strong Call Long Build-Up Dominance________________________________________
📈 MARUTI – Strong Call Long Build-Up Dominance | OI + Price Action Analysis
🕒 Chart Type: 15-Minute
📆 Date: July 3, 2025
________________________________________
🔍 What’s Catching Our Eye:
MARUTI closed around ₹12,752, and the entire Call side up to 13,500 is showing strong Long Build-Up, indicating aggressive bullish sentiment from option buyers. Meanwhile, the Put side is displaying Short Build-Up, further confirming bullish undertones. The price is steadily climbing, supported by strong institutional participation.
________________________________________
📌 What We’re Watching For:
If MARUTI sustains above ₹12,800, bullish continuation looks likely. Watch for follow-through toward ₹13,000 and 13,200+ if momentum persists. However, a drop below ₹12,500 could temporarily halt this upward bias.
________________________________________
📊 Volume Footprint:
Options activity is backed by strong volume — over 17k+ contracts at ₹13,000 CE and 15k+ at ₹12,800 CE — showing traders are betting big on further upside.
________________________________________
📈 Option Chain Highlights:
The OI data is highly supportive of the bulls:
• Calls (Long Build-Up):
o ₹13,000 CE: +104,450 OI | Price ↑ 8.6%
o ₹12,800 CE: +101,800 OI | Price ↑ 12.04%
o ₹12,900 CE: +95,650 OI | Price ↑ 10.07%
o Even OTM CE like ₹13,500 is active → trend belief is strong
• Puts:
o ₹12,800 PE & ₹12,700 PE both showing Short Build-Up, i.e., buyers believe downside is limited
Inference: Bulls are clearly in control, with both Call buyers active and Put sellers stepping in. This aligns with the broader bullish trend seen in the stock.
________________________________________
🔁 Trend Bias:
🟢 Bullish – Confirmed via price action and derivative sentiment
________________________________________
🧠 Trade Logic / Reasoning:
Strong accumulation is seen at every major Call level, from ATM to slightly OTM strikes. Short covering at ₹12,500 CE and long build-up in higher CE strikes confirms that the bulls are expecting a continuation rally. PE writers are unwinding or adding shorts – classic sign of strength.
________________________________________
📍 Important Levels to Mark:
🔺 Top Range (Resistance): ₹13,200 – ₹13,500
🔻 Bottom Range (Support): ₹12,500
________________________________________
🎯 Trade Plan (Educational Purpose Only):
✅ Best Buy (Equity): Above ₹12,800 with strong bullish candle
✅ Best Sell (Equity): Avoid unless ₹12,500 is broken
✅ Best CE to Long: ₹13,000 CE – Strongest long build-up with momentum
✅ Best PE to Long: Avoid PE long – sentiment doesn’t support bearish bets
🟢 Demand Zone: NA
🔴 Supply Zone: NA
⚠️ Invalidation Below:
Bullish bias is invalidated below ₹12,500 with high volume selling
________________________________________
⚠️ Disclaimer:
This analysis is for educational purposes only.
STWP is not a SEBI-registered advisor.
No buy/sell recommendations are made.
Please consult your financial advisor before trading.
STWP is not responsible for trading decisions based on this post.
________________________________________
💬 Did this help you spot the momentum early?
Drop your views in the comments ⬇️
🔁 Share this with traders watching MARUTI
✅ Follow STWP for clean price + option chain trades
🚀 Let’s educate more traders with patience and clarity!
________________________________________
MARUTI ANALYSIS 03-JUL-2025: GOING TO 16K/21K+LTP 12742
SUPPORTS: 10655.9071/6400
As long as Maruti above 10655, I expect to see 13400 again and further 15K, 16400, 17700-18300-19400.
Extensions 22000-22720-24600

Maruti in Forward Gear - May Climb 13000 #Maruti corrected little today. Has resistance around 12700. Long Targets are : 12860, 12900,13000, 13100
->Maruti has strong upward momentum
->Market has strong upward momentum
->Is Long on Golden Death Indicators
->Is Long on weekly charts
#stocks #StocksInFocus #StockMarketIndia #Nifty #TargetHit #PriceAction
Please consult a qualified SEBI-registered advisor before making investment decisions.

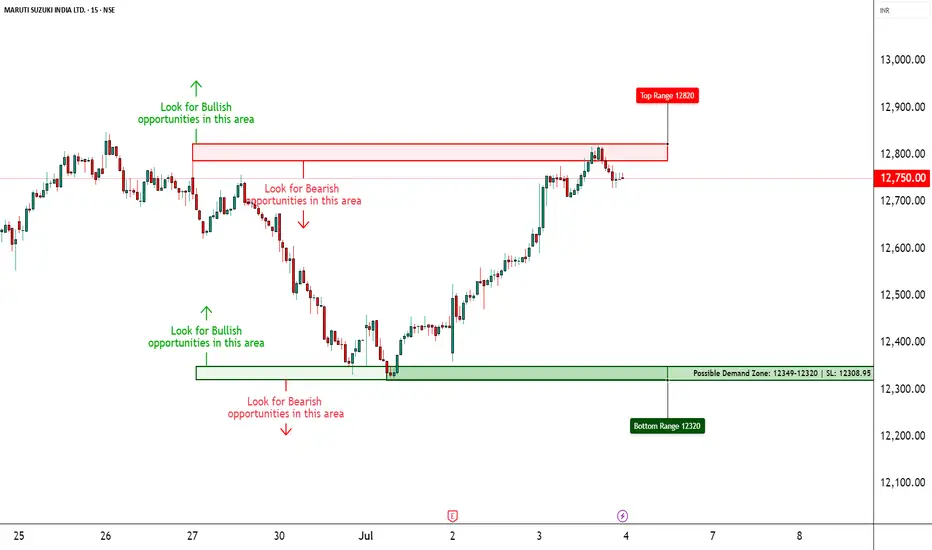
MARUTI SUZUKI INDIA LTD. – INTRADAY ZONE ANALYSIS________________________________________________________________________________📈 MARUTI SUZUKI INDIA LTD. – INTRADAY ZONE ANALYSIS
📆 Date: June 29, 2025 | ⏱ Timeframe: 15-Minute Chart
🔍 Educational Analysis for Learning Purposes Only
________________________________________________________________________________
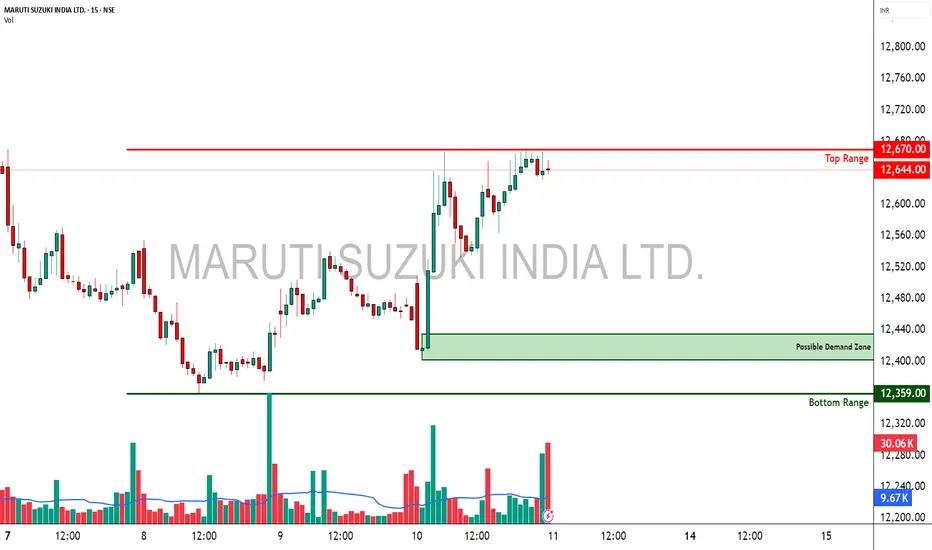
📊 Zone Breakdown:
• 🔴 Top Range Resistance – 12,848
Marked in Red: This area has previously acted as a supply zone, where prices were rejected sharply. It is a potential region to watch for bearish reversal patterns, especially if price rises into this zone on weak volume or shows rejection candles like shooting star or bearish engulfing.
• 🟠 Neutral Zone (No Trade Zone) – Between ~12,720 to ~12,680
Marked in Orange: This is an indecision zone, where price has shown choppiness in the past. It is advisable to stay cautious and avoid trades here, as clear momentum is often missing in this range.
• 🟢 Support Zone – 12,617
Marked in Green: This is the demand zone, where price previously reversed on higher volume. It is a good region to observe for bullish candlestick confirmation patterns (e.g., hammer, bullish engulfing, morning star) on intraday timeframes.
________________________________________________________________________________
🔍 Candlestick Pattern Observation:
At the support zone (12,617), the most recent candle (the last one) shows a long lower wick with a bullish body, forming a bullish hammer-like structure.
• 🧠 Interpretation: This suggests possible buying interest at lower levels, especially since it coincides with volume spike, indicating potential reversal.
• 📌 However, confirmation from the next candle (closing above 12,670 with decent volume) would be required before validating it as a bullish reversal.
________________________________________________________________________________
⚙️ Educational Trade Idea (For Study Purpose Only):
▶️ Potential Long Trade Setup (Bullish Bias)
• Entry (Low-Risk Learner Zone): Around 12,670–12,675, only if next candle shows bullish strength
• Stop Loss: Below 12,617 (zone low) → e.g., 12,600
🧠 Reasoning:
• Price is reacting from a well-identified demand zone
• Volume spike confirms possible accumulation
• Candle with rejection wick hints at reversal interest
• Risk-reward approx. 1:2 or better depending on exit point
________________________________________________________________________________
⚠️ Disclaimer (SEBI-Compliant):
This analysis is shared strictly for educational and informational purposes. It does not constitute investment advice or a recommendation to trade. Viewers are encouraged to use this for learning technical chart reading and should consult a registered advisor before making any financial decisions.
STWP | Learn. Trade. Grow.
________________________________________________________________________________
What do you think about this setup?
Did you spot any other patterns or zones?
👇 Drop your comments below — let’s grow together!
________________________________________________________________________________

Maruti Suzuki India Ltd.Maruti Suzuki India Ltd. (MSIL) operates a robust business model centered on manufacturing, selling, and servicing passenger vehicles in India, with a focus on affordability, fuel efficiency, and a strong distribution network.
1. Core Business: Vehicle Manufacturing and Sales
Product Portfolio: MSIL produces 22 models across segments, including hatchbacks (e.g., Swift, Alto K10), sedans (e.g., Dzire), SUVs (e.g., Grand Vitara, Brezza), and MPVs (e.g., Ertiga). It offers petrol, CNG, hybrid, and electric (e.g., e-Vitara) powertrains to cater to diverse customer preferences.
Market Positioning: Focuses on affordable, fuel-efficient vehicles for the mass market, though it is expanding into premium SUVs and EVs to compete with rivals like Hyundai and Tata Motors.
Revenue Stream: Primary revenue comes from vehicle sales, contributing the bulk of its ₹152,913 crore revenue in FY25. Domestic sales dominate, with exports to over 100 countries (e.g., Latin America, Africa).
2. Production and Supply Chain
Manufacturing: Operates plants in Gurugram, Manesar, and Gujarat (via the merged Suzuki Motor Gujarat Pvt. Ltd.). These facilities produce over 2 million vehicles annually, with a focus on localization to reduce costs (up to 90% local components).
Economies of Scale: High production volumes and a lean supply chain enable competitive pricing. MSIL collaborates with Suzuki Motor Corporation (Japan) for technology and R&D, including hybrid and EV development.
Rare Earth Strategy: Despite global rare earth shortages impacting EV production (e.g., e-Vitara targets cut from 26,500 to 8,200 units for April–September 2025), MSIL claims no immediate operational disruptions.
3. Distribution and Sales Network
Extensive Reach: Operates over 3,000 sales outlets (e.g., Arena, Nexa) across 2,000+ cities, ensuring accessibility in urban and rural markets.
Nexa Premium Channel: Targets premium customers with models like Grand Vitara and Fronx, contributing to 20% of sales.
True Value: A pre-owned car business with over 600 outlets, enhancing brand loyalty and generating additional revenue through used-car sales.
4. After-Sales and Service
Service Network: Over 4,500 service touchpoints, servicing 24.5 lakh vehicles in May 2025 alone. Plans to expand to 8,000 touchpoints by FY31, including 1,500 EV-enabled workshops.
Revenue Stream: Spare parts, accessories, and service contracts provide recurring income, bolstered by high customer retention due to low maintenance costs and widespread availability.
5. Ancillary Services
Financing: Partnerships with banks like ESAF and Equitas Small Finance Bank offer retail financing for new, used, and commercial vehicles, targeting Tier II and III cities.
Insurance and Accessories: Maruti Suzuki Insurance and genuine accessories (e.g., alloy wheels, infotainment systems) add revenue streams.
Driving Schools: Maruti Driving Schools train customers, reinforcing brand engagement.
6. Innovation and Sustainability
R&D Focus: Invests in hybrid, CNG, and EV technologies to align with India’s sustainability goals and compete in the growing SUV and EV markets (e.g., e-Vitara, series hybrid for Fronx/Baleno).
Digital Integration: Suzuki Connect offers connected car features like remote diagnostics and geofencing, enhancing customer experience.
CNG Leadership: Commands a 73% share in India’s CNG vehicle market, capitalizing on demand for fuel-efficient alternatives.
7. Revenue Model Breakdown
Primary Revenue: Vehicle sales (domestic ~80%, exports ~10%).
Secondary Revenue: After-sales services, spare parts, accessories, insurance, and financing.
Profitability: FY25 net profit of ₹14,256.3 crore on ₹152,913 crore revenue, with a 9.3% profit margin, driven by cost efficiency and high sales volume despite a 4.3% profit dip in Q4 FY25.
8. Challenges and Adaptations
Market Share Decline: Dropped from 51% in 2020 to under 41% in 2025 due to competition in SUVs and EVs. MSIL counters with new launches (e.g., Escudo, e-Vitara) and hybrid technology.
Small Car Segment: Declining demand for entry-level cars (e.g., Alto) prompted MSIL to seek government support for revival.
Global Supply Risks: Rare earth shortages pose challenges for EV scaling, though MSIL mitigates through diversified sourcing and localized production.
Strategic Edge
MSIL’s business model leverages its dominant market presence, cost leadership, and extensive network to maintain profitability. By diversifying into SUVs, EVs, and hybrids while strengthening financing and service offerings, it aims to counter competitive pressures and sustain growth in a shifting automotive landscape.
Recent News and Developments (as of June 27, 2025):
New Vehicle Launches:
Maruti Suzuki Escudo: A new mid-size SUV, codenamed Y17, is set to launch around Diwali 2025. It will compete with the Hyundai Creta and Kia Seltos, offering petrol, hybrid, and CNG powertrains. The Escudo is expected to feature a larger touchscreen than the 9-inch unit in the Grand Vitara, along with safety features like six airbags, ABS with EBD, and potentially Advanced Driver Assistance Systems (ADAS).
e-Vitara Electric SUV: Maruti’s first electric vehicle, the e-Vitara, is slated for a September 2025 launch. It debuted at the 2025 Bharat Mobility Global Expo and is expected to offer a range of up to 500 km, competing with the Hyundai Creta Electric. However, production targets for April–September 2025 were cut by two-thirds (from 26,500 to 8,200 units) due to a global rare earth supply crisis, though MSIL claims no immediate impact on operations.
Grand Vitara S-CNG: Launched in June 2025, this model includes premium features like a 9-inch SmartPlay Pro+ infotainment system, wireless charging, ventilated seats, and Suzuki Connect.
New Compact MPV (YDB): Based on the Suzuki Spacia, this sub-4-meter MPV with a hybrid engine is expected to launch in 2026–27.
Series Hybrid Engine: MSIL is developing a new hybrid engine for mass-market models like the Fronx, Baleno, and Brezza, with the Fronx facelift expected in 2025.

Maruti Showing Bullish Flag ( educational purpose only)Maruti currently around 12500 to reach 12700 soon.
1. Strong support at current levels
2. Golden Cross recently done and trading over 50 DMA
3. Nifty Trend Up
This is not an investment advise. Please consult your financial advisor.

Maruti Suzuki INDIA LTD. on 4H TF...Trade on Breakout & Breakdown on lower Time Frame... I suggest 1H Time Frame...
You can also Trade Trendline like support & resistance...
Do on your own risk!

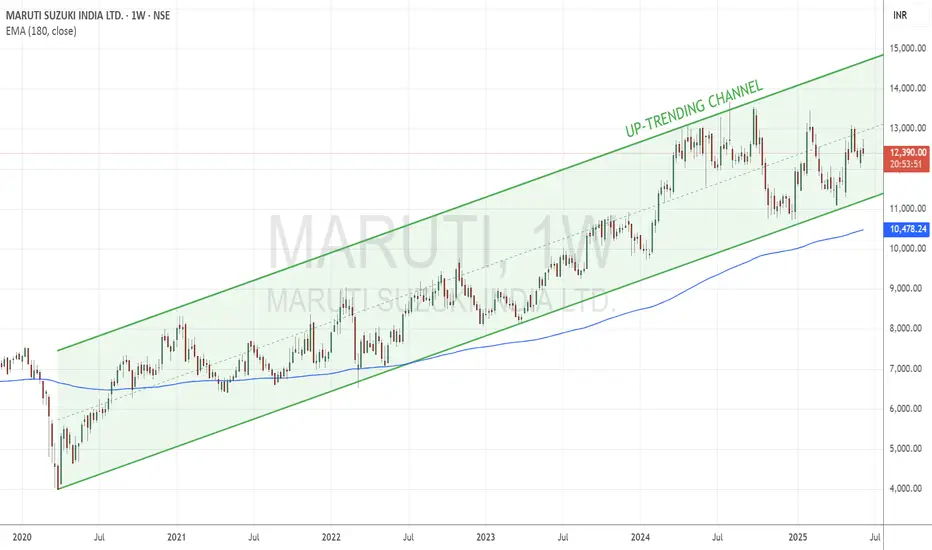
Maruti Moves Steadily Higher Within a Structured Bullish ChannelTopic Statement:
Maruti is on a moderate bullish run, trading within a defined uptrending channel and supported by key price levels.
Key Points:
* The stock is moving in an uptrending channel, making it suitable for consistent channel-based trading
* Price remains mostly above the 180-day EMA, offering good accumulation opportunities near the EMA
* Strong support has been observed at the 13,000 level, with crucial long-term support around 11,000
* A breakout above or below these levels could lead to significant directional movement
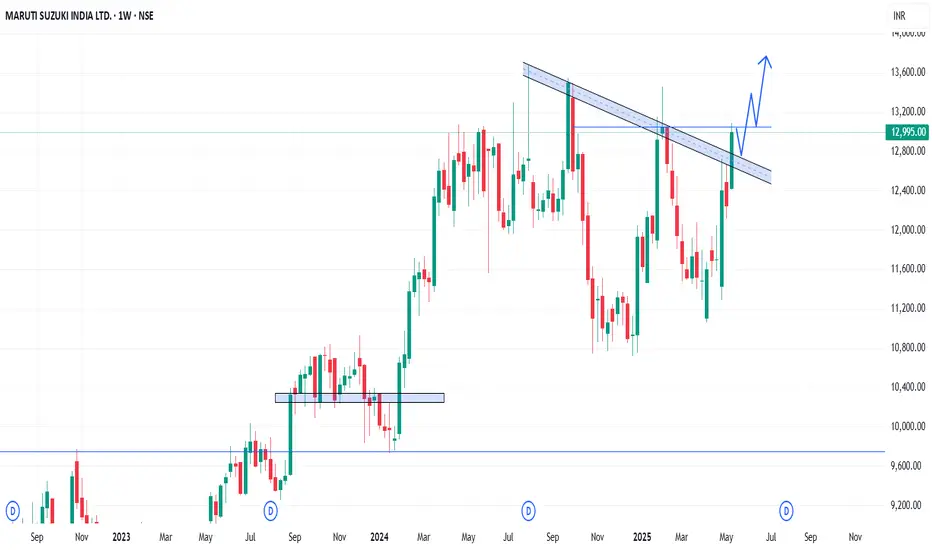
MARUTI - Weekly AnalysisIn the Weekly Chart of MARUTI ,
we can see that; it has shown rejection of Inverted H&S and Cup & Handle at the same time.
Even after rejection, selling is not that strong as it should be.
Possible momentums are shown in chart.
Lets see what direction it takes in next few weeks.
MARUTI SetupMARUTI Setup 🚗📉
😤 Still bearish as long as it stays below ₹12,500
📉 Any bounce = shorting opportunity
🛑 SL: Above ₹12,550
🎯 Target: ₹11,986
Let it drop, ride the wave 💥⚙️

Maruti: A good short term opportunity setting upHello,
Maruti Suzuki India Ltd, a subsidiary of Suzuki Motor Corp. The company is engaged in the manufacturing, purchase, and sale of motor vehicles, components, and spare parts. Its other activities include the facilitation of pre-owned car sales, fleet management, and car financing.
Maruti stock is trading at a very great point from a technical perspective & fundamental. Maruti Suzuki has said its first battery-electric vehicle, the E Vitara, will be exported to more than 100 countries, including Japan and Europe, from India. Investors are focusing on any updates on EV-related initiatives by the carmaker.
While the third-quarter net profit margin declined to 9.6% from 9.8% a year earlier due to higher promotional expenses Investors will be closely monitoring margin trends as automakers globally are dealing with relatively high inflation. Maruti Suzuki raised its car prices earlier this month due to rising costs and operational expenses. Investors will be paying attention to the pace of export growth.
While the electric car business is facing challenges as more manufacturers are beginning to believe they might not be able to compete with companies such as Tesla, we believe that Maruti Suzuki will continue to be a top manufacturer in its areas of operation. The companies are now choosing to switch to manufacture of hybrid vehicles than electric vehicles.
The MACD & Moving averages also point to a strong company that is at a good place to consider buying. We place a target of INR 13,800 on the stock with the entry near the shown support.
If you like my analysis, feel free to follow me on Tradingview & comment with the Indian companies you would like me to have a look at.
This is my personal trading journal, where I share insights and ideas. At times, I take trades outside ideal conditions to test strategies. Use this as inspiration but always perform your own analysis before making trading. Goodluck!

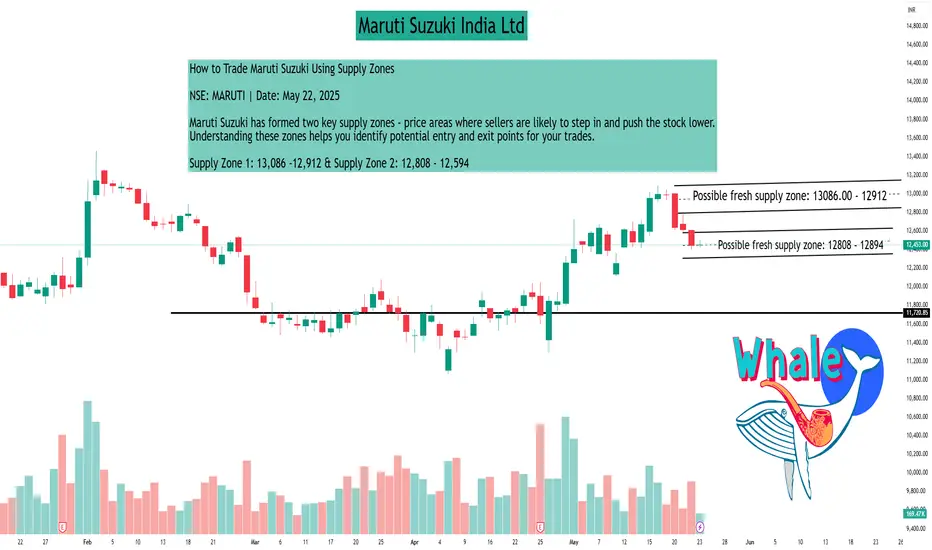
MARUTI SUZUKI INDIA LTD.MARUTI SUZUKI INDIA LTD.
How to Trade Maruti Suzuki Using Supply Zones
NSE: MARUTI | Date: May 22, 2025
Maruti Suzuki has formed two key supply zones - price areas where sellers are likely to step in and push the stock lower. Understanding these zones helps you identify potential entry and exit points for your trades.
Supply Zone 1: 13,086 -12,912 & Supply Zone 2: 12,808 - 12,594
Bearish Scenario:
Maruti is currently trading near 12,445, below both identified supply zones. Recent price action shows a strong bearish candle accompanied by above- average volume, indicating active selling pressure around these resistance levels. If the price continues to remain below 12,800, selling pressure may persist. Traders could consider cautious short-selling strategies either at current levels or wait for the price to move back into the supply zones for confirmation before initiating short positions. It is important to follow proper risk management practices, including placing stop-loss orders above the supply zones, to manage potential downside risks.
Bullish Scenario:
A sustained breakout above 13,100 with strong volume confirmation would indicate that buying interest has surpassed selling pressure within the supply zones. Such a breakout may invalidate the resistance levels and signal renewed upward momentum in the stock, presenting potential opportunities for long positions. Traders may consider initiating or increasing long positions once the breakout is confirmed through price action and volume. It is important to use appropriate risk management measures, such as placing stop-loss orders below the breakout level.
For Learners:
Think of supply zones like traffic jams for bulls - when the price enters these zones, you can expect potential slowdowns or reversals unless there's strong momentum to push through. Always combine supply zone analysis with other confirmations like volume, candlestick patterns, and broader market context.
▲ Risk Management Tip: Always trade with a clearly defined stop loss. Avoid entering positions impulsively. It is advisable to start with a smaller quantity and increase your exposure only if the price action confirms the continuation of the trend. Capital protection should always be the priority.
Disclaimer
This content is created purely for educational and informational purposes. It is not intended as investment advice, stock recommendations, or trading tips. Trading and investing in the stock market involves risk. Please consult with a SEBI- registered financial advisor before making any investment decisions. The author/creator is not registered with SEBI and shall not be held responsible for any losses incurred based on this information. Always do your own research and use proper risk management.
If you found this analysis helpful, don't forget to Follow, so you never miss out on a trade-worthy setup, breakout opportunity, or valuable educational insight again. Stay updated and trade smarter!?
Amazing breakout on WEEKLY Timeframe - MARUTICheckout an amazing breakout happened in the stock in Weekly timeframe, macroscopically seen in Daily timeframe. Having a great favor that the stock might be bullish expecting a staggering returns of minimum 25% TGT. IMPORTANT BREAKOUT LEVELS ARE ALWAYS RESPECTED!
NOTE for learners: Place the breakout levels as per the chart shared and track it yourself to get amazed!!
#No complicated chart patterns
#No big big indicators
#No Excel sheet or number magics
TRADE IDEA: WAIT FOR THE STOCK TO BREAKOUT IN WEEKLY TIMEFRAME ABOVE THIS LEVEL.
Checkout an amazing breakout happened in the stock in Weekly timeframe.
Breakouts happening in longer timeframe is way more powerful than the breakouts seen in Daily timeframe. You can blindly invest once the weekly candle closes above the breakout line and stay invested forever. Also these stocks breakouts are lifelong predictions, it means technically these breakouts happen giving more returns in the longer runs. Hence, even when the scrip makes a loss of 10% / 20% / 30% / 50%, the stock will regain and turn around. Once they again enter the same breakout level, they will flyyyyyyyyyyyy like a ROCKET if held in the portfolio in the longer run.
Time makes money, GREEDY & EGO will not make money.
Also, magically these breakouts tend to prove that the companies turn around and fundamentally becoming strong. Also the magic happens when more diversification is done in various sectors under various scripts with equal money invested in each N500 scripts.
The real deal is when to purchase and where to purchase the stock. That is where Breakout study comes into play.
Check this stock which has made an all time low and high chances that it makes a "V" shaped recovery.
> Taking support at last years support or breakout level
> High chances that it reverses from this point.
> Volume dried up badly in last few months / days.
> Very high suspicion based analysis and not based on chart patterns / candle patterns deeply.
> VALUABLE STOCK AVAILABLE AT A DISCOUNTED PRICE
> OPPURTUNITY TO ACCUMULATE ADEQUATE QUANTITY
> MARKET AFTER A CORRECTION / PANIC FALL TO MAKE GOOD INVESTMENT
DISCLAIMER : This is just for educational purpose. This type of analysis is equivalent to catching a falling knife. If you are a warrior, you throw all the knives back else you will be sorrow if it hits SL. Make sure to do your analysis well. This type of analysis only suits high risks investor and whose is willing to throw all the knives above irrespective of any sectoral rotation. BE VERY CAUTIOUS AS IT IS EXTREME BOTTOM FISHING.
HOWEVER, THIS IS HOW MULTIBAGGERS ARE CAUGHT !
STOCK IS AT RIGHT PE / RIGHT EVALUATION / MORE ROAD TO GROW / CORRECTED IV / EXCELLENT BOOKS / USING MARKET CRASH AS AN OPPURTUNITY / EPS AT SKY.
LET'S PUMP IN SOME MONEY AND REVOLUTIONIZE THE NATION'S ECONOMY!
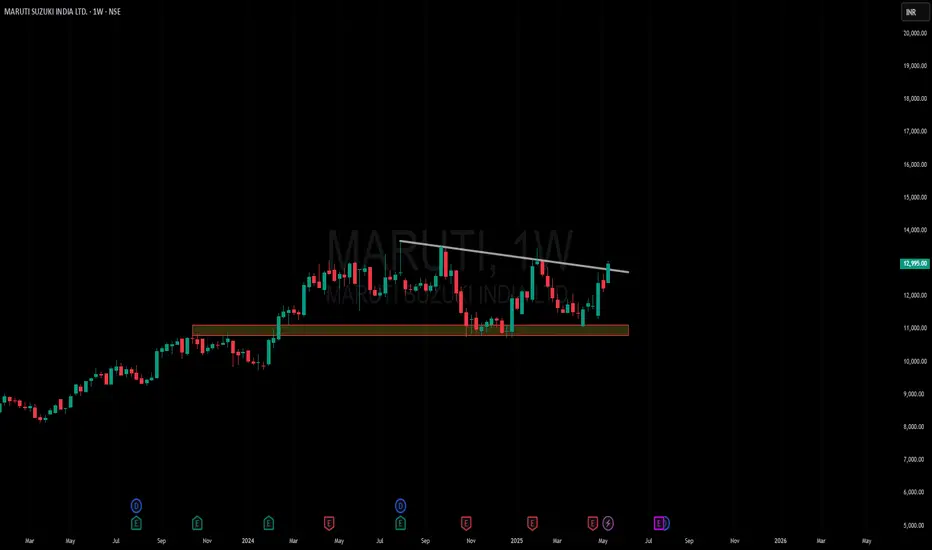
MARUTI - Weekly AnalysisIn the Weekly Chart of MARUTI ,
we can see that; it has given Parallel Lines breakout.
Let it retest and then enter with SL and New Target.
Expected momentum is shown in chart.
Maruti: Bullish triangle breakoutA clean triangle breakout for MARUTI. The upside target is 13620, and the stop is below the upper triangle line.
The entry validates once it gives a breakout and tests the upper line in the lower timeframe, not less than 4 hours.
RSI also has space for this price to meet the projected level.
