MCX trade ideas

MCX - Poll and FlagClear breakout and retesting the levels with strong bullish candle on Daily Time Frame.


MCXStock has given breakout from triangle pattern and now retesting the breakout levels. Buy above 1650 tgt 8 to 10% SL 1540. For education only. Kindly contact your financial advisor before entering any trade.

MCX chart support lines and resistance levels support and resistance levels
these are the basis levels as per price action the chart is showing a resistance from the trend line if it breaks the upper side huge upward move is possible

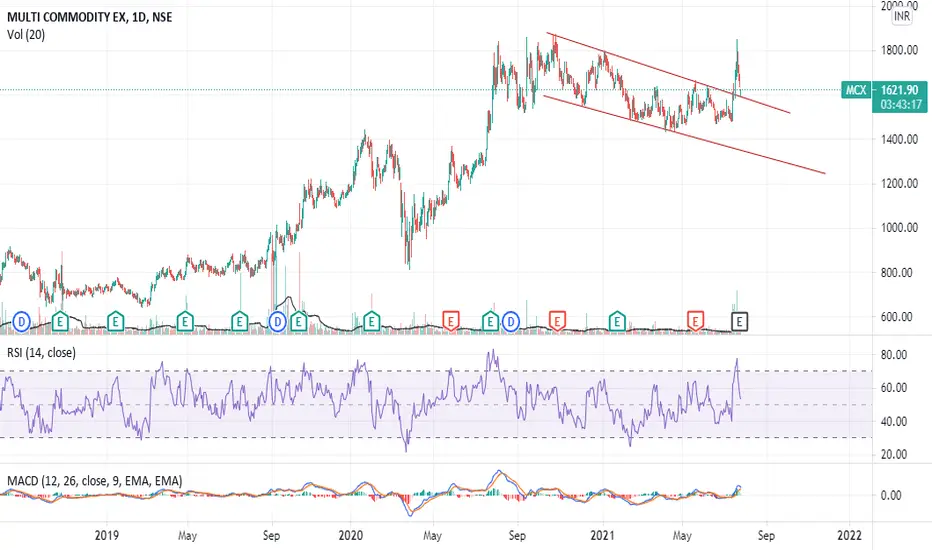
MCX breakout retest successful!Resistance line is retested as support as demand has increased. From couple of months it’s been moving in that channel now it’s time for a long.
Entry: above 1600
Target: 2000
SL: 1450
(It’s not an investment advice, do at your own risk)
Key points:
When a resistance is converted as support it means there are more bulls than bears amd demand for that has been. This can be a sign of bullish swing.
We should also look for another signs like candlestick pattern or look what fibonacci says.

Buy MCXBuy MCX near 1638-1643 Stoploss 1575 Target 1850
Demand & Supply Structure...Breakout & Retest Structure

MCXThe stock has given breakout from triangle pattern n now consolidating in a range ....good volumes seen at the time of breakout ...levels are mentioned in the chart


MCX Breakout- is it explosive?MCX has given a possible breakout, wait for the stock to retest and confirm, however volume is quite supportive.

WEDGE BO AND RETESTSHOULD WE ENTER IN MCX FOR SHORT TERM BASED ON CHART.
IF IT REACHES IT TARGET, IT WILL ALSO BE TRADING AT ALL TIME HIGH, WHICH WILL BE ANOTHER BREAKOUT
CMP - 1600
TARGET - 1900+++ (CAN HOLD FOR LONG TERM, TARGET SHOULD BE MUCH HIGHER)
SL- 1450-1460

MCX giving good opportunity to invest or positional trading.Fundamentally very strong Multi commodity exchange printed a flag and given a very big breakout with volume that is reliable.
MCX is almost debt free.
MCX has delivered good profit growth of 20.31% CAGR over last 5 years
MCX has been maintaining a healthy dividend payout of 65.72%
Flag breakout on weekly time frame
Rsi breakout on daily and weekly charts
Entry range 1550-1650
Targets - 1850 | 2150 | 2660
Targets are based on fibonacci retracement.
Disclaimer: Chart, data and levels for study purpose only. I am not a financial advisor. Use your intelligence before investing.

Swing trade Setup in MCX!Swing trade Setup in MCX! for mid term with 15% gains.
Volumes picking up.
Massive flag breakout on weekly time frame.
Successfully Rested the breakout levels.
Fundamentally strong.
Buying level - 1575-1605
Target - 1575-1605
Stop Loss - 1574
Targets are based on charts.
Disclaimer: Chart, data and levels for study purpose only. I am not a financial advisor. Use your intelligence before investing.

MCX- Breakout Retest Done today. Good to enter with 7% SLMCX- Breakout Retest Done today. Good to enter with 7% SL

Breakout-Retest-ContinuationA proper downtrend breakout-retest and then continuation today. Can be bought now for a target of 1775 and 1830. CMP-1695. No strict SL is required, but if anyone wants can keep it 1500 on a closing basis.
Please like and follow!
Happy Trading :)


Breakout & Retest.. Educational Purpose onlyBreakout with good Volumes and Perfect Retest. RSI above 50.
Keep on Watchlist
MCX Swing trade with a lot of confluences.As you can see in the chart - stock has given a breakout with increased volumes.
23.6% fib level from the previous swing is also near the retest level.
At the retest look for massive rejections of lower levels or double bottoms or inverse head and shoulders.
NSE:MCX

MCX is long term deal to Enter, but a good oneNSE:MCX correction ended and now it can be trapped in this range for entire month. Wait for the recent days high to break before entering. A good deal to carry for multi months though.

Strong Momentum in MCXThis is one of my favourite stock.
Finally it have gave breakout from a long consolidation phase in a falling wedge price action pattern.
This pattern have took 1 yr and gave breakout.
Momentum looks very strong as it also has a seen hugh volumes that haven't came for almost a yr now(last time on 14th sep).
Let's see how much time it takes to test it's all time high.
This post is for information purpose only.

MCX - Approaching Strong ResistanceMCX :
Approaching a very Strong Resistance zone
Closing above 1800 is crucial for a good upmove
Else may all

Long - MCX1. Retest the breakout levels taking support with huge volume.
2. Buy after break out of 1800+ with target of 2400 (SL-1400 on closing basis_
