MEDPLUS HEALTH - VCPMedPlus is transitioning from a revenue-focused model to a margin-driven strategy, leveraging private labels and backend efficiency. While short-term revenue may appear subdued, the long-term fundamentals are strengthening.
The company is well-positioned to benefit from India's growing organized p
Next report date
—
Report period
—
EPS estimate
—
Revenue estimate
—
14.90 INR
1.50 B INR
61.36 B INR
51.01 M
About MedPlus Health Services Ltd.
Sector
Industry
CEO
Madhukar Reddy Gangadi
Website
Headquarters
Hyderabad
Founded
2006
ISIN
INE804L01022
FIGI
BBG013YXGVK4
MedPlus Health Services Ltd. engages in the provision of operation of pharmacies. It operates through the following segments: Retail, Diagnostics, and Others. The Retail segment focuses on the sale of pharmaceuticals and general items. The Diagnostics segment involves the pathology and radiology services. The Others segment includes insurance broking business. Its pharmacies carry medicines, vitamins, medical devices, test kits, and fast-moving consumer goods. It also conducts pathological services and distributes medical and surgical supplies through RiteCure and its online pharmacy Medplus Mart. The company was founded by Madhukar Gangadi in 2006 and is headquartered in Hyderabad, India.
Related stocks

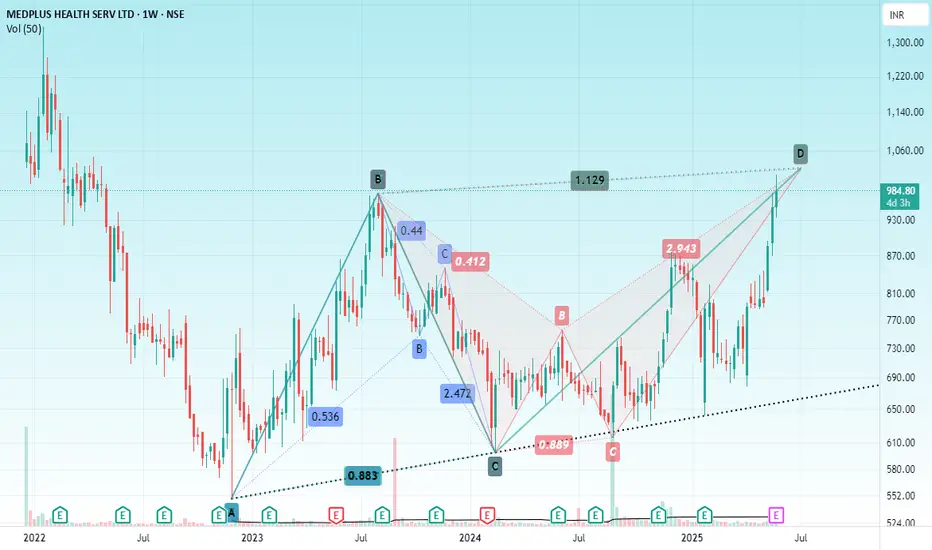
MEDPLUS HEALTHHello & welcome to this analysis
From a bullish Harmonic Bat pattern to a bearish Harmonic Alt Bat & bearish Harmonic ABCD in the weekly time frame.
Stock has entered in to potential reversal zone (PRZ) 1010-1050 of a bearish reversal probability.
Also note the 52w high and recent surge in price
Amazing breakout on WEEKLY Timeframe - MEDPLUSCheckout an amazing breakout happened in the stock in Weekly timeframe, macroscopically seen in Daily timeframe. Having a great favor that the stock might be bullish expecting a staggering returns of minimum 25% TGT. IMPORTANT BREAKOUT LEVELS ARE ALWAYS RESPECTED!
NOTE for learners: Place the break
MEDPLUS : ~49% return possible in near to mid termHi Friends,
Its best to select your stocks based on company bussiness (Check Q-o-Q & Y-o-Y sells, profit, debt level, NPA if bank/nbfc).
I believe in buy & hold good stocks (as per above parameters) having favorable technical pattern and sell once target is achieved.
So I keep my stoploss really de

Medplus-A beautiful W in the making!Medplus has been in a downtrend since couple of years.
Stock is showing strong reversal after a base formation.
Stock has potential to test ATH and also make new highs.
Keep in watchlist. Not a recommendation.

Eraaya Lifespaces Ltd.Stock: Eraaya Lifespaces Ltd.
CMP: ₹141.80 (-₹7.35 | -4.93%)
Key Highlights:
Financials: The company showcases strong financial health, indicating stable growth and profitability.
FII Activity: Foreign Institutional Investors (FIIs) have recently increased their stake, reflecting confidence in the

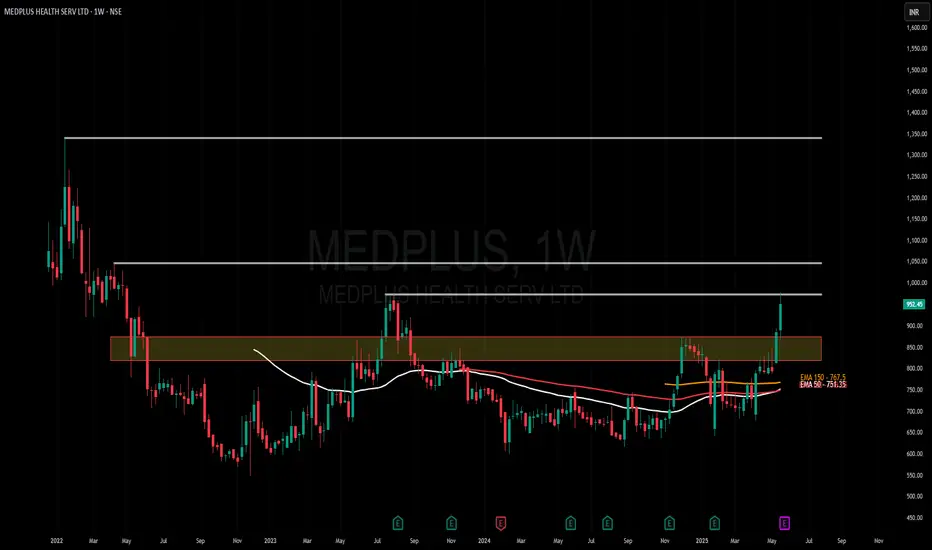
MEDPLUSMedplus has given trend-line breakout with increased market participation. Seems promising for midterm trading. Trend reversal is quite possible after almost a year's consolidation.

Swing Symmetrical Triangle Pattern:
The price has been consolidating within a symmetrical triangle, formed by converging trendlines.
The breakout above the triangle suggests a potential bullish trend continuation.
Resistance Level (₹745.35):
The horizontal line at ₹745.35 acts as a key resistance, which

MEDPLUS - 3 YEARS TRENDLINE BREAKOUT Can Enter at 760
if again falls then you need to average at 565 level
Target - 980,1230,1340
Disclaimer - All information on this page is for educational purposes only,
we are not SEBI Registered, Please consult a SEBI registered financial advisor for your financial matters before investing And

Mid term bet - Making higher high and rounding bottomMid term bet - Making higher high and rounding bottom, good to buy with appropriate stop loss - below recent low in weekly chart around 600, stop loss is 20% away.
Mid term target above 1100 almost 50% from current levels

See all ideas
Summarizing what the indicators are suggesting.
Neutral
SellBuy
Strong sellStrong buy
Strong sellSellNeutralBuyStrong buy
Neutral
SellBuy
Strong sellStrong buy
Strong sellSellNeutralBuyStrong buy
Neutral
SellBuy
Strong sellStrong buy
Strong sellSellNeutralBuyStrong buy
An aggregate view of professional's ratings.
Neutral
SellBuy
Strong sellStrong buy
Strong sellSellNeutralBuyStrong buy
Neutral
SellBuy
Strong sellStrong buy
Strong sellSellNeutralBuyStrong buy
Neutral
SellBuy
Strong sellStrong buy
Strong sellSellNeutralBuyStrong buy
Displays a symbol's price movements over previous years to identify recurring trends.
Frequently Asked Questions
The current price of MEDPLUS is 763.10 INR — it has increased by 1.77% in the past 24 hours. Watch MedPlus Health Services Ltd. stock price performance more closely on the chart.
Depending on the exchange, the stock ticker may vary. For instance, on NSE exchange MedPlus Health Services Ltd. stocks are traded under the ticker MEDPLUS.
MEDPLUS stock has risen by 1.35% compared to the previous week, the month change is a −8.34% fall, over the last year MedPlus Health Services Ltd. has showed a 18.72% increase.
We've gathered analysts' opinions on MedPlus Health Services Ltd. future price: according to them, MEDPLUS price has a max estimate of 1,224.00 INR and a min estimate of 997.00 INR. Watch MEDPLUS chart and read a more detailed MedPlus Health Services Ltd. stock forecast: see what analysts think of MedPlus Health Services Ltd. and suggest that you do with its stocks.
MEDPLUS reached its all-time high on Jan 20, 2022 with the price of 1,343.00 INR, and its all-time low was 548.25 INR and was reached on Dec 1, 2022. View more price dynamics on MEDPLUS chart.
See other stocks reaching their highest and lowest prices.
See other stocks reaching their highest and lowest prices.
MEDPLUS stock is 4.48% volatile and has beta coefficient of 0.96. Track MedPlus Health Services Ltd. stock price on the chart and check out the list of the most volatile stocks — is MedPlus Health Services Ltd. there?
Today MedPlus Health Services Ltd. has the market capitalization of 89.78 B, it has increased by 0.22% over the last week.
Yes, you can track MedPlus Health Services Ltd. financials in yearly and quarterly reports right on TradingView.
MedPlus Health Services Ltd. is going to release the next earnings report on Nov 6, 2025. Keep track of upcoming events with our Earnings Calendar.
MedPlus Health Services Ltd. revenue for the last quarter amounts to 15.43 B INR, despite the estimated figure of 15.45 B INR. In the next quarter, revenue is expected to reach 16.82 B INR.
MEDPLUS net income for the last quarter is 423.58 M INR, while the quarter before that showed 513.35 M INR of net income which accounts for −17.49% change. Track more MedPlus Health Services Ltd. financial stats to get the full picture.
No, MEDPLUS doesn't pay any dividends to its shareholders. But don't worry, we've prepared a list of high-dividend stocks for you.
As of Oct 8, 2025, the company has 25.01 K employees. See our rating of the largest employees — is MedPlus Health Services Ltd. on this list?
EBITDA measures a company's operating performance, its growth signifies an improvement in the efficiency of a company. MedPlus Health Services Ltd. EBITDA is 5.24 B INR, and current EBITDA margin is 7.98%. See more stats in MedPlus Health Services Ltd. financial statements.
Like other stocks, MEDPLUS shares are traded on stock exchanges, e.g. Nasdaq, Nyse, Euronext, and the easiest way to buy them is through an online stock broker. To do this, you need to open an account and follow a broker's procedures, then start trading. You can trade MedPlus Health Services Ltd. stock right from TradingView charts — choose your broker and connect to your account.
Investing in stocks requires a comprehensive research: you should carefully study all the available data, e.g. company's financials, related news, and its technical analysis. So MedPlus Health Services Ltd. technincal analysis shows the sell today, and its 1 week rating is sell. Since market conditions are prone to changes, it's worth looking a bit further into the future — according to the 1 month rating MedPlus Health Services Ltd. stock shows the sell signal. See more of MedPlus Health Services Ltd. technicals for a more comprehensive analysis.
If you're still not sure, try looking for inspiration in our curated watchlists.
If you're still not sure, try looking for inspiration in our curated watchlists.