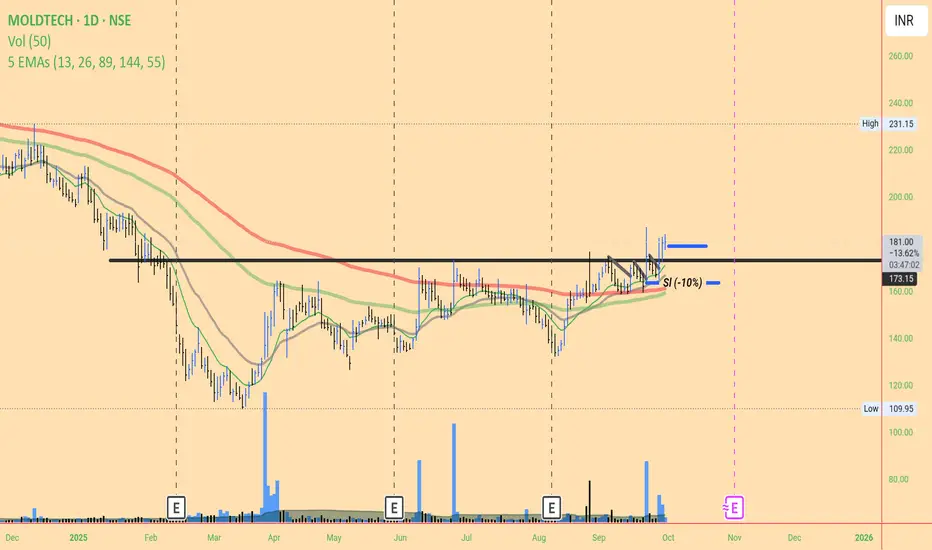
Mold-Tech #technicalanalysis
pattern look like vcp from left to right move price became narrow.
High volume after absorption ,
* Now price break 1st correction candle above trade. Entry point
* Sl -10% , from entry point 179 current price,
Reason below high volume after selling zone absorption area below that.
MOLDTECH trade ideas
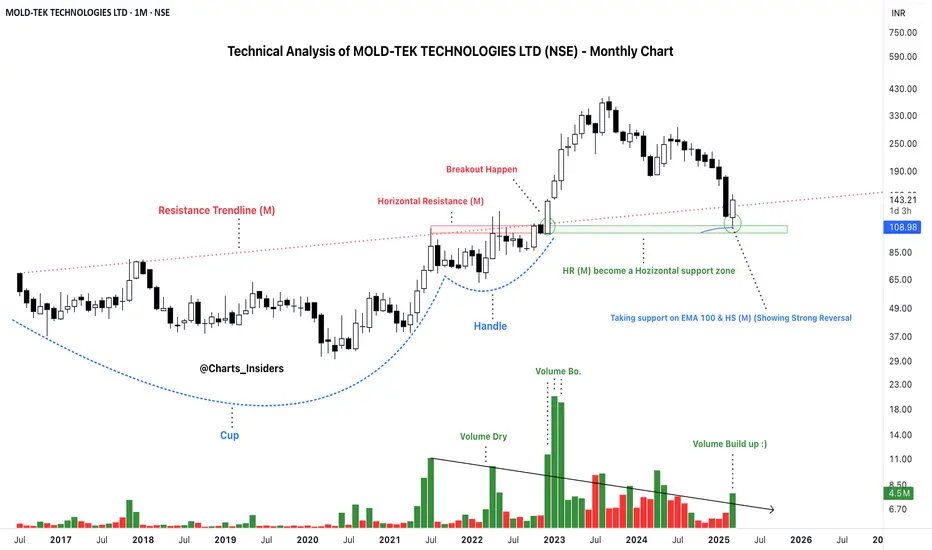
Technical Analysis of MOLD-TEK TECHNOLOGIES LTD (NSE) - Monthly Chart Pattern: Cup and Handle Breakout with Retest
The chart displays a cup and handle pattern that completed a breakout in early 2023.
The price surged significantly post-breakout, reaching new highs.
However, after the sharp uptrend, the stock has corrected and is now retesting the breakout zone, which aligns with a long-term trendline.
Key Technical Observations
1. Support and Demand Zone (Retest of Breakout)
The stock has fallen from its highs and is currently testing a critical support zone around ₹120 - ₹145. This zone represents the previous breakout level from the cup and handle pattern.
A strong bounce from this area suggests that buyers are defending this demand zone.
2. Long-Term Trendline Support
The red diagonal trendline, drawn from past swing highs, has historically acted as resistance.
After the breakout, this trendline is now acting as a support.
The stock has bounced off this trendline, indicating a potential reversal.
3. Volume Analysis
Increased volume was seen during the cup and handle breakout, confirming the strength of the move.
Recent volume spikes on the dip suggest accumulation by strong hands.
A rise in volume on a reversal would confirm buyer strength.
4. Fibonacci Retracement & Mean Reversion
The current correction aligns with a 50%-61.8% Fibonacci retracement from the previous rally.
This is a healthy retracement level, often indicating the end of a correction.
Mean reversion to previous support zones before resuming the uptrend is common in strong stocks.
5. RSI & Momentum Indicators
While RSI is not explicitly shown in the image, the deep correction suggests oversold conditions.
A bullish divergence (price making lower lows, but RSI making higher lows) would strengthen the reversal case.
Conclusion & Strategy
Bullish Case (If the stock holds ₹120 - ₹145)
If the stock sustains this level and forms a higher low, it could resume an uptrend.
Breakout confirmation would come if the price reclaims ₹180 - ₹200 with strong volume.
Potential targets: ₹250, ₹280, and ₹350 in the long run.
Bearish Case (If ₹120 breaks)
A breakdown below ₹120 could lead to further downside, possibly towards ₹90 or even ₹68.
This would invalidate the bullish retest scenario.
Action Plan
For Long-Term Investors: This could be a buying opportunity if support holds.
For Traders: Look for bullish confirmation before entering. Stop-loss near ₹120.
MOLDTECH | Simple trendline breakout and retestingMOLDTECH | Simple trendline breakout and retesting - Looks good for 40-50%
CMP : 268
SL : 240

Buy moldtek for s target of 300/400Moldtek has reversed from strong support,
One can expect a target of 300 in 1 month and 400 in 3 months

MOLDTE'CH: Short term bullish trend reversal ahead of earnings r📊 NSE:MOLDTECH Technical Analysis - February 2, 2024 🏭
Company Overview: 🔍
Mould Tech Technologies specializes in providing comprehensive engineering solutions, including structural engineering, mechanical engineering, and IT services. The company's expertise in delivering high-quality services positions it as a key player in the engineering sector.
Recent Market Performance: 📈
On the last trading day, February 2, 2024, Mould Tech experienced a significant price jump of approximately 2.8%, closing at 277.00. This move has brought the stock close to the 0.382 Fibonacci level, a critical point indicating potential upward momentum.
Technical Indicators: 🛠
Fibonacci Levels: The stock is nearing the 0.382 level, hinting at a bullish momentum.
Moving Averages: Crossed over the 50-day moving average from bottom to top, currently at 272.46, while the 200-day moving average stands at 300.96. This crossover suggests a potential short bull run.
Parabolic SAR: Issued a buy signal on February 2, 2024, indicating the start of a bullish phase.
MACD: Showcases a buying crossover, with MACD at -1.02 and the signal at -1.45, supporting the buying trend.
RSI: Trending upwards in the mid-range, indicating a positive buying wave with a K value of 68.52 and a D value of 58.37.
%R: Positioned in the mid-price band but trending upwards, suggesting growing strength.
Fisher Transform: At a value of 0.70 with a trigger at 0.18, indicating a trend but still in the middle of the band.
Market Outlook & Strategy: 🌟
With the broader market's support, Mould Tech is poised for an uptick, with a first target set at 287.00 (0.618 Fibonacci level) and a second target at 294.05 (0.00 Fibonacci level) . An aggressive stop-loss strategy is recommended at around 261.15, considering the stock's potential volatility ahead of its earnings report on February 9, 2024.
Entry & Exit Points: 🎯
Entry Point: Positive opening on February 5, 2024, may signal a buying opportunity, especially if EMA and MA crossovers occur.
Target 1: 287.00. 🎯
Target 2: 294.05. 🎯
Stop Loss: 261.15, to protect against unexpected downturns.
Considerations: ⚠️
Investors should monitor the stock's performance closely, especially with the upcoming earnings report. The stock's past volatility requires a cautious approach, despite the bullish indicators.
Disclaimer: ⚠️
This analysis is for informational purposes only and not financial advice. Market conditions are subject to change, and investors should conduct their own research or consult a financial advisor.
#MouldTech #TechnicalAnalysis #EngineeringSolutions #StockMarket #Investing #TradingView #BullishTrends #FibonacciLevels #EMA #MACD #RSI ✨

Mold-tech tecnology Analysis on 20 jan 24Mold-tech tecnology Analysis on 20 jan 24
Bit Risky stock
short term stoploss 240
stoploss 220 (below 20 EMA)
Target 310
350
398

Moldtek Tech: Trading near falling trendline breakoutMoldtek Tech is looking good on daily time frame. Stock is trading near falling trendline breakout zone. Keep on radar.

Mold Tek Technologies: Flag pattern on DTFMold Tek Technologies is looking good on daily time frame. Stock is trading near flag pattern breakout. Keep on radar.

Moldtek BottomBuy Mold-tek Between 250-255
Stop loss 234 (15Rs)
Target 1 : 290
Target 2 : 314
Target 3 : 330
Duration 1-2 Months

Mold Tech Technologies: Offering low risk opportunityMold Tech Technologies is offering low risk opportunity. Stock is reacting from demand zone and reversing keep on radar.

Mold Tech Technology: Offering low risk set upMold Tech Technology is consolidating near breakout retest level. Can be a good low risk opportunity. Keep on radar.

Mold Tech Technologies: Offering low risk opportunityMold Tech Technologies is looking good on weekly time frame. Seems stock is retesting breakout level. Keep on radar.

Long A strong break out after a cup and handle pattern. Can go up 50% to 550.
I am not sebi registered.

Mold Tek TechForming a cup and handle pattern, pattern will activate on closing above the breakout line
MOULDTECH : Nice Buy My Wave analysis suggest a nice buy with good RR.
Do not miss it.
Happy Trading.

MOLD-TEK Technologies On Reversel.MOLD-TEK Technologies On Reversal.
Can be seen on reversal on Daily Demand Zone.
RSI Divergence Seen.
Note
Only for Study purpose no BUY/SELL recomendation.

MOLDTECH's Chart: Daily Support Trendline, Oversold RSIIn this analysis, we will delve into the chart of MOLDTECH, focusing on the daily support trendline, the oversold RSI, and the formation of a White Swan Harmonic Pattern. By examining these technical aspects, we aim to provide insights into the stock's current situation and the potential for upward movement. Let's proceed with the analysis.
Chart Analysis:
Upon reviewing the provided TradingView chart for MOLDTECH, we can observe several key technical factors that may influence the stock's future price action. These include the presence of a daily support trendline, the oversold condition of the RSI, and the formation of a White Swan Harmonic Pattern.
Daily Support Trendline:
The chart indicates the presence of a daily support trendline, which implies that the stock's price has previously found buying interest and support at this level. The trendline serves as a potential area for the stock to bounce and reverse its downward momentum. A successful rebound from the trendline support could indicate renewed buying interest in the stock.
Oversold RSI:
Additionally, the RSI (Relative Strength Index) is currently in oversold territory. When the RSI reaches oversold levels (typically below 30), it suggests that the stock may be undervalued and due for a potential rebound. The oversold condition of the RSI adds weight to the potential buying opportunity presented by the daily support trendline.
White Swan Harmonic Pattern:
Furthermore, the chart indicates the formation of a White Swan Harmonic Pattern. This pattern is a variation of the traditional Swan Harmonic Pattern and suggests a potential bullish reversal in the stock's price. The completion of the pattern may indicate a shift from a bearish to a bullish market sentiment.
Buy Setup and Targets:
Based on the analysis, a potential buying opportunity arises at the current CMP (Current Market Price). Traders may consider initiating a long position with a stop loss set at 220, which helps limit potential losses if the anticipated rebound does not materialize.
In terms of target levels, given the short-term nature of the trade, a conservative target of 235 can be considered. Traders should closely monitor price action and adjust their profit-taking strategy based on their risk appetite and individual trading plan.
Conclusion:
Based on the technical analysis, MOLDTECH's chart indicates the presence of a daily support trendline, an oversold RSI, and the formation of a White Swan Harmonic Pattern. These factors suggest a potential buying opportunity and the potential for a short-term rebound in the stock's price.
Traders should carefully assess their risk tolerance and consider implementing appropriate risk management strategies, such as setting stop-loss levels. It is essential to closely monitor price action and any changes in the technical landscape to make informed trading decisions.
Disclaimer: The information provided in this analysis is for educational purposes only and should not be considered as financial advice. Trading stocks involves risks, and past performance is not indicative of future results. It is advisable to consult with a financial advisor or conduct further research before making any financial decisions.


Bullish Pennant- Forming a Bullish pennant
- Dried up volume during formation shows selling pressure is diminishing
- Wait for Breakout

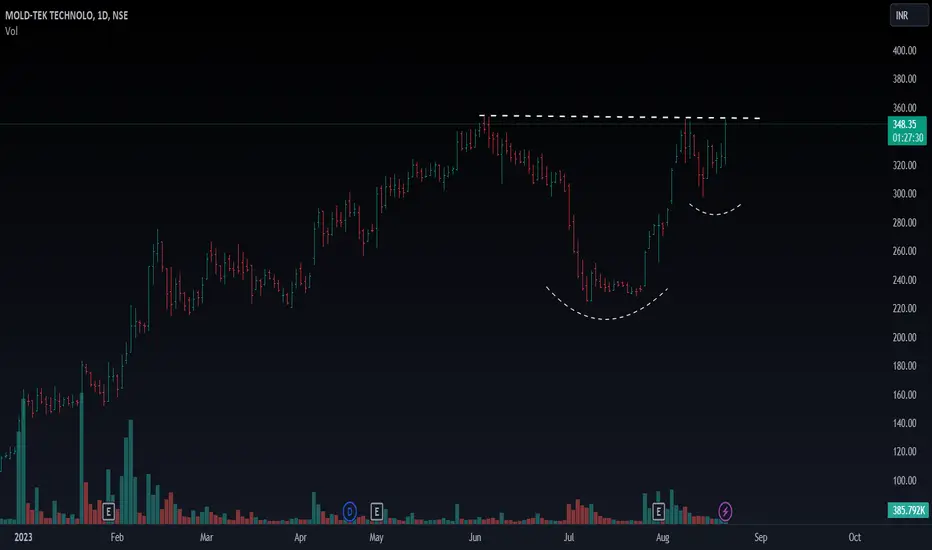
Cup & Handle#stocktowatch
- Cup & Handle formation
- Symmetrical Triangle
- Volatility contraction
- above all avg. in Daily tf
- Bullish RSI
Disc : - Let the Hourly Candle Give BO on Closing basis with good volume.

ModlTech #Pole and Pennant pattern breakout- Modltech has given a pole ad pennant pattern breakout.
- If sustain above the trend line, it may give another bull run.

This infrastructure service provider is set for a nice up move!NSE:MOLDTECH
Mold-Tek Technologies specializes in providing Civil and Mechanical Engineering Solutions.
Key ratios:
PE cheaper than industry
Dividend higher than industry
Key fundamentals:
Sales - In the past five years, sales growth has averaged 8.98%, in contrast to the sector average of 5.51%.
Margins - Over the last 5 years, net profit margin has been 11.13%, vs industry avg of 0.73%
Earnings - Over the last 5 years, net earnings have averaged 24.3%, vs. sector avg of -183.77%
Key technicals:
Volumes have been on increasing trend in past week
Stock is near all time high on monthly, weekly and daily charts
although there is some selling pressure seen at ATH levels, the price is making higher lows and higher closes
Other:
Company is almost debt free.
Company is expected to give good quarter
Company has been maintaining a healthy dividend payout of 45.9%
Sources: tijorifinance, screener, tickertape
Disclaimer: not a recommendation, only for educational purposes

Breakout in Mold-Tek Technologies Ltd...Chart is self explanatory. Levels of breakout, possible up-moves (where stock may find resistances) and support (close below which, setup will be invalidated) are clearly defined.
Disclaimer: This is for demonstration and educational purpose only. This is not buying or selling recommendations. I am not SEBI registered. Please consult your financial advisor before taking any trade.
