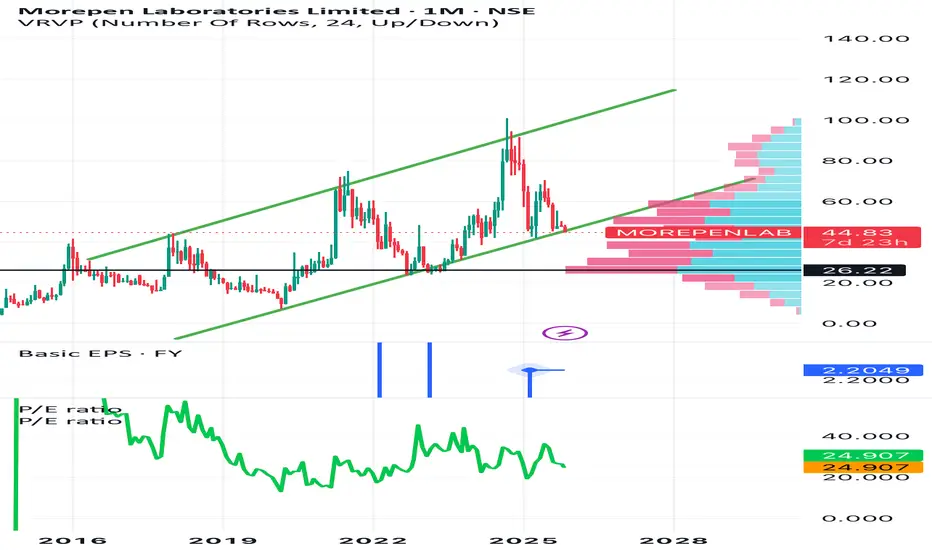
Morpen Reversal expected The chart shows that it should reverse from the support, expect it to reach around 80-120 as the pe is around 24 , so even 50 PE would make 90rs
Morepen Laboratories Limited
No trades
What traders are saying
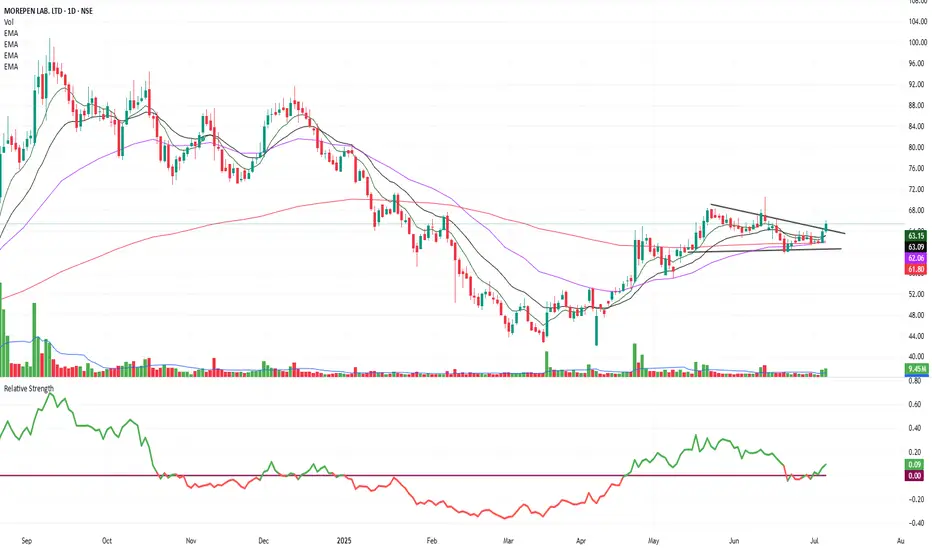
Morepen lab heading upwardsMorepen lab has broken out of a tight range.
The stock has risen above short- and long-term moving averages.
Then trend line break can be clearly seen
MACD line is about to cross above signal line. RSI is strong.
Relative strength has turned positive.
The stock is like to rise to 70-75 levels in the short term.
Fundamentals are strong and the company is looking to double it's sales force (Medical representatives). It has incorporated a company in Dubai for trading purposes. With little exposure to US markets, the company may not be impacted even if Trump creates some issues with tariffs.
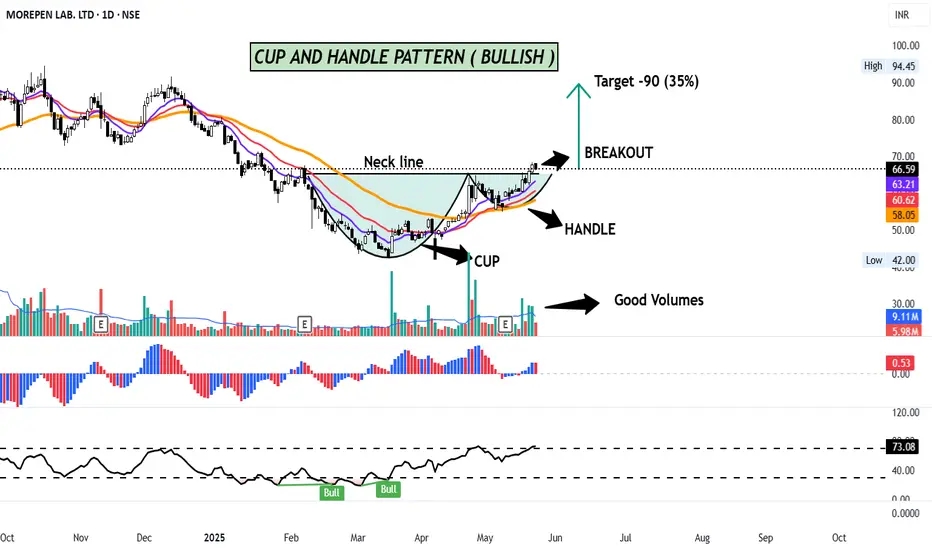
MOREPEN LAB - CUP AND HANDLE PATTERN (BULLISH )More pen Lab has formed CUP AND HANDLE pattern on the Daily charts and has given a breakout with good volumes.
A cup and handle price pattern resembles a cup with a handle, where the cup is in the shape of a "u" and the handle has a slight downward drift. A cup and handle is considered a bullish signal signalling an uptrend.
Morepen Labs is trading above its 11 & 22 day EMA. RSI is at 73 and MACD is well above zero line signalling positive momentum.
CMP- Rs. 66
Target Price- Rs.90 ( 35%)
SL - 62
Disclaimer: This is not a buy/sell recommendation. For educational purpose only. Kindly consult your financial advisor before entering a trade.
Morepen Lab Near Key Support – Big Move Ahead?Morepen Laboratories (NSE: MOREPENLAB) - A Critical Technical Setup
In-Depth Chart Analysis
1. Descending Trendline Resistance:
• The stock is moving within a descending triangle pattern, with a clear downward trendline acting as resistance since the peak around ₹120.
• Currently, the stock is approaching this trendline near ₹80. A breakout above this level, supported by strong volume, could trigger bullish momentum.
2. Key Moving Averages:
• 200-Day EMA (Exponential Moving Average): The 200-day EMA is positioned at ₹69.66, which serves as a critical long-term support. The stock has tested this level multiple times, indicating its importance.
• The price is hovering slightly above the EMA, suggesting the stock is at a decisive point for trend confirmation.
3. Support Levels:
• ₹69.66: Immediate support lies here, aligning with the 200-day EMA. If this level holds, the stock could see a bounce toward higher resistance levels.
• ₹65.00 and ₹55.00: If the stock fails to hold ₹69.66, it could slide to ₹65.00, a psychological support, and then to ₹55.00, which marks a previous consolidation zone.
4. Resistance Levels:
• ₹80.00: The descending trendline converges with this resistance. A breakout above ₹80.00 could open the path to ₹95.00.
• ₹95.00: A crucial horizontal resistance zone. Beyond this, ₹115.00 could be the next major target.
5. Volume Profile:
• Recent volume spikes near support levels suggest accumulation by long-term investors.
• Watch for increasing volume during any breakout above ₹80.00, which would confirm strong buying interest.
6. Bollinger Bands:
• The price is trading near the lower Bollinger Band, indicating oversold conditions.
• A rebound toward the middle or upper band could align with a breakout above the ₹80.00 resistance.
7. RSI (Relative Strength Index):
• The RSI is nearing the oversold zone, typically a precursor to a potential reversal.
8. Symmetrical Triangle Formation:
• The stock’s current price action within a triangle pattern indicates consolidation. A breakout above the upper trendline or a breakdown below the lower support will dictate the next directional move.
Possible Scenarios:
Bullish Scenario:
• A breakout above ₹80.00 with high volume can propel the stock to test ₹95.00 in the short term.
• Sustaining above ₹95.00 could lead to a rally toward ₹115.00, marking a significant reversal of the bearish trend.
Bearish Scenario:
• A breakdown below ₹69.66 would indicate the continuation of the descending triangle, leading to lower levels like ₹65.00 and ₹55.00.
• Increased selling pressure or market weakness could exacerbate the downside.
About Morepen Laboratories
Company Overview:
Morepen Laboratories is a pharmaceutical and healthcare company specializing in Active Pharmaceutical Ingredients (APIs), formulations, and diagnostics. With a strong domestic presence and growing exports, the company’s key products include Loratadine (an anti-allergic API) and well-known OTC brands like Burnol and Dr. Morepen.
Financial Highlights:
• Revenue: The company has demonstrated consistent revenue growth, driven by exports and rising healthcare demand in India.
• Margins: Operating margins are moderate, with scope for improvement as exports scale up.
• Debt Levels: A low debt-to-equity ratio reflects strong financial stability.
• Cash Flow: Positive operating cash flow highlights effective financial management.
Growth Drivers:
1. Increasing demand for APIs globally, especially in regulated markets.
2. Expansion into diagnostics and OTC segments, with a focus on high-margin products.
3. Government incentives under the “Make in India” initiative for the pharmaceutical sector.
4. Investment in R&D to create niche formulations and increase market penetration.
Conclusion:
The stock is at a pivotal technical and fundamental point. A decisive breakout above ₹80.00 could signal the start of a bullish trend, while a breakdown below ₹69.66 might lead to further downside.
Disclaimer:
This analysis is for educational purposes only and does not constitute financial advice. Please conduct your own research and consult a certified financial advisor before making investment decisions.

Analyzing morepen laboratories _12th DEC 24BULLISH BREAKOUT :
TECHNICAL OVERVIEW - The stock chart of Morepen Laboratories Ltd. on a daily timeframe, showing a breakout from a descending triangle pattern. This technical breakout, accompanied by higher trading volumes, suggests a bullish momentum in the stock price, as the resistance line has been breached decisively. The 50-day Simple Moving Average (SMA) below the price indicates a positive trend, further supporting the likelihood of upward movement. Traders may consider this breakout as a potential entry signal, provided the stock maintains its position above the breakout level and sustains volume. However, monitoring broader market conditions is advised for risk management.

More LabChart is self explanatory
Already broken out of trendline........
Entry trigger activated..........
Keep strict stoploss at exit and then trail as per movement........
Breakout into skyzone will ensure stock to rise immensely so targets are just incase market comes in hefty pressure
Just for information purpose. Invest as per your financial advisor

Morepenlab consolidation breakout above 95 tgt-120++morepen lab currently consolidating in a range
last six qoq profits are good
it took support around 70-75 once close above 95 can make a good move
Disclaimer- Just my view and opinion trade at your own risk not an investment advice
these are only for educational purposes

MLL--rounding bottom breakout
--retest completed
--huge volume seen
Disclaimer:
- The view expressed here is my personal view
- Any decision you take, you need to take responsibility for the same
- It's your hard earned money. Treat it wisely
- Trade / Invest keeping in mind your trading style, goals and objectives, time horizon & risk tolerance
-- Do your own analysis and consult your financial adviser if needed

MOREPENLAB - Breakout in DaytimeframeStock price consolidate since September 2024 and it breakout the wedge pattern today.

2 Swing trading ideas for 3 December Markets I daily make educational content videos for swing / positional trading

Stock is ready for a strong breakout- keep in radar✅ The stock is forming a symmetrical triangle pattern suggesting a period of consolidation before a potential breakout. A breakout above 85 with volume will likely lead to further bullish momentum.
✅ The rising trendline from previous lows around 73 provides a strong support zone indicating the stock’s resilience to downside pressure.
✅ Recent sessions have seen a noticeable increase in trading volume, signaling growing interest among market participants. This supports the bullish breakout potential.
✅ Currently at 60 RSI is heading upwards suggesting increasing bullish momentum. A move beyond 65 will strengthen the bullish case.
📈 A sustained breakout above 85 can propel the stock towards 92 initially, with a potential to test 100 in the short to medium term. Watch for volume confirmation to validate the breakout.

Morepen Lab reversing from a Support zone. After breaking out from a 3 year old resistance at 75, the stock retraced back to the breakout level and is taking support from there. Ideal entry was 75 but if you missed it then we will look for fresh entry possibility.
Please check the chart for Entry/SL.
✅Today's candle sustaining right above 50 DMA.
✅Chart Structure is improving.
❗️Stock structure turned to LH-LL now slight improvement in structure.
❗️Even though overall market is showing early signs
of reversal. We are trading below 50 DMA.
❗️25K might be a tough hurdle. So, need to be
cautious.
▶️Market Cap---₹ 4,710 Cr.
▶️Current Price---₹ 86.0
▶️Stock P/E---39.9
▶️ROCE---16.8 %
▶️ROE---12.0 %
Chart shared only for educational purposes only. Please do your analysis before investing.

Morepen Lab - Bullish Flag and Fibonacci RetracementMorepen Lab has formed a bullish flag pattern, and today it has successfully broken out.
The price has retested the Fibonacci level at 38, where it formed a bullish piercing pattern, signaling potential upside momentum.
Price take support of 50 period EMA.
Additionally, this level coincides with a significant demand zone on the chart, suggesting strong buying interest. Keep an eye on this stock for further upward movement


INVEST AS LIKE PROPERTY (LONG TERM)Inverted head and shoulder pattern has been formed and its breakout has also given, it is time to buy at this level, further target is 223 and after its breakout, it will be at further height but in a few years.

3 rd wave in action might double from hereMorepen Lab -
Looks like the 3rd wave is on and should see around 140 - 160. All details of my Elliot Wave projection is provided in the chart.
This is my own interpretation of the Elliot Wave for education purpose.
Disclaimer - I have this stock in my portfolio

MOREPENLAB - Multiyear Breakout -Cup and Handle - MonthlyMOREPENLAB - Cup and Handle pattern, which is a bullish continuation pattern indicating a potential upward trend. Here are some key points from the chart:
Cup and Handle Pattern: This pattern suggests that after a period of consolidation (the “cup”), there is a slight dip (the “handle”) before a potential breakout to higher prices.
Neckline: The neckline is marked at 74 will also act as stoploss.
Target Price: The potential target price is around 146, if the pattern completes successfully.
Volume: There is a significant increase in trading volume, highlighted by a large green bar. This often indicates strong buying interest and can support the bullish breakout.
Overall, the chart suggests a positive outlook if the price breaks above the neckline with strong volume support.
A multiyear breakout occurs when a stock or asset breaks out of a long-standing trading range, typically lasting several years. This breakout is significant because it often signals a major shift in market sentiment and can lead to substantial price movements. Here are some key points:
Long-Term Resistance: The asset breaks above a resistance level that has held for several years.
Volume: A multiyear breakout is often accompanied by a significant increase in trading volume, indicating strong investor interest.
Technical Indicators: Various technical indicators, such as moving averages, RSI, and MACD, can help confirm the breakout.
“21 yrs Multiyear breakout with good volume” suggests that the asset has broken out of a trading range that lasted for 21 years, supported by strong trading volume. This is a bullish signal indicating potential for further price appreciation.
Fundamental Factors: Sometimes, fundamental changes in the company’s business, industry, or broader economy can drive a multiyear breakout.

MOREPEN LAB SWING TRADE OPPORTUNITYAll points mentioned in the chart. Pharma sector also showing upside momentum. Happy learning with swing trade academy


Dr Morepen Labs Breakout with huge Volume and 70% Upside.26Aug2024: Morepenlab
Breakout done at weekly time frame after long ~1200 days of consolidation. BO with huge volume and RSI level done on 19Aug24.
Nice long term VCP pattern formed before BO.
Possible target in next 400days is 125 (~70% Upside Possible).
Please note its just for study purpose. Please do your due diligence to get such trades.
Thanks
Vijay

CUP AND HANDLE WITH GOOD VOLUME1M - Cup and Handle Pattern Strong breakout
Some months volume also increases.

Investment Idea for Long term InvestorTrade idea for Long term Investors
High Reward Trade for High Risk Investors
Success rate 80% - 90%
"Realize Full Potential of a Stock by having Patience"
"Stock Market is more about What can happen rather-than what will Happen"
In Markets there is no 100% Guarantee but one can invest in High Probability Stocks
ALWAYS KEEP IN MIND
Rule 1 : Respect Target & Stoploss.
Rule 2 : Hold the Trade until the Rule 1 is not met.
Rule 3 : SL on Day Close Basis
Rule 4 : Never do averaging if trade moves against your direction

Meropenlab - Breakout with high volumeMorepenlab:
Has given breakout on weekly/ monthly time frame with high volume
Entry 75-85 (Candle Close)
SL 50 (Candle Close)
Target 115-125
Disclaimer: Study only for Educational Purpose.
Remember: My Money, My Risk, My Reward, My Responsibility.
Please Consult your SEBI registered Financial Advisor for any Financial Advice/ Decision.
