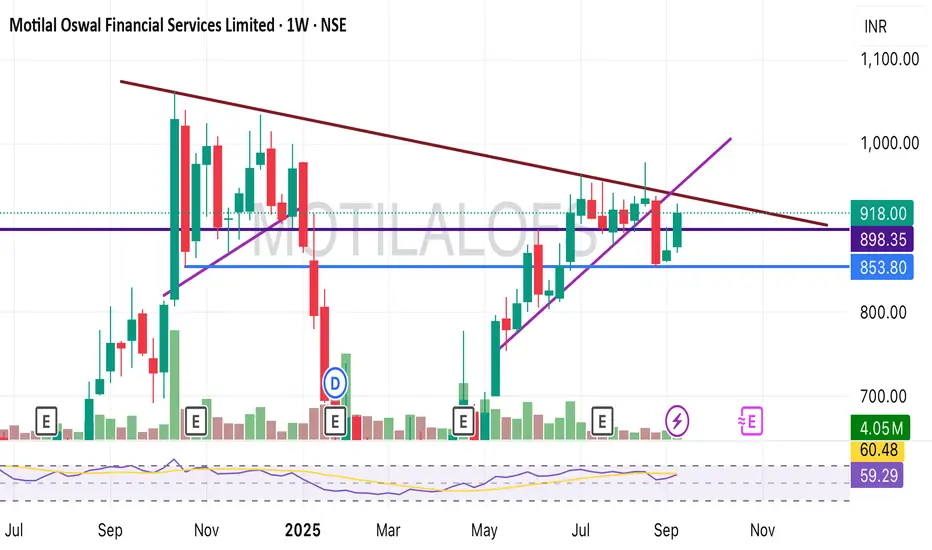
MOTILALOFS - LongIn this chart, price has formed a lower low near the support zone, but RSI has made a higher low. This is called positive divergence and it shows that selling pressure is weakening even though price dipped. It often appears near the end of a down move.
Near the same area, a Morning Star pattern is
Motilal Oswal Financial Services Limited
No trades
Next report date
—
Report period
—
EPS estimate
—
Revenue estimate
—
33.75 INR
25.02 B INR
76.93 B INR
137.55 M
About Motilal Oswal Financial Services Limited
Sector
Industry
CEO
Motilal Oswal
Website
Headquarters
Mumbai
Founded
2005
IPO date
Sep 17, 2007
Identifiers
2
ISIN INE338I01027
Motilal Oswal Financial Services Ltd. is a non-banking financial company, which engages in providing a range of financial products and services such as private wealth, retail broking and distribution, institutional broking, asset management, investment banking, private equity, commodity broking, currency broking, and home finance. It operates through the following segments: Capital Market, Asset and Wealth Management, Home Finance, and Treasury Investments. The Capital Market segment includes broking services to clients, research and advisory services, financial product distribution, depository services, investment banking, and margin trading funding. The Asset and Wealth Management segment offers fee-based services for management of assets. The Home Finance segment represents interest and other related income from affordable housing finance business. The Treasury Investments segment refers to investment and financing activities. The company was founded on May 18, 2005, and is headquartered in Mumbai, India.
Related stocks

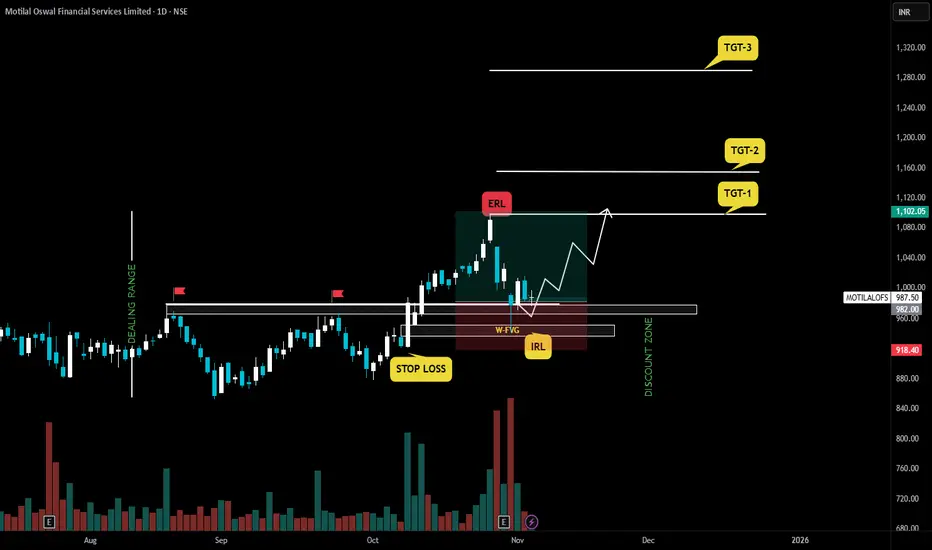
MOTILAL OSWAL FINANCIAL SERVICESBias: Bullish overall — structure is intact (higher highs, higher lows).
Where we are: Retracing into support (FVG/IRL area).
Plan: Wait for signs of reversal from this zone (bullish candle, volume pickup, or rejection wick).
Entry Zone: Around ₹960–₹980, ideally on confirmation.
Stop Loss: Belo
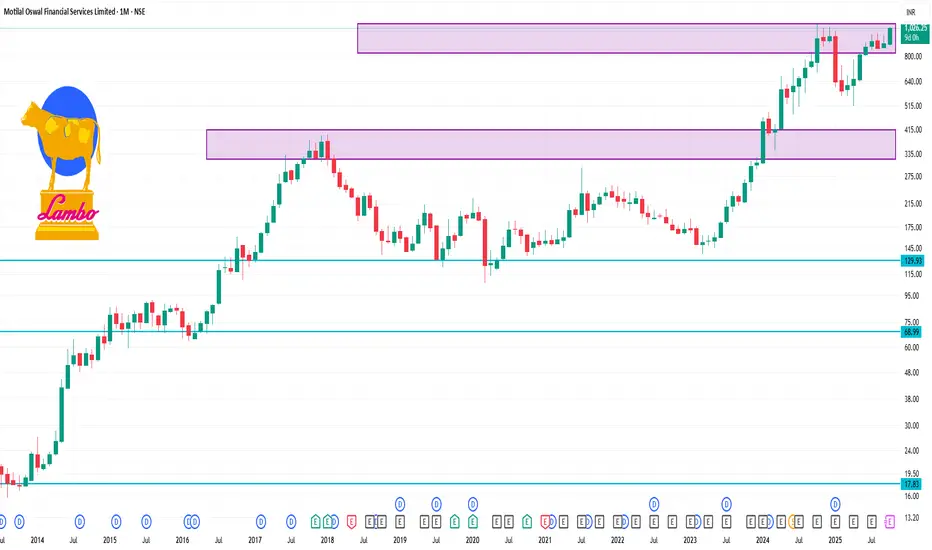
MOTILALOFS 1 Month Time Frame 📊 Monthly Pivot Levels
Based on monthly pivot calculations, the key levels are:
Resistance (R1): ₹1,013.47
Pivot Point (PP): ₹953.53
Support (S1): ₹906.57
These levels are derived from the price range of the previous trading month and can serve as potential indicators for future price movements
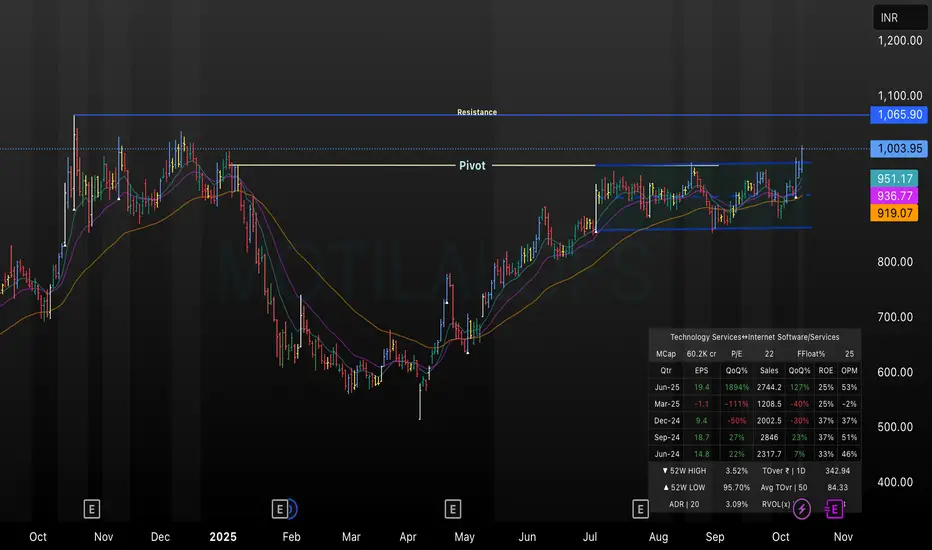
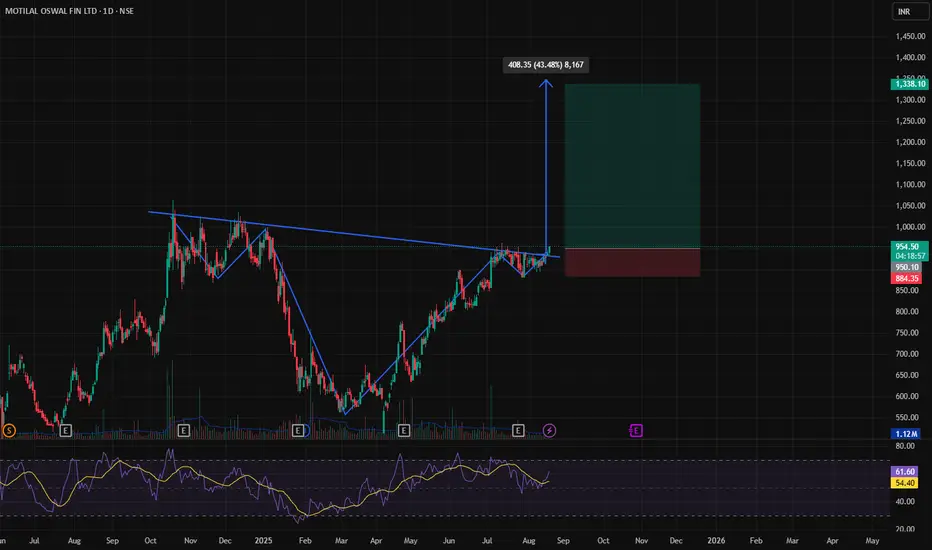
Motilal Oswal: Breakout Above Pivot with Resistance TestThis TradingView chart for Motilal Oswal shows a clear price breakout above the key pivot level near ₹1,003.95, heading towards the marked resistance at ₹1,065.90. The chart uses daily candles and overlays short-to-medium-term EMAs, highlighting recent bullish momentum. The setup suggests a potentia
MOTILALOFSMOTILALOFS
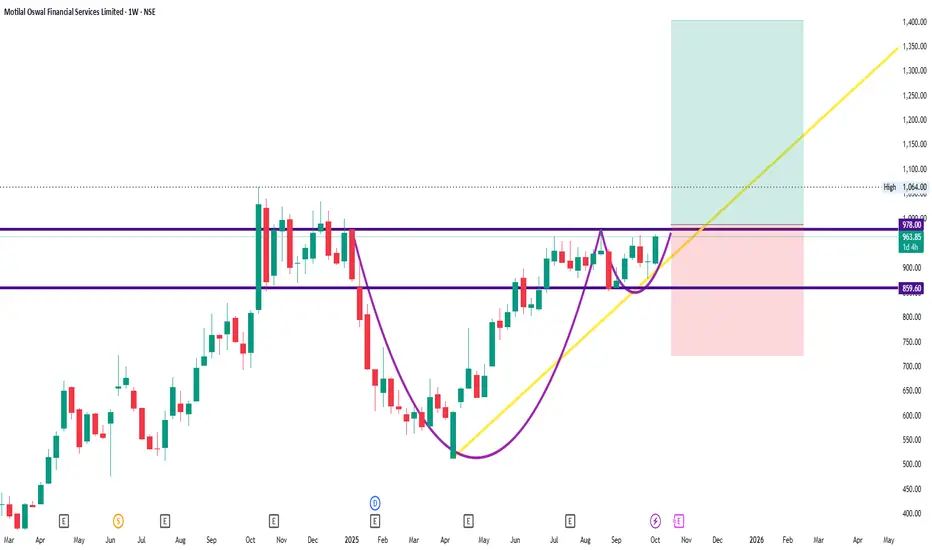
bullish trend is Showing on the chart.
buy signals in
technical indicators and
cup with handle chart pattern.
Watch for a breakout above 970/980 to sustain the bullish trend. If the resistance holds, there could be a retest towards 850/860 and an uptrend from here.
Motilal Oswal Financial Service Near the breakout Motilal Oswal Financial Service Near the breakout
Can give Trendline breakout since octo 2024
LONG on motilal financial servicesgoing with the financial data #motilalfinacials company is doing great there is minor drop in sales in march quarter but recovered in June quarter ..company has strong fundamental so going long on given level is good opportunity

MOTILALOFSMOTILALOFS, it is observed that inverted head and shoulder chart pattern created on this stock and this has very good potential to reward us with 30-40% in few weeks. plan your trade accordingly.
Motilal Oswal Financial Services LtdDate 13.08.2025
Motilal Oswal
Timeframe : Day Chart
MOFSL Group Services
(1) Capital markets
(2) Asset and Wealth Management
(3) Housing Finance
Revenue Split
(1) Capital Markets - 71% (54% rev earned from Brokerage)
(2) Asset & Wealth Management - 18%
(3) Housing Finance - 11%
Operational M

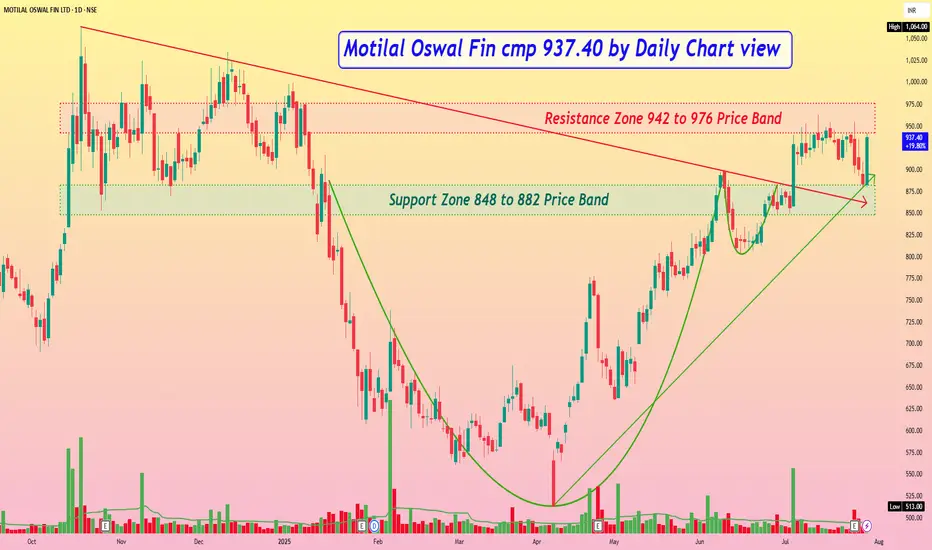
Motilal Oswal Fin cmp 937.40 by Daily Chart viewMotilal Oswal Fin cmp 937.40 by Daily Chart view
- Support Zone 848 to 882 Price Band
- Resistance Zone 942 to 976 Price Band
- Bullish Cup and Handle completed at Support Zone neckline
- Support Zone seen to be tested retested over the past 2 days
- Falling Resistance Trendline Breakout done a whi
See all ideas
Summarizing what the indicators are suggesting.
Neutral
SellBuy
Strong sellStrong buy
Strong sellSellNeutralBuyStrong buy
Neutral
SellBuy
Strong sellStrong buy
Strong sellSellNeutralBuyStrong buy
Neutral
SellBuy
Strong sellStrong buy
Strong sellSellNeutralBuyStrong buy
An aggregate view of professional's ratings.
Neutral
SellBuy
Strong sellStrong buy
Strong sellSellNeutralBuyStrong buy
Neutral
SellBuy
Strong sellStrong buy
Strong sellSellNeutralBuyStrong buy
Neutral
SellBuy
Strong sellStrong buy
Strong sellSellNeutralBuyStrong buy
Displays a symbol's price movements over previous years to identify recurring trends.
925MOFSL32
Motilal Oswal Financial Services Limited 9.25% 03-SEP-2032Yield to maturity
8.12%
Maturity date
Sep 3, 2032
897MOFSL29.N4
Motilal Oswal Financial Services Limited 8.97% 09-MAY-2029Yield to maturity
8.08%
Maturity date
May 9, 2029
97MOFSL34
Motilal Oswal Financial Services Limited 9.7% 09-MAY-2034Yield to maturity
7.55%
Maturity date
May 9, 2034
93MOFSL34
Motilal Oswal Financial Services Limited 9.3% 09-MAY-2034Yield to maturity
7.51%
Maturity date
May 9, 2034
935MOFSL29.N5
Motilal Oswal Financial Services Limited 9.35% 09-MAY-2029Yield to maturity
7.19%
Maturity date
May 9, 2029
91MOFSL27
Motilal Oswal Financial Services Limited 9.1% 09-MAY-2027Yield to maturity
3.94%
Maturity date
May 9, 2027
0MOFSL27.N3
Motilal Oswal Financial Services Limited 0.0% 09-MAY-2027Yield to maturity
−11.13%
Maturity date
May 9, 2027
885MOFSL26.N0
Motilal Oswal Financial Services Limited 8.85% 09-MAY-2026Yield to maturity
−15.43%
Maturity date
May 9, 2026
0MOFSL26.N1
Motilal Oswal Financial Services Limited 0.0% 09-MAY-2026Yield to maturity
−46.90%
Maturity date
May 9, 2026
M
855MOHFL28
Motilal Oswal Home Finance Ltd. 8.55% 24-MAR-2028Yield to maturity
—
Maturity date
Mar 24, 2028
See all MOTILALOFS bonds
MIDCAPETF
Mirae Asset Nifty Midcap 150 ETF Exchange Traded Fund UnitsWeight
0.31%
Market value
476.78 K
USD
Explore more ETFs
Frequently Asked Questions
The current price of MOTILALOFS is 785.95 INR — it has increased by 0.44% in the past 24 hours. Watch Motilal Oswal Financial Services Limited stock price performance more closely on the chart.
Depending on the exchange, the stock ticker may vary. For instance, on NSE exchange Motilal Oswal Financial Services Limited stocks are traded under the ticker MOTILALOFS.
MOTILALOFS stock has fallen by −0.38% compared to the previous week, the month change is a −8.55% fall, over the last year Motilal Oswal Financial Services Limited has showed a 21.61% increase.
We've gathered analysts' opinions on Motilal Oswal Financial Services Limited future price: according to them, MOTILALOFS price has a max estimate of 1,110.00 INR and a min estimate of 975.00 INR. Watch MOTILALOFS chart and read a more detailed Motilal Oswal Financial Services Limited stock forecast: see what analysts think of Motilal Oswal Financial Services Limited and suggest that you do with its stocks.
MOTILALOFS reached its all-time high on Oct 28, 2025 with the price of 1,097.10 INR, and its all-time low was 10.90 INR and was reached on Mar 5, 2009. View more price dynamics on MOTILALOFS chart.
See other stocks reaching their highest and lowest prices.
See other stocks reaching their highest and lowest prices.
MOTILALOFS stock is 4.51% volatile and has beta coefficient of 2.04. Track Motilal Oswal Financial Services Limited stock price on the chart and check out the list of the most volatile stocks — is Motilal Oswal Financial Services Limited there?
Today Motilal Oswal Financial Services Limited has the market capitalization of 471.41 B, it has increased by 0.99% over the last week.
Yes, you can track Motilal Oswal Financial Services Limited financials in yearly and quarterly reports right on TradingView.
Motilal Oswal Financial Services Limited is going to release the next earnings report on Apr 23, 2026. Keep track of upcoming events with our Earnings Calendar.
Motilal Oswal Financial Services Limited revenue for the last quarter amounts to 18.09 B INR, despite the estimated figure of 13.45 B INR. In the next quarter, revenue is expected to reach 13.22 B INR.
MOTILALOFS net income for the last quarter is 5.66 B INR, while the quarter before that showed 3.62 B INR of net income which accounts for 56.16% change. Track more Motilal Oswal Financial Services Limited financial stats to get the full picture.
Motilal Oswal Financial Services Limited dividend yield was 0.81% in 2024, and payout ratio reached 11.95%. The year before the numbers were 0.84% and 8.50% correspondingly. See high-dividend stocks and find more opportunities for your portfolio.
As of Feb 16, 2026, the company has 13.54 K employees. See our rating of the largest employees — is Motilal Oswal Financial Services Limited on this list?
EBITDA measures a company's operating performance, its growth signifies an improvement in the efficiency of a company. Motilal Oswal Financial Services Limited EBITDA is 28.04 B INR, and current EBITDA margin is 59.94%. See more stats in Motilal Oswal Financial Services Limited financial statements.
Like other stocks, MOTILALOFS shares are traded on stock exchanges, e.g. Nasdaq, Nyse, Euronext, and the easiest way to buy them is through an online stock broker. To do this, you need to open an account and follow a broker's procedures, then start trading. You can trade Motilal Oswal Financial Services Limited stock right from TradingView charts — choose your broker and connect to your account.
Investing in stocks requires a comprehensive research: you should carefully study all the available data, e.g. company's financials, related news, and its technical analysis. So Motilal Oswal Financial Services Limited technincal analysis shows the sell today, and its 1 week rating is sell. Since market conditions are prone to changes, it's worth looking a bit further into the future — according to the 1 month rating Motilal Oswal Financial Services Limited stock shows the neutral signal. See more of Motilal Oswal Financial Services Limited technicals for a more comprehensive analysis.
If you're still not sure, try looking for inspiration in our curated watchlists.
If you're still not sure, try looking for inspiration in our curated watchlists.