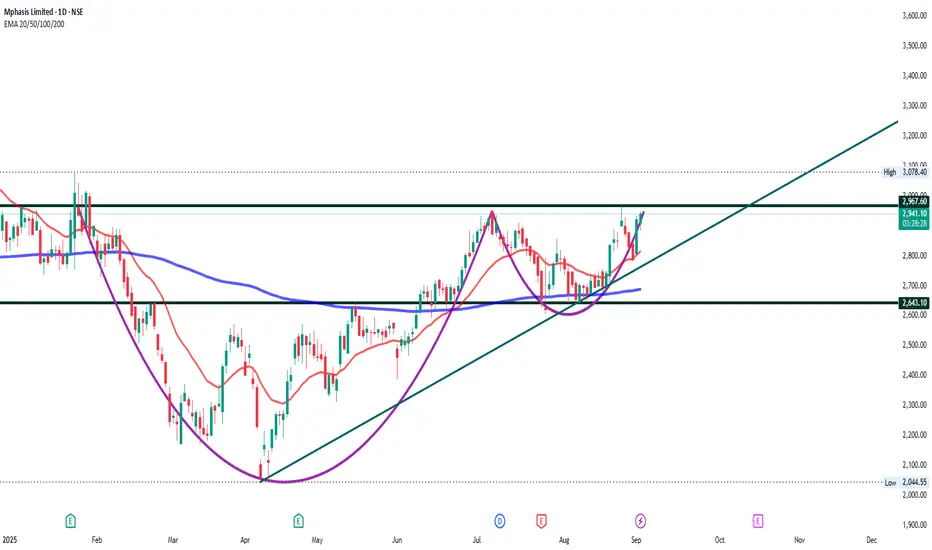
MPHASIS#MPHASIS
bullish trend is Showing on the chart.
buy signals in
technical indicators and
cup with handle , head and shoulders chart pattern.
Watch for a breakout above 2950/2970 to sustain the bullish trend. If the resistance holds, there could be a retest towards 2650/2700 and an uptrend from here
Trade ideas
Mphasis cmp 2917.70 by Daily Chart viewMphasis cmp 2917.70 by Daily Chart view
- Support Zone 2785 to 2845 Price Band
- Resistance Zone 2980 to 3045 Price Band
- Falling Resistance Trendline Breakout attempted
- Rising Support Trendline well respected by up-trending price
- Bullish Cup & Handle pattern done near the Resistance Zone neckline

Can MPHASIS beat other IT companies!?Mphasis appears to have hit long-term resistance around ₹3,200–₹3,400 on the monthly timeframe. After a recent breakout attempt, price dropped back below the downward trendline but has since rebounded sharply—indicating indecision and volatile price action.
📊 Key Technical Points:
Major Resistance: ₹3,200–₹3,400
Support Levels:
Near-term: ₹2,700–₹2,600
Stronger base: ₹2,400–₹2,250
Monthly close below ₹2,700 may signal weakness and a deeper correction
Sustained breakout and close above ₹3,200 could reignite bulls toward previous highs
💸 Dividend Watch
Mphasis has been consistent with dividend payouts in recent years. With the financial year ending soon, investors are alert for the next dividend declared by the board. This, combined with technical triggers, may attract positional buyers.
⚙️ Trade Setup (Swing / Positional View):
Entry Idea 1: Buy on breakout—monthly close above ₹3,200–₹3,300 zone
Entry Idea 2: Wait for a retest near ₹2,700–₹2,600 support as safer entry
Stop Loss: Below ₹2,600 on pullback or below ₹2,400 if breakdown occurs
Targets: ₹3,400 → ₹3,600 → ₹3,800 (depending on momentum and volume)
Watchlist: Dividend declaration, volume trends, and post‑earnings price action
⚠️ This is not financial advice—always trade with defined risk and conduct your own research.

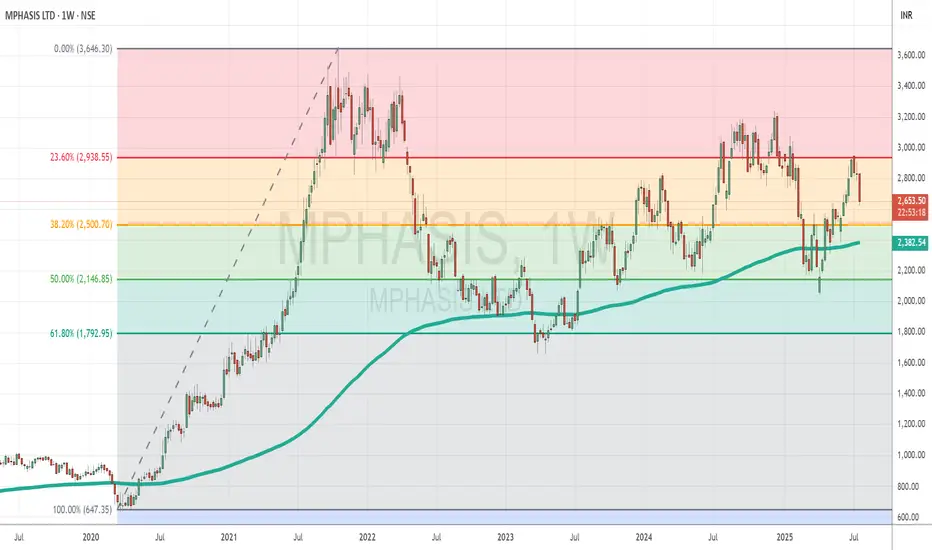
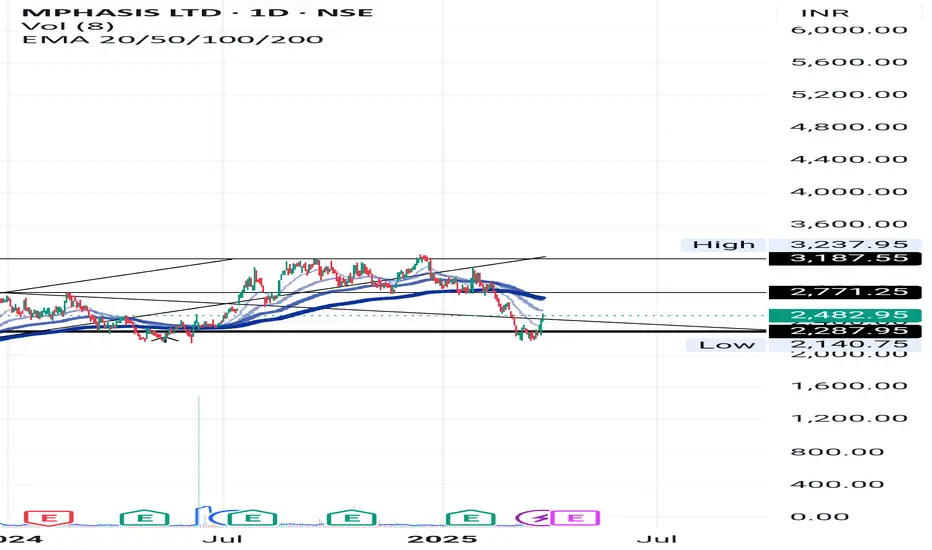
Mphasis Holds Strong Amid Weak IT Sentiment, Trading Between KeyTopic Statement:
Mphasis has shown resilience despite the broader weakness in the Indian IT sector, oscillating between strong support and resistance levels.
Key Points:
* The stock faces stiff resistance near 3000, with the 23.6% Fibonacci retracement level at 2938
* It receives strong buying support around 2000, with the 50% retracement level at 2146 acting as a critical floor
* The price rarely dips below the 200-day EMA, and such instances have historically presented attractive investment opportunities
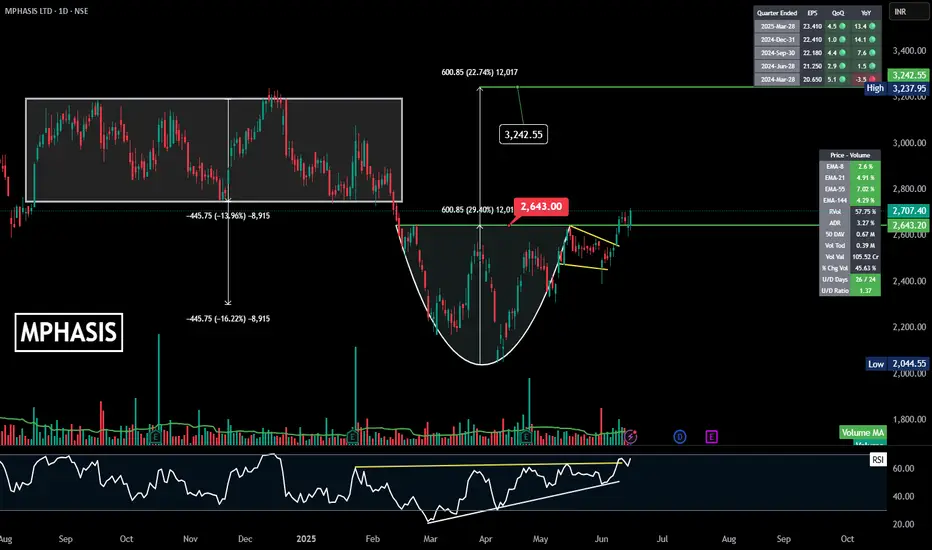
MPHASIS | Cup and Handle | Breakout | DailyExcellent chart!
The **MPHASIS LTD** chart presents a **bullish Cup and Handle breakout** along with a minor **flag & pole** inside the handle — a powerful confluence of patterns.
---
## ☕ **MPHASIS – Cup and Handle Breakout**
### 📍 **Pattern**: Cup & Handle + Mini Flag & Pole inside Handle
* **Cup Depth**: ₹600.85
* **Breakout Point**: ₹2643.00
* **Target Projection**:
₹2643 + ₹600.85 = **₹3243.85** 🎯
---
### 📈 **Chart Highlights**
* ✅ **Breakout above neckline** (\~₹2643) with good **volume spike**
* ✅ Formed a **flag** inside the handle — already broken
* ✅ RSI above 60 and following rising trendline — **strong momentum**
* ✅ All EMAs bullishly aligned (short, mid, long term)
---
### 📊 **Key Technicals**
* **Support Zones**: ₹2643 (breakout retest), ₹2500 (flag base)
* **Resistance/Target Zone**: ₹3242.55
* **Stoploss**: Below ₹2600 or ₹2500 (swing basis)
---
### 🔍 **Bias**: **Strong Bullish Continuation**
Perfect confluence of patterns:
1. Cup & Handle
2. Handle formed a flag
3. Volume surge confirms breakout
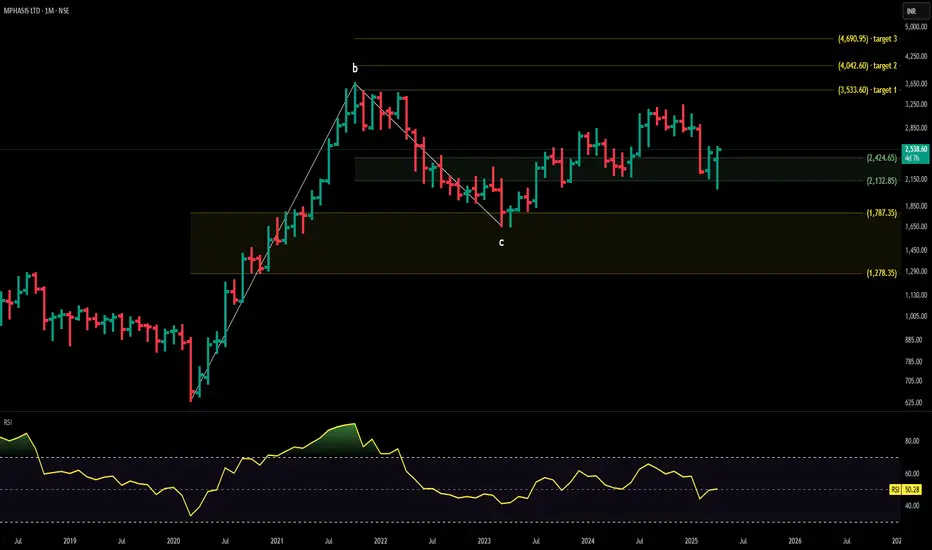
MPHASIS technical analysisStock Overview: Mphasis Limited, traded on the NSE, is currently priced at ₹2,538.60. The company specializes in IT services, offering application development, infrastructure outsourcing, and business process outsourcing to industries like banking, financial services, and insurance.
Key Levels:
Support: ₹1,787.35, ₹1,278.35
Upside Swing Zone: ₹2,424.65, ₹2,132.85
Possible Upside Levels: ₹3,533.60, ₹4,042.60, ₹4,690.95
Technical Indicators:
RSI (Relative Strength Index): The RSI stands at 50.28, indicating a neutral position. This suggests balanced buying and selling pressure without extreme market sentiment.
Volume: The trading volume is 14.03M, reflecting varying levels of activity. Higher volume periods may correlate with significant price movements.
Sector and Market Context: Mphasis operates within the IT services sector, which has demonstrated resilience and growth potential due to increasing demand for digital transformation and cloud services. The sector's overall market trend remains positive, driven by technological advancements and businesses adapting to digital solutions. However, the sector is sensitive to global economic conditions, regulatory changes, and technological disruptions.
Risk Considerations:
Company-Specific Risks: Mphasis faces challenges like competition, client concentration, and the need to keep pace with technological changes.
Sector Risks: The IT services sector is highly competitive and requires continuous innovation to maintain relevance.
Analysis Summary: Mphasis Limited's stock possible upside levels indicate price points the stock could reach under favorable conditions. Investors should consider sector performance, market trends, and company-specific risks before making decisions. Staying informed about developments affecting the stock is crucial for navigating its movement effectively.
MphasisHello & welcome to this analysis
Stock could be forming a cup & handle pattern in the monthly time frame with the lower leg of the handle coming to an end.
2000 is an extremely important level for the stock in the short term, while it has loads of resistance between 2300-2800 on the upside as it attempts to complete the handle.
Overall weakness continues below 2000, else one could expect stock to rise steadily towards completion of the bullish pattern

MPHASIS with W patternSeems like, MPHASIS Trying to create small W pattern. Again it just went about its resistance. Possibility of 10% profit can be observed. Past 4 earnings are in green and there is upcoming earning too.
MPHASIS - TRADE OPPORTUNITY ON LONG SIDESymbol - MPHASIS
CMP - 2251
Mphasis, a global provider of Information Technology solutions specializing in cloud and cognitive services, leverages next-generation technology to assist enterprises in transforming their businesses worldwide.
Recently, Mphasis has experienced a decline due to selling pressures in Nasdaq and U.S. IT stocks, as well as negative data and news flow related to the IT sector. Currently, Mphasis is approaching a crucial support zone in the range of 2250–2180 which has held since July 2023
I anticipate a significant rebound from this level, which is why I am entering long positions in Mphasis Futures at the current market price of 2251. Should the price reach the 2200 range, I will consider adding additional positions. To manage risk, my stop-loss is set at 2170, providing protection in case the support zone fails to hold and the price moves lower. On the upside, I am targeting price levels of 2400 and 2500
Disclaimer: The information provided here should not be construed as a buy or sell recommendation. It reflects my personal analysis and my trading position. Please consider this trading idea for educational purposes only. Thank you!

MPHASIS Short Trade Setup Positional!Multiple Trendline Breakdown With Downtrending Channel. Mphasis Sell Positional - 2820, With Stop - 2920, For Target - 2580.

Mphasis Double Bottom Looking good for a Swing/Postional Trade NSE:MPHASIS this week showed excellent price action on the back of decent Q3 Results and Management Commentary of Revenue during the quarter was driven by strong growth in the Banking and the Technology, Media & Telecom segments coupled with healthy revenue ramp-up in new clients despite the current quarter being a seasonally soft quarter. Consolidated revenue was up by 0.7% QoQ while net profit was up by 1.1% during the same period. The management stated that sustainable EBIT margin would be in the range of 14.6%-16%.
F&O Activity:
Significant Long Build-up with 2900 PUT Showing Significant OI addition.
Trade Setup:
It can be a Good 1:1 RISK-REWARD Trade with the recent double-bottom base being crucial. After making a double bottom the stock started a pullback with decent volumes. RSI also gaining momentum, indicating a continuation of the recent up move. When should I enter? ideally 50% near 3000 and the remaining 50% near 2950.
Target(Take Profit):
3260/3565 Levels for Swing/Positional Trader.
Stop-Loss:
Entry Candle Low For Swing Trader and Recent Base of 2758/2730 for Positional Trader.
📌Thank you for exploring my idea! I hope you found it valuable.
🙏FLLOW for more
👍BOOST if useful
✍️COMMENT Below your views.
Meanwhile, check out my other stock ideas below until this trade is activated. I would love your feedback.
Disclaimer: This analysis is intended solely for informational and educational purposes and should not be interpreted as financial advice. It is advisable to consult a qualified financial advisor or conduct thorough research before making investment decisions.

Mphasis Pharma SL 1Hr candle close only, Target Trigger Price
All detail for chat. good entry at mark price only. and must stoploss minimum risk and good profit. risk ratio 1:1 to manage modified SL. This is not call, Just my idea. Please understand your risk and take full responsibility of your actions

MPHASIS Time frame -15 miniute
#MPHASIS
Time frame -15 miniutes (Positional / intraday)
MPHASIS: - Cmp-3195
Analysis Description:
1. Stock trade above daily resistance.
2.Stock trade above 1 hrs trendline.
3.stock trade above 15 minutes
4. 15-minute candle close above 15 minutes

MPHASISHere is the analysis of the chart I have done.
Please view this chart as a reference and consult your financial advisor before making any investment decisions.

MPHASIS Trading Above Fresh Demand ZonMPHASIS is currently trading at ₹2758.15, slightly above its demand zone between ₹2737.9 and ₹2690.8, identified on 16th August 2024. This fresh zone remains untested, indicating potential buying interest if the stock revisits this range. Investors might consider monitoring for a pullback towards this zone, which could offer a buying opportunity around this support level.
Disclaimer: This analysis is for informational purposes only and should not be considered as financial advice. Please conduct your own research or consult a financial advisor before making any investment or trading decisions.

Mphasis still look good in heavy bearish market (Long term)“Hello everyone, Mphasis stock look good Despite the heavy market fall, it is performing well.
After a cup n handle break has occurred.
The volume is also great in this stock, and the relative strength is above 60.
It seems like the stock can maintain long-term momentum.”
Above all, given information is only for educational purpose, Before trade do your own analysis.

MPHASIS GETTING READY FOR ANOTHER RALLY✅The stock is on the verge of breaking out of a long-term descending channel that has capped price movement since mid-2021. A close above 3000 would confirm the breakout and could lead to a sharp rally toward the previous highs around 3500. The stock has been consistently trading above key moving averages—50 EMA, 100 EMA, and 200 EMA—indicating that the long-term uptrend remains intact. These EMAs will act as strong dynamic support levels ensuring that any pullback is likely to find buyers at lower levels.
✅ While the breakout is still developing we’ve already seen a rise in volume, which indicates that the market is gearing up for a strong upward move. A volume spike at the breakout point would confirm the validity of the breakout further boosting bullish sentiment. The RSI stands at 55 reflecting a balanced momentum with room to rise before becoming overbought. The stock has seen consistent demand at these levels and if the RSI continues to rise with price action it will confirm bullish strength.

VIEW ON MPHASISLong lower shadow candle formed in today's session
Low risk trade
Target 3160
Stop loss 3035
I am just representing my views
For educational purpose only.

Mphasis - Multiple BreakoutsCMP 2910 on 19.08.24
It can be seen on the charts that the stock has been forming a triangular pattern and Cup & handle pattern in the last 2-3 years. Already shown the breakouts of both the pattern around July 24. Already retested the breakout in recent sessions and showed a strong bounce back in the last session ( closed 192 points above).
If the momentum continues, the next target area may be around 3230, 3640, and even more.
Plz analyze the chart carefully and make a strategy that suits you. Make an exit according to your risk management. However, if it trades below 2650 levels it will show weakness on the charts.
The above illustration is only my own view, only for learning and sharing purposes, not a buy or sell advice in any way.
All the best.

Amazing breakout on Weekly / Daily Timeframe - MPHASISCheckout an amazing breakout happened in the stock in Weekly timeframe, macroscopically seen in Daily timeframe. Having a great favour that the stock might be bullish expecting a staggering returns of minimum 25% TGT. IMPORTANT BREAKOUT LEVELS ARE ALWAYS RESPEECTED!
NOTE for learners: Place the breakout levels as per the chart shared and track it yourself to get amazed!!
#No complicated chart patterns
#No big big indicators
#No Excel sheet or number magics
TRADE IDEA: WAIT FOR THE STOCK TO BREAKOUT IN LOWER TIMEFRAME AND RETRACE IF NEEDED. SL IS NEARER SUPPORT ZONE IN Daily TIMEFRAME.
PS: No new Nifty500 script can escape from me when making a breakout. :-)

Education purpose only - Mphasis- Stock is in a strong trend but a cooling off period or retracement will make it stronger
- EMA 20 is a strong reversal points
- lets see if it gives a sign of reversal..
- MACD is in buying zone, it should be reversed
- RSI & ADX are giving sign of cooling off and retracement possible
- Target – 2750, SL 3250

MPHASIS // LEVEL // 3H"Welcome to SkyTradingZone "
Hello Everyone 👋
Let's dive into the 3-hour candlestick chart for Mphasis (MPHASIS), a global IT consulting company.
Here are some key insights based on the 3-hour chart:
Current Trend: Mphasis has been trading in a sideways trend over the past few hours, with a slight upward bias.
Resistance and Support: The stock has a strong resistance level at around ₹4,300-4,400 and support level at around ₹4,150-4,200.
Bollinger Bands: The Bollinger Bands are contracting, indicating reduced volatility in the stock.
Momentum: The RSI (Relative Strength Index) is around 50, indicating a neutral momentum.
Candle Patterns: The 3-hour chart shows a small bullish Engulfing pattern at around ₹4,250-4,270, which is a bullish signal.

