mphasis longmphasis forming flag and ascending triangle.
can buy above range given above triangle for atleast 5% move
Trade ideas

Strong Bullish Swing on MPHASISEntry - 3366
SL - 3336
SL in Rs - 30
Max loss - Rs 500
Qty 500/30 = 16
Capital Rs 53376
Targets -:
1) 1:3, book 50%
8x3x30 = Rs 720
2)1:10, book 25%
4x10x30 = Rs 1200
3) 1:15, book 25%
4x15x30 = Rs 1800
Total Rs 3720 , 7%
After 1st target trail Sl cost to cost
and keep trailing at 1:3 ratio.

Mphasis strong bullish signalOn day charts, Mphasis trading above 100,20 & 13 DEMA,
After earning volumes sustained and in bullish trend, A 10-15 days swing trade can be executed, To be buy above 3370 , Stop loss to be kept at 3250 & target may be 3600+

Mphasis Swing Trade Setup Buying Range 3200, 3250
Stop ~ 3050
Target ~ 3800, 4000
Time Frame ~ 15 - 20 Day's


[POSITIONAL] MPHASIS SHORTcBET risk: Reward ratio is 1: 2
Rest as per Charts
********
Note -
One of the best forms of Price Action is to not try to predict at all. Instead of that, ACT on the price. So, this chart tells “where” to act in “what direction. Unless it triggers, like, let’s say the candle doesn’t break the level which says “Buy/Sell if it breaks”, You should not buy/sell at all.
=======
I use shorthands for my trades.
“Positional” - means You can carry these positions and I do not see sharp volatility ahead.
“Intraday” -means You must close this position at any cost by the end of the day.
=======
Always follow a stop loss.
In the case of Intraday trades, it is mostly the “Low/High of the Candle”.
In the case of Positional trades, it is mostly the previous swings
********


All set for Rounding Bottom BO?All set for Rounding Bottom BO? One confirmation candle and we'd see stock zoom pass 3500+ soon.

MPHASIS swing trading analysis and setup🎇Hello Traders👋
Today i have made a post on MPHASIS 4hr
I hope you find this post helpful and informative👍
The targets and stoploss would be given in the charts or they would be according to pivot points
Thank You
—DISCLAIMER—
I am not a SEBI registered financial advisor
Please consider your consultant's advise a must , all the setups posted here will be considered as informative and helpful post
I shall not be responsible for your profits and losses

Bullish MomentumRaising wedge breakout in daily leads bullish..
concentrate if price sustain above 3206 in 4 hrs

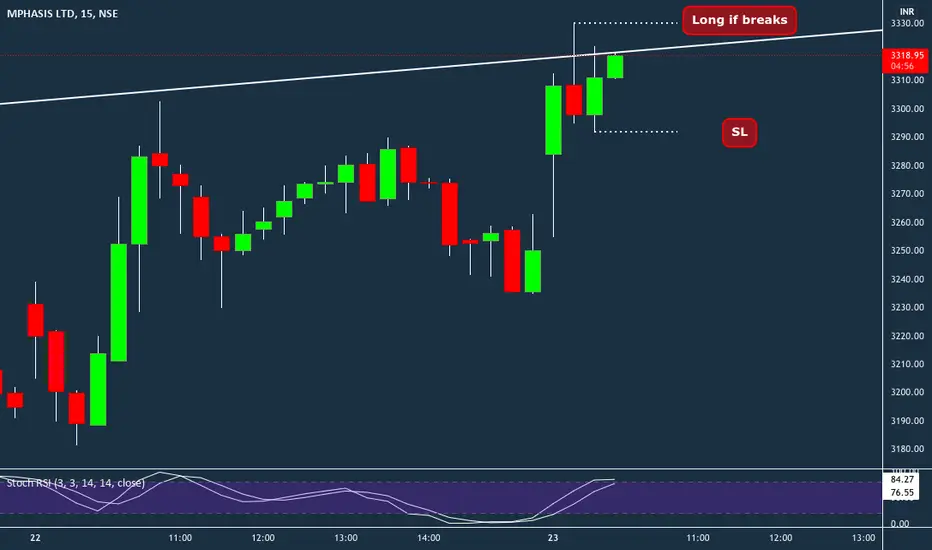
[ INTRADAY ] MPHASIS LONG BET
risk: Reward ratio is 1: 2
Rest as per Charts
********
Note -
One of the best forms of Price Action is to not try to predict at all. Instead of that, ACT on the price. So, this chart tells “where” to act in “what direction. Unless it triggers, like, let’s say the candle doesn’t break the level which says “Buy/Sell if it breaks”, You should not buy/sell at all.
=======
I use shorthands for my trades.
“Positional” - means You can carry these positions and I do not see sharp volatility ahead.
“Intraday” -means You must close this position at any cost by the end of the day.
=======
Always follow a stop loss.
In the case of Intraday trades, it is mostly the “Low/High of the Candle”.
In the case of Positional trades, it is mostly the previous swings
********
STOCK FOR THE WEEK MPHASIS LTD.Good evening friends, Stock is ready to see new highs if it is maintining the level of 3180.
Regards.


strong buying in mphasisswing trade idea
strong buying in mphasis
hitting all time highs
macd +ve price running above 50, 200 moving averages on hourly chart


MPHASIS..cliff hangerMPHASIS forming a save my butt on cliff top pattern ;)
break above or below the triangle determines the next move

MPHASIS LONGASCENDING TRIANGLE formation , making higher lows.
prior uptrend established.
breakout above 2760 and view invalid if it breaks the trendline as well as the horizontal green area of support.


MPHASIS - Trendline BreakoutHi Guys,
Stock is in a weekly uptrend, on a daily chart it has given breakout on upper side and retested upper trendline.
Initial Suggestion few days back
Buy Price - 2350
SL - 2094
New Suggestion
Buy Price - 2400
SL - 2165
Results have also come out strong.


