Mphasis BO 1st target 3600Very good stock and were consolidating for long time. Looks like if it give breakout minimum we can expect 300 point rally
Trade ideas

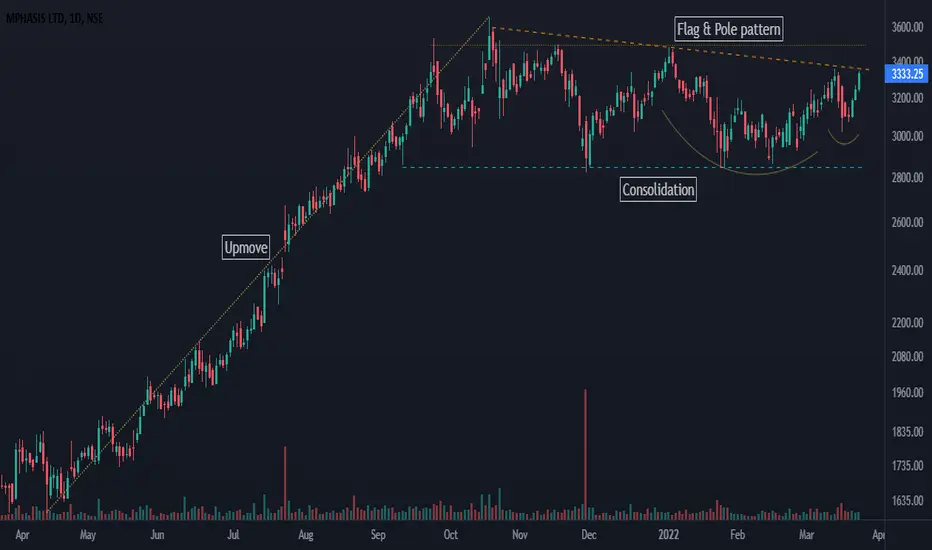
About to breakout !!!The stock looking for break out.
Add this stock into your radar.
This is only for educational purpose.

Mphasis Symitrical Triangle Chart Pattern ready to breakoutIn Mphasis Symitrical Chart pattern
Targets as given below
Ultimate target - 29 % - 4155
1.3737
2. 3988
3. 4155
buy after breakout

MPHASISMphasis Limited is a information technology (IT) services and solutions provider. The Company is engaged in offering applications, business process outsourcing (BPO) and infrastructure services.
Current price is more than the intrinsic value
Stock offers good dividend returns
Low probability of default in next 12 months
Pledged promoter holdings is insignificant
Net buying transactions were witnessed via insiders & bulk deals for each of the last 3 months
Largecap
With a market cap of ₹62,222 cr,
PE Ratio 51.14
Stock is 2.22x as volatile as Nifty
COMPANY DATA TAKEN FROM TICKER TAPE
Note:
1. Views are personal and for educational purposes only. Recheck and take the trade as per your RR.
2. Always remember SL is your lifeline, not the big target...
3. Follow us for more patterns and like, share so that we feel it is helpful to many and share more patterns...
3. Views given here is not a tip rather it is for educational purpose... Aftermarket opens, the condition might change so learn to handle different conditions...
4. To learn more about patterns, Psychology behind the trade, and price action trading... contact us... Thanks...
Keep an eye ladies and gentlemen. Cheers and Happy Trading


Turnaround potential in MPHASIS !!!!There is breakout of inverted head and shoulder in MPHASIS
could soon see levels of 3300 also there is rising RSI with positive histogram.
IT sector in focus.

Next Move One can Look for Next Unfolding Pattern in this Passion
Patterns while developing for Up side move may change as per Market sentiments or Earnings report or any News but it should make Up side move once the
current down stream completes
Look to trade in the direction of larger move as Next Move

Mphasis analysis just for study purpose
only technical view.
1st. bump and run reversal pattern
2800-2900 support zone
a big move expected. (both side, condition apply )


[ INTRADAY ] MPHASIS LONG BETrisk: Reward ratio is 1: 2
Rest as per Charts
********
Note -
One of the best forms of Price Action is to not try to predict at all. Instead of that, ACT on the price. So, this chart tells “where” to act in “what direction. Unless it triggers, like, let’s say the candle doesn’t break the level which says “Buy/Sell if it breaks”, You should not buy/sell at all.
=======
I use shorthands for my trades.
“Positional” - means You can carry these positions and I do not see sharp volatility ahead.
“Intraday” -means You must close this position at any cost by the end of the day.
=======
Always follow a stop loss.
In the case of Intraday trades, it is mostly the “Low/High of the Candle”.
In the case of Positional trades, it is mostly the previous swings
********


Mphasis Long tradeThe markings show that in Mphasis head and shoulder pattern can emerge which gives high reward and low-risk opportunity.
Not a recommendation to trade just an opinion


Mphasis looks good here to longMphasis CMP: 3150 is looking good on my charts with good momentum for short duration. T1: 3227, T2: 3311, T3: 3459, T4: 3519. Above idea is for educational purposes only and the views are solely mine. Please follow a strict stop loss of 2941.

MPHASIS : ADD ON Breakout of TrendlineMPHASIS : ADD ON Breakout of Trendline
NIFTY IT Bullish..
Details in the chart

MPHASISNSE:MPHASIS ...
Please note that we are not a SEBI Registered Investor Adviser/PMS/ Broking House.
All the contents over here are for educational purposes only and are not investment advice or recommendations
offered to any person(s) with respect to the purchase or sale of the stocks / futures and options.
You are also requested to apply your prudence and consult your advisers in case you choose to act on
any such content available as WE claims no responsibilities for any of your actions or any outcome of
such action


Chart on MPHASIS LTDChart on MPHASIS LTD
CMP @ 3230
Short Term Target @ 3350
Professional Target @ 3472..
Long Term Target @ 3577
Average @ 3090
I am expecting MPHASIS to move UP in coming days once it crosses 3300.
Disclaimer : I am not a SEBI registered Financial Advisor.. Please consult your financial advisor before investing.

( Swing )-----#mphasis------wedge Pattern BO Stock- #Mphasis ( Hourly chart )
Date- 13-dec-21
Sector- technology Service
Levels To Watch ...
Buy - 3326 ( Trendline Support )
1st Target - 3397 ( Resistance Line ) 5.29 %
Strict Stoploss - 3159 ( below Support Zone )
R:R - 1:2 ( Decent Ratio )
Time Frame - few days
Things In Our favour
1- Trendline Support & Upside Break
2- Bullish candlestick pattern
3. Trading above all MA
4. BO & retested & now moving
5. Volume support
Disclaimer:-
All My ideas are for Educational purpose Only & not a Buying or Selling recommendations . Levels are given for tracking only , I'm Not SEBI Registered Analyst .Please consult your Financial Advisor before taking any trades .
Check Few More Bo ideas Stocks in My Profile
Have a Nice day,
ReviveTraders

Swing Trading Opportunities for the week beginning 13-12-21SWING TRADING WATCHLIST FOR THE WEEK BEGINNING 13-12-21
INTENT
I will only be sharing the time frame and the scrip name. I will leave the trade basis aside as the intent is to engage the reader in learning the basics of finding good scrips. You can have a look at the charts and place your favorite indicators and check out if any of these fit your trade plan.
Some readers feel that I am simply listing down several scrips so that if they go up I can claim so. This is not the case - I am not here to score any points. I am sharing my weekly analysis and if you like it, read it and if you do not agree, I am fine with that.
ON MY WATCHLIST FOR THE COMING WEEK
This week, I have changed the format to some extent and I request you to let me know if you like this approach to finding Swing Trading Opportunities or the one that I was following till last weekend.
This is a weekly review of the available opportunities so my time frame for analysis moves from Daily to Weekly and from Hourly to Daily. I have also filtered the sectors based on Monthly candles. Here are the likely candidates for the week -
SECTORS LOOKING GOOD FOR LONG POSITIONS-
Considering the Monthly Charts, the following sectors look good:
Nifty 100 Liquid
Auto
Bank Nifty
Fin Service
Media
PSE
Considering the Weekly Charts, the following sectors look good:
Energy
Infra
IT
Midcap 100 Free
Midcap 50
MNC
Realty
If you look at the sectoral indices on the daily charts, all of them look beaten down and you would not like to trade them. This is precisely the message for a short term trader - these could be good short sell candidates, but not for Swing or Positional candidates.
WEEKLY TIME FRAME- FOR LONG POSITIONS - Nifty Spot at 17511
Bandhan Bank
Federal Bank
ICICI Bank
PNB
Bajaj Finance
Britannia
Dr Reddy
Infosys
Reliance
TCS
IRCTC
MCX
Arvind Fashion
Bank Baroda
BHEL
Car Trade
Chola Fin
Hind Petro
IndiGo
Indo Solar
Kitex
Mangalam Cement
Mphasis
Tata Coffee
Tata Comm
UBL
There are several opportunities that are available even as the tradable indices are at crucial levels. There were many more opportunities that I could sight but I have restrained myself and chosen what I believe are good or may end up as a good risk reward bets.
I may / may not take these trades as not every opportunity should / can be traded.
I believe that it is better to help someone learn the technique of selecting good scrips than giving tips - in any case, I am not SEBI regd so I do not have the authority as well to do so.
In case you are able to spot the setup and the trade basis, please do share so that together we can learn.
Here is the Video Link:
Thank you for your time and Happy Learning,
12-12--21
Disclaimer -- This post is shared for learning and educational purposes only and in no way acts as a recommendation. I am not a SEBI regd trader so please either decide your trades/investments on your own or consult your financial advisor before making any trades.

Mphasis Short Term Bearish OutlookWhen a major trendline is broken, prices will go almost the equal distance the amount it went above the trendline. Sell ~ 3250, 3230, with stop ~ 3310, target ~ 2950. Trade time frame 8 ~ 10 day's.
