Trade ideas
Navneet - Padhega India Tabhi toh Badhega India!!Excellent quarterly numbers and perfect breakout on charts. Looking good on all time frames. Hold tight for easy 2x in 2-3 years.
NAVNETEDULTDThe stock is consolidating along a trendline where it has found support multiple times. It's currently trading at a demand zone (above 50%), indicating active buyer participation.
For an upward movement, the stock will likely hunt stop losses by briefly dipping into the next demand zone, which coincides with the 61.8% Fibonacci retracement level.
The optimal buying range appears to be between 120-124.

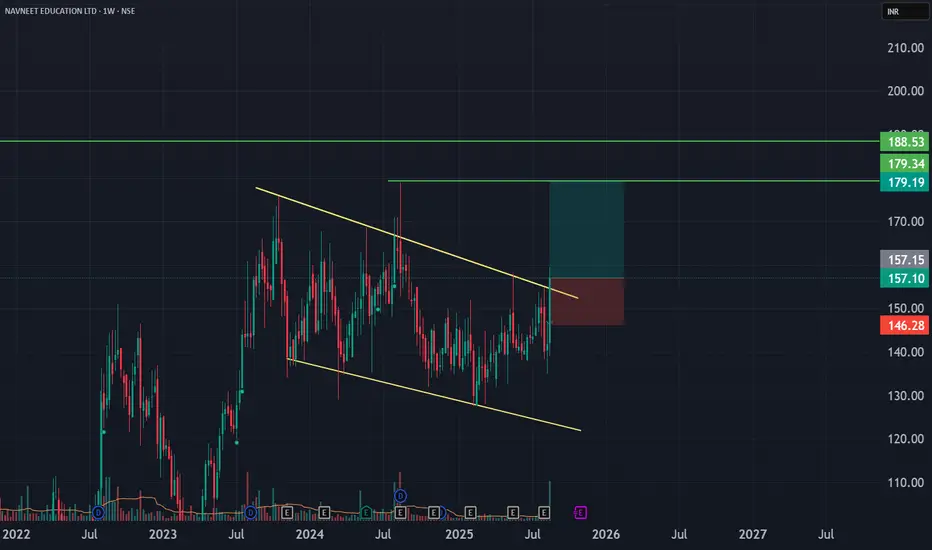
Navneet Education cmp 145.38 by Monthly Chart viewNavneet Education cmp 145.38 by Monthly Chart view
- Resistance Zone at 153 to 161 Price Band
- Weekly Support at 128 > 107 > 91 with Resistance at 161 > 175 > ATH 193.50
- 5+ odd years long timeframe Bullish Cup & Handle with tad bit higher neckline at Resistance Zone
- Price trading within 132 to 168 range with one dip below 132 and few spikes towards ATH 193.50 but breakouts failed

long navneet educationit is near the bottom of upward channel, close to 200dma (support); stoploss will be below 200dma

NAVNETEDUL - Weekly AnalysisIn the Weekly Chart of NAVNETEDUL ,
we can see that, after strong breakout of Cup & Handle Pattern and retesting the Trendline,
it went into consolidation.
It has shown an up move now.
Expected momentums are shown in chart.

NAVNEET EDUCATION -SWING TRADE1. Good consolidation of 9 months
2. Strong breakout candle
3. Volume Pop
4. Good risk-reward setup

NAVNETEDUL - Weekly AnalysisIn the Weekly Chart of NAVNETEDUL ,
we can see that, after strong breakout of Cup & Handle Pattern and retesting the Trendline,
it went into consolidation.
It has now made a Inside candle near resistance.
Enter on breaking its High with Low as SL.
Expected momentum is shown in chart.

NAVNEET EDUCATIONCompany has reduced debt.
Company is almost debt free.
Company has been maintaining a healthy dividend payout of 38.2%
Navneet Education Limited is primarily into manufacturing and trading of education books, reference books, technical & professional books in paper form and e-learning form, and also paper and non-paper based stationery products
Co. has a dominant market share of ~65% in western India. The company serves 5 Mediums/Languages for State Board Publications including CBSE/ICSE
Co. has 600+ SKUs for 30+ countries. Out of this, 60% of the total stationery exports are from the US market making it the most important market. Walmart is a preferred client.

navneetquick upside visible, increasing promoter and FII holding with volume burst indicates a positive bias

NAVNEET EDUCATION STRONG REVERSAL PATTERNNAVNEET EDUCATION Will Touch 175 Levels In the Upcoming Days From the Current market price We can see a Reversal
NSE:NAVNETEDUL
we can see a strong momentum in upcoming days
.
.
.
Disclaimer: This is not buy or sell signal it is just for educational purposes.

NAVNETEDUL Bullish; above 167.5 on Thursday 05th Oct NAVNETEDUL Bullish; above 167.5 on Thursday 05th Oct
Please check out the INTRADAY Trading Strategy in the COMMENTS section below during the live market hours:
---------------------------------------------------------------------------------------------------------------------
1) Impulse upmove stage: The strong upmove (nearly upto 2% from breakoutprice) happens within the first five to 15 minutes. "High Risk Traders" buys in hope of another 2% upmove intraday.
"High Risk Traders" may have to patiently wait through the Pullback-Consolidation stage to realize profits. High risk/High reward set up as breakouts may fakeout (reversal)also
2) Pullback-Consolidation stage: After the above "Impulse upmove stage"; the price may then pull back and move sideways (between "Open" price and "High" of the above "Impulse upmove stage").
Safe traders with minimum risk profile may Wait for a breakout from the consolidation to enter at this stage to relize high profits in the final intraday final "Breakout continuation" stage
3) Breakout continuation: Stocks often in the third stage breaks up above the "High" of the first "Impulse upmove stage" and continue to go higher again.
Both Safe Traders/High Risk Traders may book profits at this stage
Stop Loss: You may keep the stop loss @ "Open" price of the day OR "Breakoutprice"
The above information is not meant to be, and do not constitute, financial, investment, trading, or other types of advice or recommendation.

📉 Alert! Bearish Pattern Spotted! 🐻📉 Alert! Bearish Pattern Spotted! 🐻
📊 Pattern: Broadning Pattern
📌 Symbol/Asset: NAVNETEDUL
🔍 Description: Stock is around the resistance we may see good correction from those levels.
👉 Disclosure: We are not SEBI registered analysts, this is not a buy or sell recommendation. Technical patterns are just one piece of the puzzle. Consider conducting further research, consulting with a financial advisor, and managing your risks appropriately.

Swing Breakout Stock for Tomorrow | Breakout Stock to Buy Now |In this video, we're going to share with you our top 8 #breakoutstocks for tomorrow! These stocks are poised to make big moves in the coming days, so be sure to check them out! #swingtrading , #breakoutsignals
And finally, in this video, we'll give you some tips on how to invest in breakout stocks. We'll share with you our tips on how to find breakout stocks, how to trade them, and how to find :-
1. Breakout Stock
2. Breakout Stocks for Next Week
3. Breakout Stocks for Tomorrow
4. Breakout Stocks of The Week
5. Breakout Stocks to Buy Now
6. Breakout Stocks Tomorrow
7. Best Breakout Stocks for Tomorrow
8. Positional Breakout Stocks
9. Positive Breakout Stocks for Swing Trading
10. Positive Breakout Stocks
11. Swing Breakout Stocks for Tomorrow
12. Tomorrow Breakout Stocks
13. Tomorrow Intraday Breakout Stocks
14. Top breakout Stocks for Today
15. Top Breakout Stocks
------------------------------------------------------------------------------------------------------------------------
The purpose of this channel is to spread knowledge and awareness about the Stock Market for free. We do extensive fundamental and technical analysis and give recommendations solely based on our research.
Disclaimer: We are not SEBI registered. All the content (videos, comments, posts, community posts, live streaming, etc) of this channel is for educational and informational purposes only, Conduct your own due diligence, or consult a licensed financial advisor or broker before making any and all investment decisions.
-----------------------------------------------------------------------------------------------------------------------------
#breakoutsstocksfortomorrow
#swingtradestrategy #tradingstrategies #tradingstrategy #tradingstrategies #swingtrader #swingtrading #swingstocks #swingidea

NAVNETEDUL - Weekly AnalysisIn the Weekly Chart of NAVNETEDUL ,
we can see that, it has given a strong breakout of Cup & Handle Pattern.
Let it retest the Trendline then we can enter with SL.

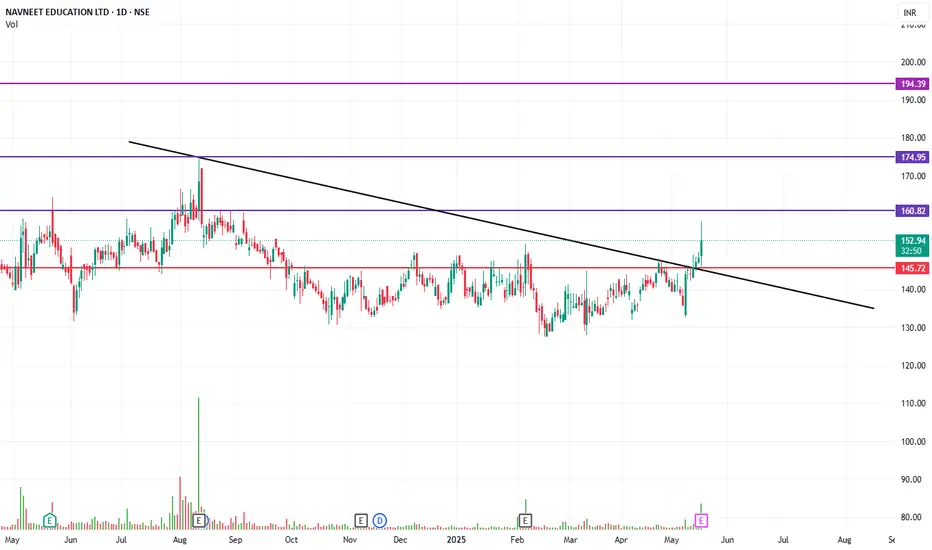
Navneet Education crossing channel resistance Navneet Education crossing channel resistance
Based on charts it was stuck at the long term channel with resistance levels of 120-130. Tried breaking channel and came down as a retracement. Now placed at a better position to break the channel on the up.
If we get good volumes on it it can give good upmove. Short term levels for me would be 145-152-179
No recommendations, just my view based on charts

NAVNEET EDUCATION - 57% RETURNS!!!BUY - NAVNEET EDUCATION
CMP - Rs. 91
Target - 1: Rs. 125
Target - 2: Rs. 145
.
.
Technicals - 1) Harmonic Patterns - Bullish Bat
2) Fibonacci Retracements to identify potential targets.
.
.
Comment: 1) Stock is in consolidation.
2) Target 2 will be achieved after 1 year.
.
Follow me for more!

NAVNEET EducationIf global and inidan makret will perform well then this tock is heading towards 150+ again.
Navneet Education Retest Completed its retest and is ready for year High.

ASCENDING TRIANGLE PATTERN
Ascending triangle patterns are bullish, meaning that they indicate that a security's price is likely to climb higher as the pattern completes itself. This pattern is created with two trendlines. NSE:NAVNETEDUL
It is created by price moves that allow for a horizontal line to be drawn along the swing highs and a rising trendline to be drawn along the swing lows. The two lines form a triangle.

NAVNETEDULINVESTMENT PICK
Buy around 100_125 | MCBSL 80
Mid-TermTgt - 160_170 / 190
Long-Term Tgt - 300 / 360 / 450

Navneet EducationA proper Stage 2 stock demonstrating good Relative Strength in a relative weak market alongwith good tennis ball action in its bounces supported by good volumes.

NavneetEducation#NavneetEDUCATION
Massive Volume breakout
In Stage 2 as per stage analysis
Retest done candidate
Inside Bar on weekly chart
low volume retest
Good fundamentals growth
Entry on CMP
with SL of 95
Targets: 138/153/165

NAVNEET EDUCATION TARGET 148NAVNEET EDUCATION monthly symmetrical triangle breakout. weekly double bottom breakout. Target 145
