NAZARA TECHNOLOGIES LTD | Monthly Chart Breakout📊 NAZARA TECHNOLOGIES LTD (NSE: NAZARA) | Monthly Chart Breakout
📅 Date: June 1, 2025
📈 CMP: ₹1,295.10 (+28.04%)
📌 Ticker: NSE:NAZARA
📉 Chart Pattern Insight
🔥 Cup & Handle + Falling Wedge Breakout
Nazara Tech has broken out of a strong Cup & Handle pattern, reinforced by a Falling Wedge breakout — a powerful confluence suggesting a major trend reversal.
🎯 Breakout is confirmed with high volume and a clean monthly candle close above key resistances.
📐 Fibonacci Retracement Levels (From High ₹1678 to Low ₹477)
🔸 38.2% – ₹935.85 (was resistance, now flipped to support)
🔸 50% – ₹1,077.55
🔸 61.8% – ₹1,219.25 (just surpassed – strong bullish confirmation)
🧭 100% – ₹1,678 (All-Time High)
📊 Indicator: RSI + Moving Average Cross (Icon shown)
🔍 RSI is at 71.63 and rising sharply, indicating strong momentum
🔺 RSI crossover above MA confirms bullish strength and trend continuation
🧱 Volume Spike
📈 Volume this month is multi-month high, validating the breakout
🔑 Key Levels
Support: ₹935 (prior resistance, now retest zone)
Immediate Resistance: ₹1,300 (psychological), ₹1,400
Target Zones:
Short-Term: ₹1,450
Medium-Term: ₹1,600+
Long-Term: Retest of All-Time High ₹1,678+
🛡️ SL: ₹935 (monthly close basis)
📌 Trading Plan
Entry: Pullback near ₹1,220–₹1,250 or breakout retest
SL: ₹935 (below 38.2%)
Target: ₹1,450 / ₹1,600+
Time Frame: Positional – Multi-week to multi-month
⚠️ Disclaimer
This analysis is for educational purposes only. Please do your own research or consult a SEBI-registered advisor before investing.
NAZARA TECHNOLOGIES LTD
1,347.20INRR
−43.30−3.11%
At close at 10:14 GMT
INR
No trades
NAZARA trade ideas

NAZARA TECH LTD ANALYSISFOR LEARNING PURPOSE
NAZARA TECH LTD - The current price of NAZARA TECH LTD is 1385.10 rupees
I am going to buy this stock because of the reasons as follows-
1. Its coming out from a good consolidation base
2. It broke a strong resistance zone of 4 year and it's trying to go for new ATH
3. It is showing better relative strength as it stood strong in volatile times
4. The risk and reward is favourable
5. The stock belongs to a sector which is trying its best to be strong and probably it can do great in coming days.
6. The stock has done almost nothing in last 5 years (approx) and it has acted as a laggard (many stocks have made ATH much back but this stock has gone down after its IPO. Initially it went up a bit but then it was all down move)
I will buy it with minimum target of 35-40% and then will trail after that.
My SL is at 1212 rupees
I will be managing my risk.

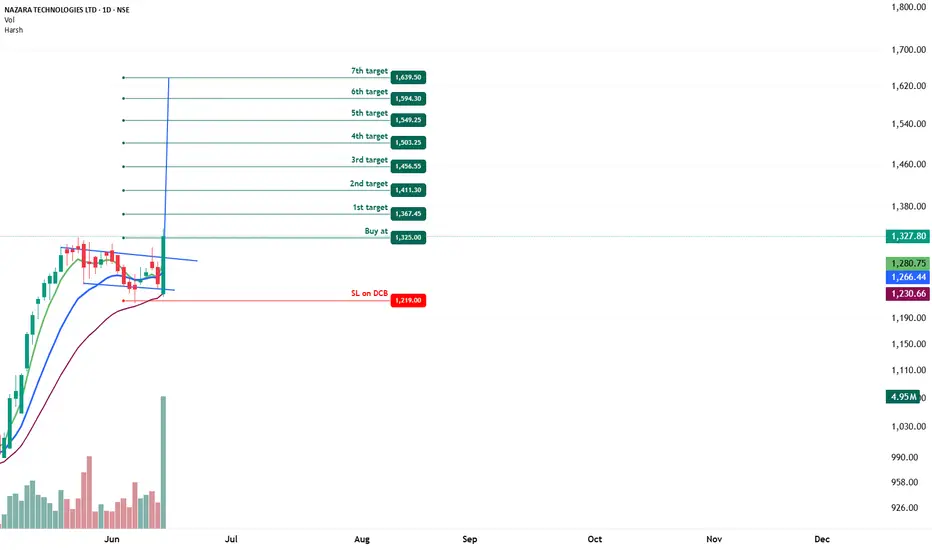
NAZARA TECHNOLOGIES - Bullish Flag & Pole Breakout (Daily T/F)Trade Setup
📌 Stock: ( NSE:NAZARA )
📌 Trend: Strong Bullish Momentum
📌 Risk-Reward Ratio: 1:3 (Favorable)
🎯 Entry Zone: ₹1325.00 (Breakout Confirmation)
🛑 Stop Loss: ₹1219.00 (Daily Closing Basis) (-12 % Risk)
🎯 Target Levels:
₹1367.45
₹1411.30
₹1456.55
₹1503.25
₹1549.25
₹1594.30
₹1639.50 (Final Target)
Technical Rationale
✅ Bullish Flag & Pole Breakout - Classic bullish pattern confirming uptrend continuation
✅ Strong Momentum - Daily RSI > 60, Weekly RSI >60 mONTHLY rsi ABOVE 60
✅ Volume Confirmation - Breakout volume 4.95M vs previous day's 946.53K (Nearly 4.5x surge)
✅ Multi-Timeframe Alignment - Daily and weekly charts showing strength
Key Observations
• The breakout comes with significantly higher volume, validating strength
• Well-defined pattern with clear price & volume breakout
• Conservative stop loss at recent swing low
Trade Management Strategy
• Consider partial profit booking at each target level
• Move stop loss to breakeven after Target 1 is achieved
• Trail stop loss to protect profits as price progresses
Disclaimer ⚠️
This analysis is strictly for educational purposes and should not be construed as financial advice. Trading in equities involves substantial risk of capital loss. Past performance is not indicative of future results. Always conduct your own research, consider your risk appetite, and consult a financial advisor before making any investment decisions. The author assumes no responsibility for any trading outcomes based on this information.
What do you think? Are you watching NSE:NAZARA for this breakout opportunity? Share your views in the comments!
Bullish Flag / Rectangle Pattern 🟢 **Trend Analysis**
* **Current Trend:** **Strongly Bullish**
* The stock has shown a sharp vertical rally from the ₹900–950 range to ₹1327 within a short time.
* Price is holding above key moving averages and forming a **flag/rectangle consolidation**, suggesting trend continuation.
--- 📊 **Chart Pattern**
* **Pattern Identified:** **Bullish Flag / Rectangle Pattern**
* A steep rally followed by sideways price movement in a narrow range (\~₹1215–1330).
* This is a **continuation pattern**, indicating the potential for the next leg up.
### 📈 **Breakout Level**
* **Breakout Zone:** ₹1325 – ₹1330
* The price has **closed at ₹1327.80**, right near the upper resistance level.
* If price sustains above ₹1330 with volume, it would confirm a **breakout**.
### 🔊 **Volume Analysis**
* **Volume on breakout attempt:** 4.95M (well above average)
* Accumulation visible during consolidation (low range candles with increasing volume).
* Today's candle shows a strong green body with a sharp rise in volume = **smart money activity**.
### 🎯 **Target Levels**
Targets are based on the pole length of the flag pattern:
* **Pole Length:** \~₹330 (from ₹900 to ₹1230 approx.)
* **Target Projection (post breakout from ₹1330):**
1. **First Target:** ₹1450
2. **Second Target:** ₹1550
3. **Final Target:** ₹1625 – ₹1650 (historical resistance zone)
### 🛡️ **Stop Loss (SL)**
* **Ideal SL:** ₹1215 (bottom of rectangle zone)
### ✅ **Summary**
| Parameter | Value |
| -------------- | ------------------------------ |
| CMP | ₹1327.80 |
| Trend | Strong Bullish |
| Pattern | Flag / Rectangle |
| Breakout Level | ₹1325 – ₹1330 |
| Volume | Strong (4.95M), bullish signal |
| SL | ₹1215 |
| Targets | ₹1450 → ₹1550 → ₹1625–1650 |

NAZARA | Flag and Pole | Breakout | Daily---
## 🚩 **NAZARA TECH – Bullish Flag and Pole Breakout**
### 📍 **Pattern: Flag and Pole**
* **Pole**: A strong vertical rally of **₹333.90** (\~33.7%)
* **Flag**: A downward-sloping consolidation (tight range), indicating **temporary pause**
* ✅ **Breakout from flag** with **volume spike** confirms continuation
---
### 📈 **Price Action & Levels**
* **Pole Base**: \~₹990
* **Pole Height**: ₹333.90
* **Breakout Point**: \~₹1308
* **Target Projection**: ₹1350+ ₹333.90 = **₹1638** 🎯
---
### 📊 **Technical Strength**
* ✅ **All EMAs** (8, 21, 55, 144) are bullishly aligned
* ✅ **Volume** surged on breakout, validating the move
* ✅ **RSI** broke out of downward trendline, resuming upside momentum
---
### 🔍 **Key Levels**
* **Support**: ₹1240 (flag base), ₹1089 (pole base & rectangle top)
* **Resistance**: ₹1342 (current high), then **₹1590+** (target zone)
* **Stop Loss (Swing)**: Below ₹1305 or ₹1240 zone
---
### 🧠 **Bias**: **Bullish Continuation**
Ideal for swing trades; entry on breakout retest or momentum continuation.


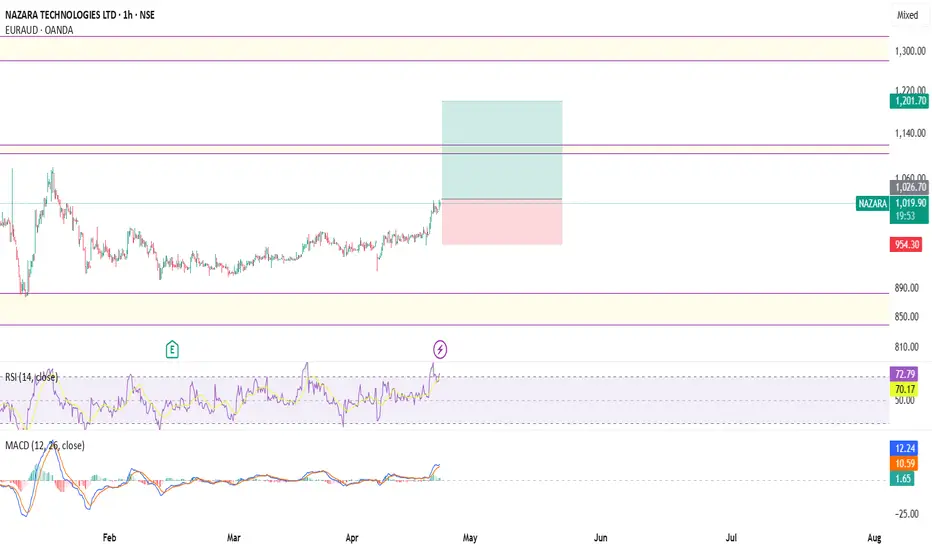
Nazara started the game with momentumEMA Cluster Support 🛡️
EMA 20: ₹1,014.86
EMA 50: ₹984.26
EMA 200: ₹1,036.84
All are sloping upward and well aligned for bullish confirmation.
Old Resistance Zones:
₹1,077 – breakout zone → now acts as support
₹1,106 – minor hurdle (today’s high). Above this, ₹1,150 and ₹1,180 are possible targets.
🏹 Momentum Swing Trade
Entry: On intraday dip toward ₹1,080–₹1,090
Stop-Loss: ₹1,045 (just below EMA 200)
Target 1: ₹1,150
Target 2: ₹1,180+
🪂 Alternative Re-entry Plan (If Pullback Happens)
Buy around ₹1,050–₹1,060 (previous resistance retest)
Risk is minimal here with strong support band from ₹1,014 to ₹1,036

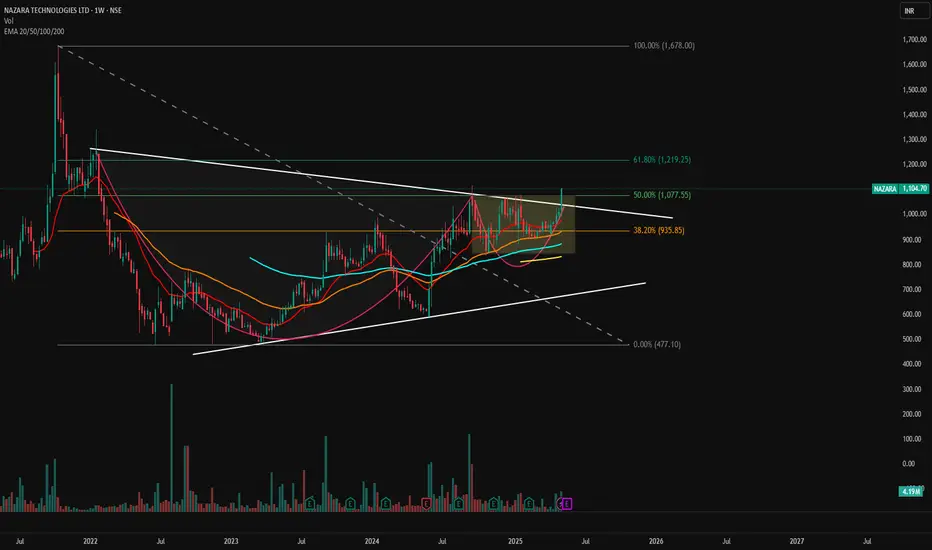
NAZARA - Breakout from Long-Term Falling Wedge📊 NAZARA – Breakout from Long-Term Falling Wedge | Strong Weekly Momentum
🕰️ Timeframe: Weekly | 💥 Pattern: Falling Wedge Breakout | 🔥 Sentiment: Bullish
📈 Chart Overview:
Nazara Technologies has broken out of a multi-year falling wedge on the weekly chart, with a strong green candle above key EMAs and Fibonacci confluence zones. Price closed the week above ₹1,100, indicating a shift in long-term momentum and a potential start of a fresh uptrend.
🔍 Technical Highlights:
📉 Falling Wedge Pattern: Multi-year consolidation now broken on strong volume
💥 Breakout Candle: Price closed above trendline resistance and key Fibonacci 50% level
🧠 Volume Surge: Volume confirmation signals institutional interest
📊 EMA Confluence: Price trading above 20/50/100/200 EMAs – bullish alignment
🧱 Support & Resistance Levels:
Level Type Price (₹)
🔼 Resistance 1 1,219.25 (Fib 61.8%)
🔼 Resistance 2 1,678.00 (Previous ATH / Fib 100%)
🔻 Support 1 1,077.55 (Fib 50% – breakout zone)
🔻 Support 2 935.85 (Fib 38.2% + EMA cluster)
🔻 Support 3 820–860 (multi-touch horizontal support & EMA 200)
🔧 Indicators Used:
Fibonacci Retracement – Plotted from swing low ₹477.10 to high ₹1,678.00
EMA 20/50/100/200 – Price is now above all EMAs, showing trend shift
Volume Bars – Confirming strong breakout
Chart Pattern – Falling wedge (typically bullish)
📌 Chart Sentiment & Setup:
✅ Bias: Strongly Bullish
📍 Breakout Level: ₹1,077
🎯 Upside Targets: ₹1,219 → ₹1,320 → ₹1,678
❌ Invalidation: Sustained close below ₹935 with volume
📢 Summary:
Nazara is showing signs of a structural breakout after prolonged downtrend and consolidation. The falling wedge breakout, confirmed by volume and EMA crossover, sets up a long-term bullish outlook. A retest of the ₹1,075–₹1,100 zone could offer a high-probability entry.
🧠 Pro Tip: Wait for a weekly candle close and minor pullback to the breakout level before entry.
⚠️ Disclaimer: This is a technical analysis post meant for educational purposes only. Please do your own research or consult a financial advisor before investing.
🔔 Follow @PriceAction_Pulse for more actionable swing setups, breakout alerts, and chart breakdowns!
NAZARA technologies ltd### **Comprehensive Analysis of Nazara Technologies Ltd (NSE: NAZARA)**
#### **1. Fundamental Analysis:**
**Overview:**
Nazara Technologies Ltd is a leading gaming and sports media platform in India with a presence in mobile gaming, esports, and sports media. It has a diversified portfolio, including mobile games like *World Cricket Championship* and *Kiddopia*, as well as esports through *Nodwin Gaming* and *Sportskeeda*.
**Key Financials (as of latest available data):**
- **Market Capitalization**: ₹8,094 crore (~₹919 per share as of Feb 2025)
- **Revenue Growth**: Nazara has shown solid growth, primarily driven by acquisitions in gaming, esports, and sports media sectors.
- **Profitability**: While the company has posted some losses in past quarters, it is focusing heavily on scaling its operations through aggressive acquisitions. Investors should monitor for consistent revenue growth and improved margins over the long term.
- **P/E Ratio**: Nazara trades at a higher-than-average P/E ratio compared to industry peers, reflecting high market expectations for future growth.
**Recent Developments:**
- **Acquisitions**: Nazara has strengthened its portfolio by acquiring *Fusebox Games* for $27.2 million and a stake in *PokerBaazi's* parent company, *Moonshine Technology*. These moves are aligned with the company's strategy to gain a bigger footprint in the online gaming and esports space.
- **Strong Industry Growth**: The Indian gaming and esports market is expected to grow rapidly, providing significant upside potential for companies like Nazara. This makes the long-term outlook favorable, although short-term volatility is expected.
**Key Strengths:**
- Diversified gaming portfolio (mobile, esports, media)
- Strong presence in the rapidly growing Indian gaming market
- Aggressive expansion through acquisitions
- Growth prospects in international markets
**Risks:**
- Volatility in earnings, particularly due to the company’s investment strategy
- Increased competition from other gaming giants and local players like Dream11 and MPL
- Regulatory risks associated with online gaming and esports
---
#### **2. Technical Analysis:**
**Current Price Action (as of February 2025):**
- **Stock Price**: ₹919
- **52-week High/Low**: ₹1,384 (High) – ₹713 (Low)
- **Recent Trend**: Nazara’s stock has shown significant volatility in the past year. After hitting a 52-week high in 2024, it has retraced and consolidated at lower levels, creating a sideways pattern in the short-term. This could signal a potential breakout or further correction depending on market conditions.
**Moving Averages:**
- **50-Day Moving Average (50-DMA)**: ₹935
- **200-Day Moving Average (200-DMA)**: ₹1,070
- The stock is currently below both its 50-day and 200-day moving averages, which suggests it is in a short-to-medium-term downtrend. A breakout above the 50-DMA could signal a potential reversal or upward momentum.
**Relative Strength Index (RSI):**
- RSI is at **42**, which indicates that the stock is neither overbought nor oversold. An RSI below 30 would suggest the stock is oversold, while an RSI above 70 indicates it is overbought. With the current RSI level, there is room for both upward and downward price action.
**MACD (Moving Average Convergence Divergence):**
- The MACD line is currently below the signal line, indicating bearish momentum. However, any crossing of the MACD above the signal line could indicate a bullish reversal.
**Volume Analysis:**
- The volume has been consistent but tends to spike during significant price moves. Volume analysis will be crucial in confirming price movements (up or down).
---
#### **3. Support and Resistance Levels:**
**Support Levels:**
- **₹710-725**: This range has proven to be a strong support zone in the past, as the stock tested this level during its recent decline. A breakdown below this range could lead to further declines.
- **₹780**: A secondary support level exists around ₹780, which would act as a mild support if the stock continues to test downward levels.
**Resistance Levels:**
- **₹980-1,000**: The stock faces strong resistance around ₹980-1,000. A breakout above ₹1,000 could signal the start of an uptrend, especially if the stock crosses above its 50-DMA and stays above it.
- **₹1,080**: This level has acted as resistance multiple times in the past and will be key to monitor for any bullish breakouts.
**Key Levels to Watch for Short-Term Movement:**
- **Immediate Resistance**: ₹950 (50-DMA)
- **Immediate Support**: ₹725 (Recent low)
---
#### **4. Risk and Reward Outlook:**
**Risk Factors:**
- Short-term volatility is high due to the company's ongoing growth and acquisitions. The stock may see continued fluctuations, which could lead to drawdowns for investors.
- Competition and regulatory challenges in the gaming sector could affect growth and profitability.
**Reward Potential:**
- Nazara has strong potential for long-term growth, especially if the Indian gaming and esports markets continue to expand at their current rate.
- The company's acquisition strategy, including global expansion, adds a layer of upside potential.
#### **5. Investment :**
- **Long-Term Investors**: If you're a long-term investor, Nazara’s growth story in the Indian gaming and esports industry makes it a compelling option. However, be aware of potential volatility in the short term due to high valuation and fluctuating profitability.
- **Short-Term Traders**: For traders, wait for a breakout above **₹950-980** to enter for a potential move toward **₹1,080** or higher. A breakdown below **₹725** could trigger a bearish move, so be cautious.
**Conclusion:**
Nazara Technologies has strong growth potential in a booming sector but comes with a degree of risk due to the volatility in stock price, competition, and regulatory uncertainty. Technically, the stock shows some bearish tendencies in the short term but offers significant upside potential in the longer term if the gaming and esports market continues to grow.
only for educational purpose

Nazara Technologies Ltd. can experience a range breakout#Nazara Technologies Ltd (NAZARA)
Closing above the 20, 50, and 100 EMA on the weekly chart and taking strong support at the 20 EMA on the monthly chart are positive signs. These indicators suggest that the stock is in a bullish trend and could see further upward movement after breaking through resistance levels.
Additionally, the stock's recent performance and the company's strategic moves, such as raising funds and acquiring new gaming titles, further support the potential for continued growth


NAZARA - Cup and Handle breakout - WklyName - NAZARA
Pattern - Cup and Handle breakout
Timeframe - Daily and Weekly
Volume - Very Good
Cmp - 1049
Can test - 1390
SL - 989
Cup and Handle pattern, which is a bullish continuation pattern indicating a potential upward trend. Here are some key points from the chart:
Cup and Handle Pattern: This pattern suggests that after a period of consolidation (the “cup”), there is a slight dip (the “handle”) before a potential breakout to higher prices.
Neckline: The neckline is marked at 989. This is a critical resistance level. Price breaks above this level, it has confirm the pattern and lead to further gains.
Target Price: The potential target price is around 1390 if the pattern completes successfully.
Volume: There is a significant increase in trading volume, highlighted by a large green bar. This often indicates strong buying interest and can support the bullish breakout.
Overall, the chart suggests a positive outlook if the price breaks above the neckline with strong volume support.
Price in range from 475 to 989 for 2.6 yr, Friday price closed abv that.
Nazara Technologies reported its Q1 FY24 results, showcasing a strong performance. Here are the key highlights:
Revenue: ₹250 crores, a slight dip from ₹254.4 crores in the same quarter last year1.
Net Profit: ₹23.6 crores, marking a 12.9% increase from ₹20.9 crores in the previous year2.
EBITDA: ₹24.9 crores, a 24.7% decrease year-on-year2.
The growth in net profit was driven by a strong performance in the esports vertical, despite lower profits in the gaming segment and losses in adtech2.


Nazara TechnologyWe are closely following Nazara Technologies and believe it’s poised for a breakout based on its technical patterns. Consolidation near resistance often suggests a potential for a breakout if the price action confirms it. If Nazara Technologies breaks through the 1020 level, it could indeed pave the way for further upside, potentially reaching your targets of 1350, 1500, and 1650+.
It’s always good to keep an eye on broader market conditions and any company-specific news that could impact the stock’s performance. Additionally, setting stop-loss orders or having an exit strategy in place might help manage risk if the price movement doesn’t go as expected.

NAZARA TECHNOLOGIES LTD (NAZARA)NAZARA TECHNOLOGIES LTD (NAZARA) appears to be in an uptrend. The price has been consistently making higher highs and higher lows, indicating bullish momentum. Additionally, there's a potential cup and handle formation, which is a bullish reversal pattern.
Entry, Target, and Stop-Loss
Entry:
Breakout: Wait for the price to break out of the neckline of the cup and handle pattern with increasing volume. This confirms the bullish breakout.
Target:
Measured Move: A potential target could be based on the height of the cup and handle pattern. Measure the vertical distance from the bottom of the cup to the neckline and project that distance upward from the breakout point.
Stop-Loss:
Swing Low: Place a stop-loss below the handle
Disclaimer: This analysis is based on historical data and technical indicators. It does not constitute financial advice. Always consult with a financial advisor before making investment decisions.


Nazara is ready to show action!!! Hello👋
Today I have picked one more breakout stock.. Named - NAZARA
Stock in uptrend..
Good volumes since last few weeks..
Rsi in bullish zone..
Cup & Handle pattern seen in weekly tf.
Price currently facing the resistance from where price shoot up in 2021 & downfall in sept 23 & jan 24.
If price hold above 1040 then upside targets open till 1200..
It's my view... DYOA. It's not buy/sell recommendation. And since it's August month.. Huge volatile market .. Plus because of war conditions just be cautious.. Keep an eye on your positions & hold strict SL.
I'm not sebi registered analyst.
Plz boost my idea if you find it useful.
Thank you🙏
