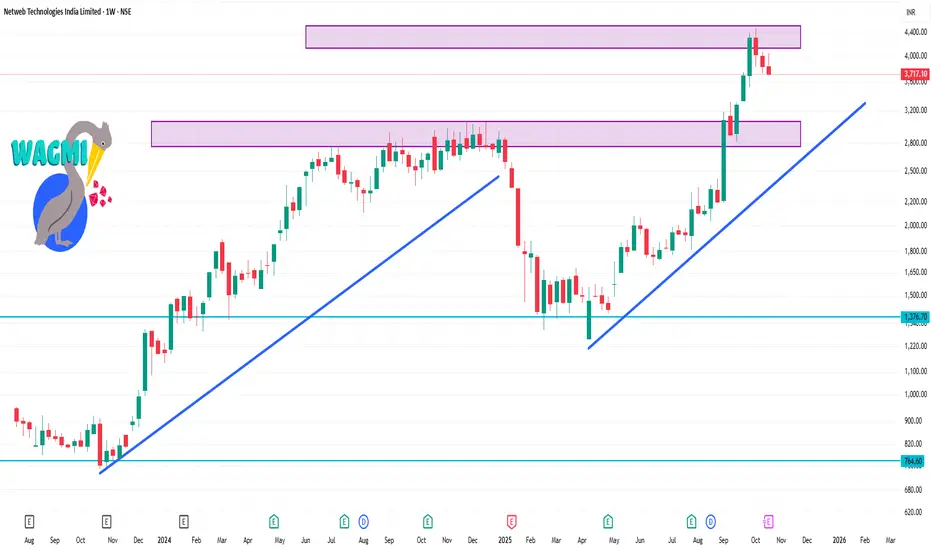
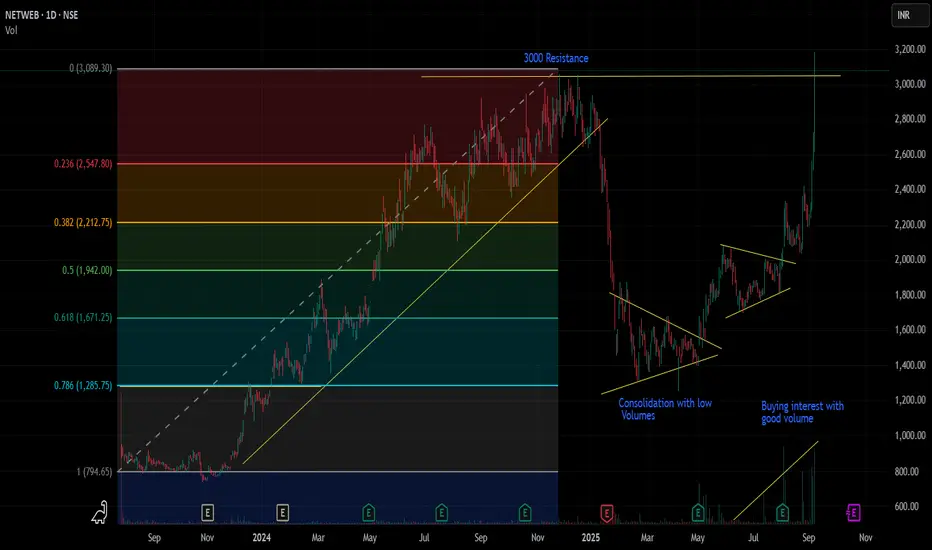
ATH Resistance to Support in NETWEB3000 level has been acting as resistance in 2024. Later it was broken in 2025 and now we see retest of the same level.
There is good buying interest seen at this level making it Low risk entry.
Also this support is near weekly 20sma which makes it high probability trade.
SL targets on chart. Note that holding time can be 8 to 20 weeks.
Netweb Technologies India Limited
No trades
What traders are saying

NETWEB: High-Conviction Support Bounce & Momentum ShiftNETWEB is demonstrating a powerful Breakout and Retest play. After clearing its 2024–2025 resistance levels near the ₹3,000 zone, the stock has pullbacked to test this area, which is now acting as a high-probability Demand Zone. This retest coincides with the weekly 20-SMA, increasing the conviction of a fresh upward leg.
Technical Analysis & Breakout Factors
Role Reversal (S/R Flip): The previous major supply zone around ₹3,000–₹3,100 has been comfortably absorbed and is now serving as solid structural support.
Moving Average Alignment: The stock is trading above ALL key long-term moving averages (100-day and 200-day SMAs). Crucially, the recent price action shows a successful bounce and close above the 10 and 21 Exponential Moving Averages (EMA), signaling that short-term momentum has reclaimed control.
Relative Strength (RS): RS is CONFIRMED POSITIVE. While the broader Sensex/Nifty has shown weakness (declining ~2.6%), NETWEB has significantly outperformed, gaining 8.3% in the same weekly period.
Character Change: The recent surge from the pivot bottom marks a Change of Character (CHoCH) with price now rising 9.5% from that local low.
Volume Confirmation: The initial breakout was supported by massive institutional delivery volumes (nearly 94% higher than the average), indicating genuine accumulation rather than retail speculation.
Trade Recommendation: Long Position (Swing Trade)
Action: BUY (Long Entry)
Entry Trigger: Current levels or a break above the recent intraday high of ₹3,437.
Target 1 (T1): ₹3,850 (Immediate swing high resistance).
Target 2 (T2): ₹4,480 (Test of the All-Time High).
Stop-Loss (SL): ₹2,980 (Weekly close below the critical ₹3,000 support zone).
Risk/Reward Ratio (R:R): Approx. 1:3.0 (Risking ~₹330 for a gain of ~₹1,160 to T2).
Key Takeaway for Traders
NETWEB is a unique "Sovereign AI" play with strong fundamental tailwinds, including a ₹21,840 million strategic order pipeline. The technical confluence of a Support Flip and positive RS makes this a standout candidate for the next leg of the bull run. Position size carefully ahead of the Q3 earnings results on January 16-17, 2026.
Disclaimer: This analysis is for educational purposes only and does not constitute financial advice. Always perform your own research before trading.

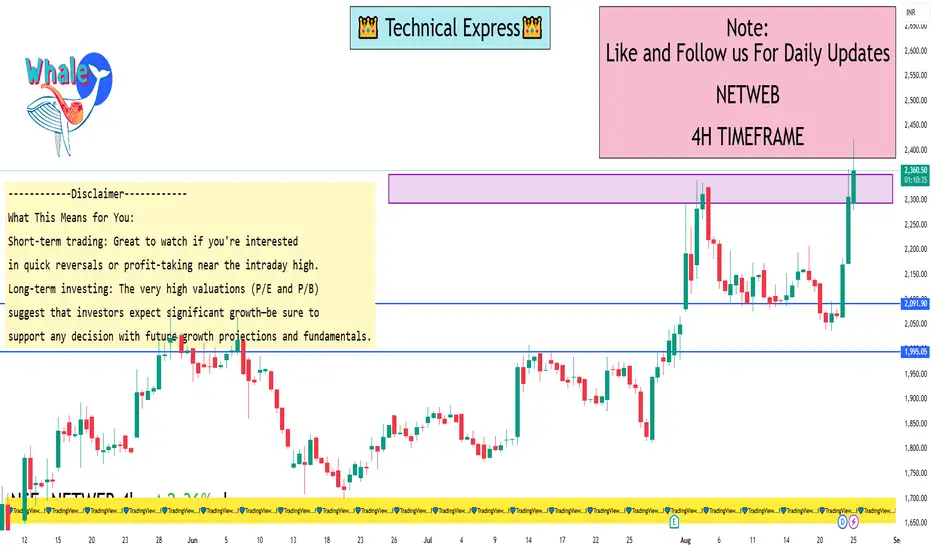
NETWEB 1 Day Time Frame 📌 Current Price (Approx)
NETWEB ~ ₹3,347–₹3,368 on NSE (latest market price) — this is the recent traded range as markets open/continue today.
📊 Daily Technical Levels (1-Day Chart)
Pivot Point (Key Reference)
Pivot: ₹3,335–₹3,359 area — central decision zone for bulls vs bears.
🔥 Resistance Levels (Upside)
1. R1: ₹3,436–₹3,437 — first resistance zone.
2. R2: ₹3,525–₹3,526 — next upside hurdle.
3. R3: ₹3,626–₹3,627 — extended breakout target.
📉 Support Levels (Downside)
1. S1: ₹3,246–₹3,247 — immediate support.
2. S2: ₹3,145–₹3,145 — intermediate support line.
3. S3: ₹3,056–₹3,056 — deep support level.
📌 How to Use These Levels Today
Bullish bias: If price stays above pivot (~₹3,350) and breaks R1 ~₹3,436, next targets are R2 and R3.
Bearish bias: If price drops below S1 (~₹3,246), watch S2 and S3 for possible pullbacks/support zones.
📊 Short-Term Technical Mood
Pivot levels suggest an active trading range today — traders often use these references for intraday entry/exit.
RSI/MACD short-term signals are mixed to neutral, indicating a balanced fight between bulls and bears (not strongly overbought nor oversold on daily).
Netweb: Breakout and retest playOn weekly chart, it is observed that netweb had broken out with high relative volume in the month of september 2025. Stock ran up on higher volumes. Since 2 months stock corrected to the same previous resistance levels which may now act as support.
This can be a breakout and retest trade. The volumes on correction are relatively very low which suggests a routine correction in uptrend and not downfall. All these observations suggest further upside in stock. Today might be the start of new upleg as on daily chart today’s volume was relatively very high.
So all in all keep netweb in your watchlist for long trade.

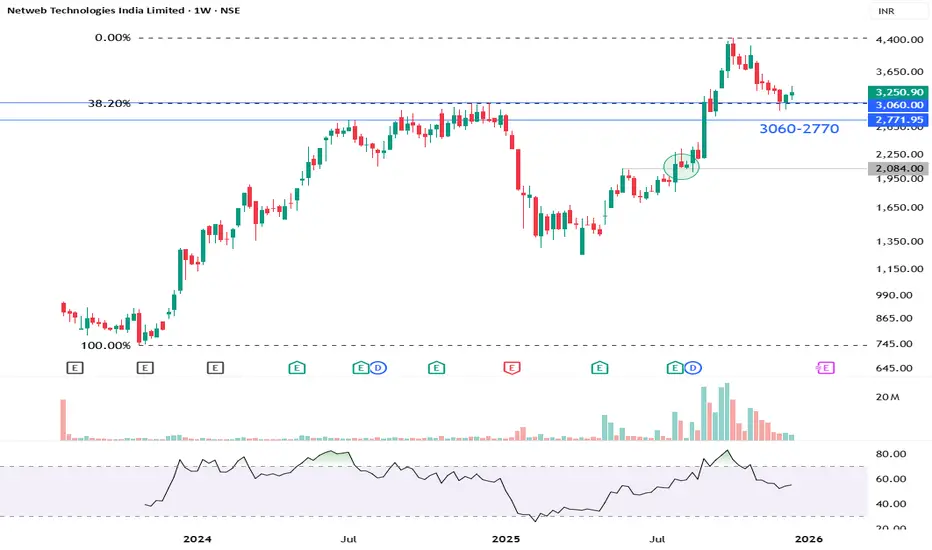
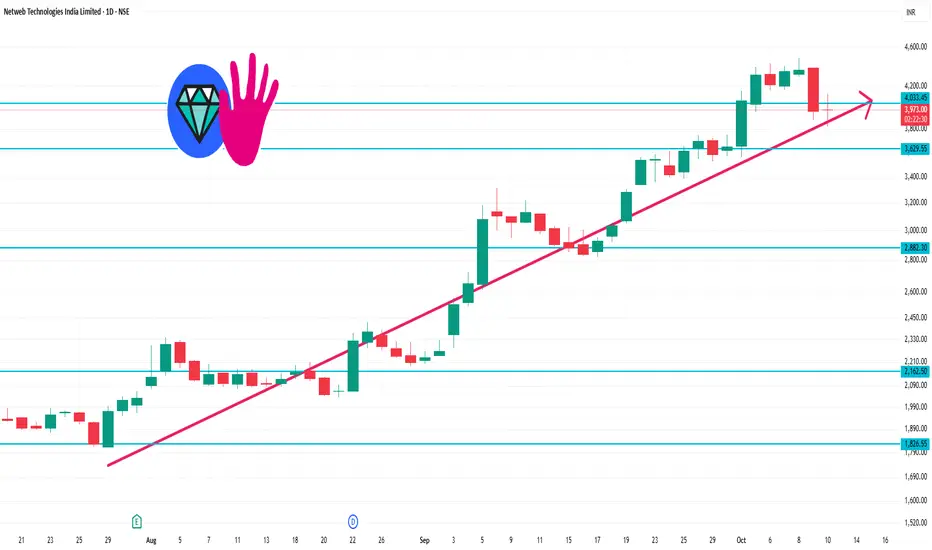
NETWEB
We identified change of trend around July 2025 (Rs.1962).
The stock witnessed a strong up-move after that supported with high volumes.
Currently, the stock has witnessed a pullback to its Support zone provided by important previous highs.
The stock is likely to resume its up-move from this support.
Sustaining above 2750 would keep bullishness intact.
Time to have a foot in the door of AI for India ?The NVIDIA of India.
The sock have rallied almost 8X since its IPO price.
Since the last month it has corrected over 25%.
> Reasons to consider the stock-
- Fastest growing company in segment.
- Strong growth(~66%).
- Backed by India AI Mission, NSM, and PLI schemes.
- India's digital transformation need more AI and Cloud Infra giving it large room still to grow.
- Strong Orderbook of ₹3,252 Cr.
- govt. projects >50%
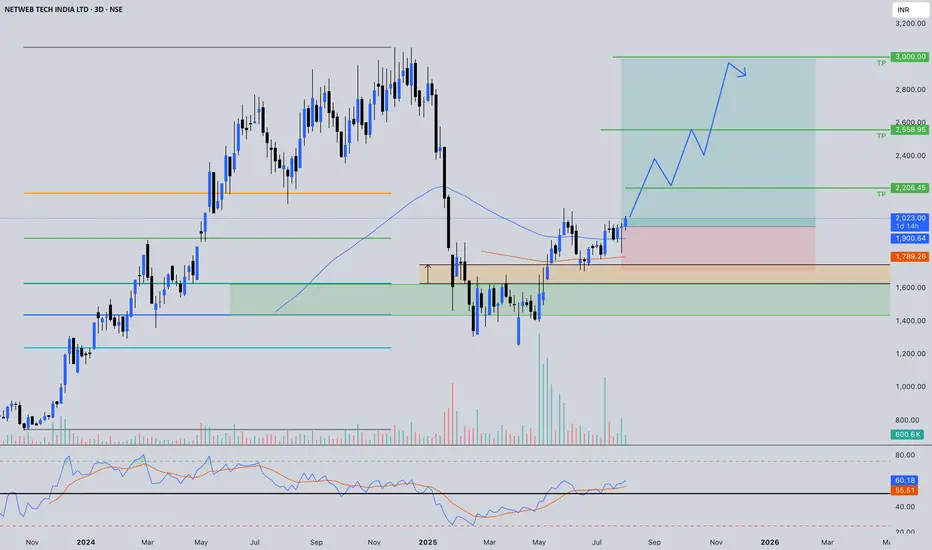
Optimized Strategy (Clear, Actionable)
Price Range --> Condition --> Allocation --> Rationale
₹3,000–₹3,300 --> Current --> 15% --> FOMO hedge
₹2,600–₹2,800 --> 15–20% correction --> 20% --> Better value
₹2,200–₹2,400 --> 30% correction --> 25% --> High value zone
₹1,900–₹2,100 --> 40% correction --> 25% --> Deep value — strong buy
₹3,600+ Only on earnings upgrade --> 15% max --> Grow with fundamentals
The stock is currently worth accumulating of initial step. There is a big room for the stock to grow looking at India growing digital sector. We need data localization and the company is in a partnership with Global sector Giant NVIDIA. Bett]ting on the company worth.
Note : I am not a SEBI registered analyst so ask your advisor or do your own research before taking any financial decision. I am not responsible for any of you losses.
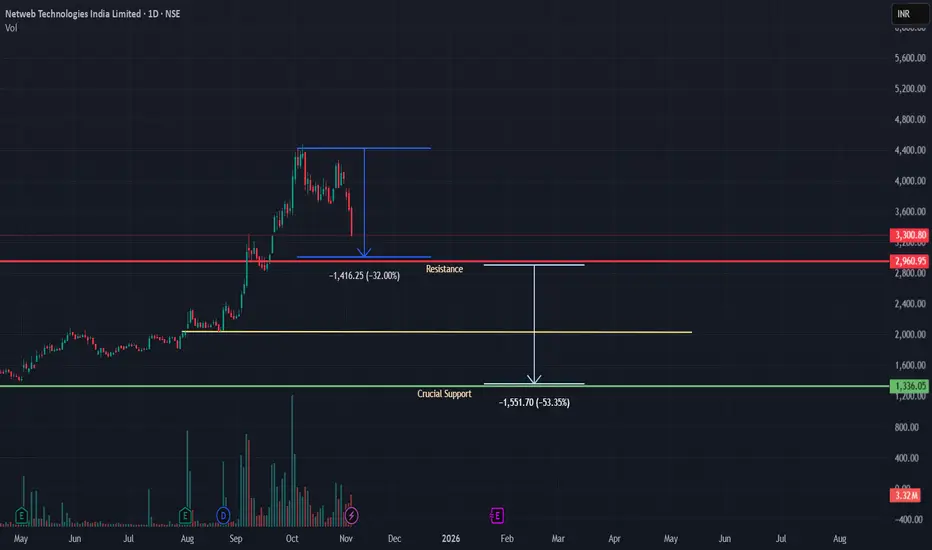
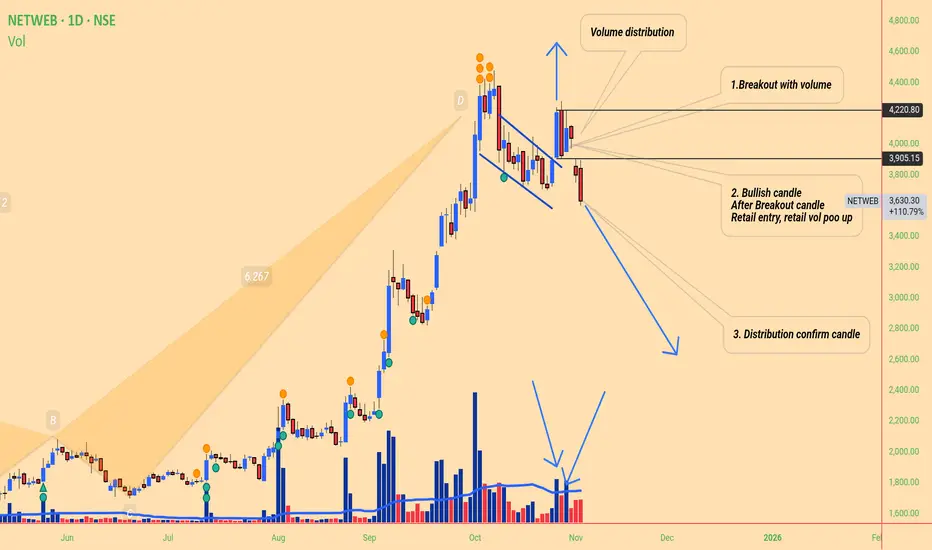
Netweb Volume distribution Technical -
Clear distribution chart , retail heavily trap show on volume, now that area work as
Trap resistance,
3 step distribution happened
1st, break out base ( Trending stock on social media ai hot sector)
2nd break out time volume that attracts retails
3nd after institute sell to retail , clear sign ( small candle show high buyer sellers active)
& Last distribution confirm low volume big red candle ( no one like to purchase that why vol big body candle confirm distribution sign)
Also harmonic pattern type 2 crab( historical pattern)
Fundamentals -
Stock trading 8 time peg ratio , 1 pEG ratio is consider fair but here it 8X
Also compared to us stock like nvidia, this stock overpriced
Also result declared that show poor
Maybe this thing tell stock created top here.......
How volume distribution looklike:
Netweb Technologies – Riding India’s AI BoomNetweb Technologies just posted another solid quarter — Q2 FY26 profit rose 19.8% YoY to ₹31.4 crore , and revenue climbed 20.9% to ₹303.7 crore .
The company also announced two large AI-infrastructure orders worth ₹2,184 crore , to be executed by FY27 — projects of national importance aimed at strengthening India’s AI compute backbone.
Founded in 1999, Netweb has evolved into one of India’s top high-end computing OEMs , providing full-stack server, storage, and AI-cloud solutions.
With a market capitalization of around ₹229 billion , a P/E near 179 , and promoters holding 70.75% , it’s clearly positioned as a premium play on India’s emerging tech hardware scene.
Riding the Global AI Wave
As the world races to build computing power for artificial intelligence, Netweb is positioned right where the action is.
Its expertise in AI-focused data centers and HPC systems fits seamlessly into India’s push for a “Sovereign AI” framework.
Those fresh strategic orders aren’t just business wins — they mark India’s deeper entry into the global AI supply chain.
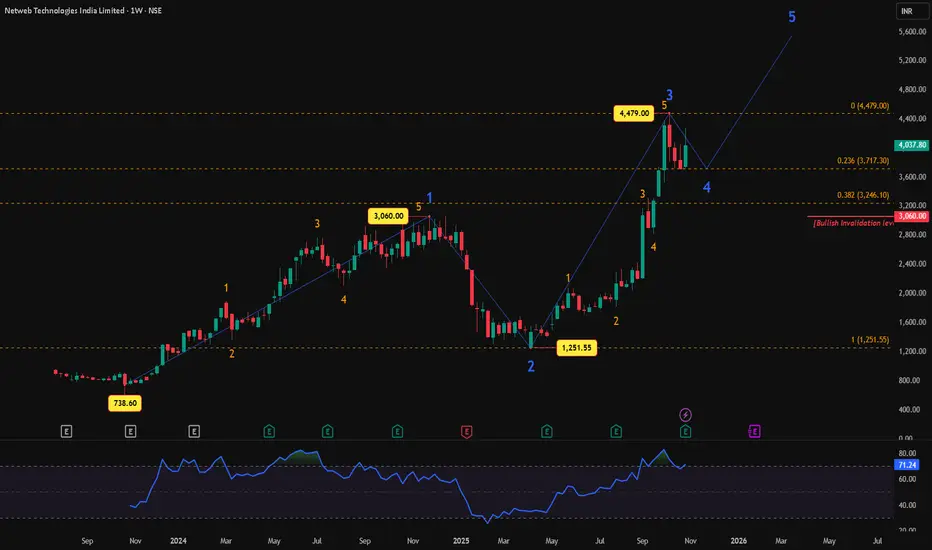
Technical Picture – A Textbook Impulse
The weekly chart unfolds into a clean five-wave impulse in progress — with Waves 1 through 3 already complete, topping near ₹4,479 . The stock now appears to be tracing Wave 4, a corrective phase before the final Wave 5 advance resumes.
The bullish invalidation sits at ₹3,060 — a dip below this level would question the ongoing impulse count.
If the structure holds, Wave 5 could propel prices toward the ₹5,300–₹5,600 zone, extending the uptrend that began in late 2023.
Quick Financial Snapshot
FY25 revenue : ₹11.43B (+58% YoY)
Debt : Only ₹10.25M – practically debt-free
Free cash flow : Negative ₹295M (signs of growth investment)
Strong growth, lean balance sheet, but a bit of cash burn — classic expansion mode behavior.
Final Take
Netweb’s chart and fundamentals tell the same story — a brief pit stop before the next sprint.
While valuations look steep, the structural and thematic tailwinds remain powerful.
Sustain above ₹3,060 , and the bigger Wave 5 rally could well coincide with India’s AI infrastructure boom .
Disclaimer:
This analysis is for educational purposes only and does not constitute investment advice. Please do your own research (DYOR) before making any trading decisions.
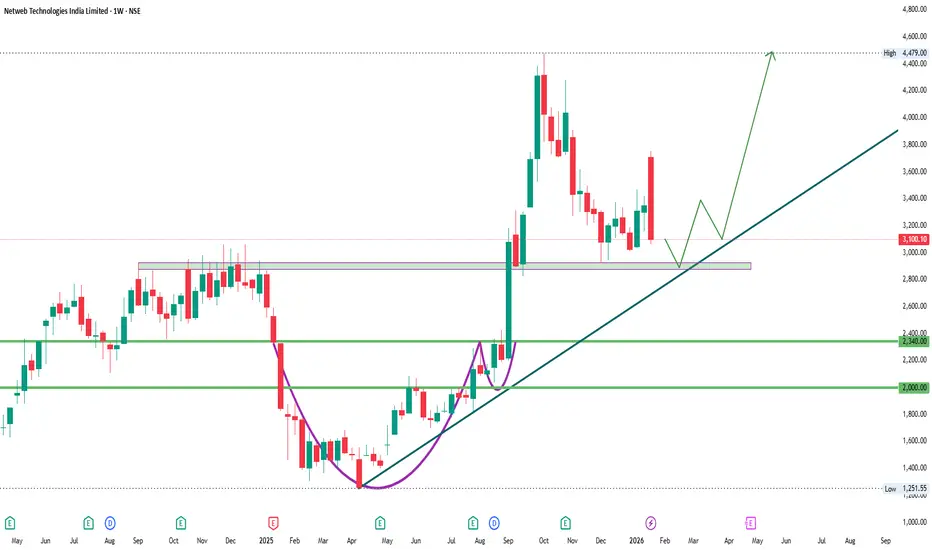
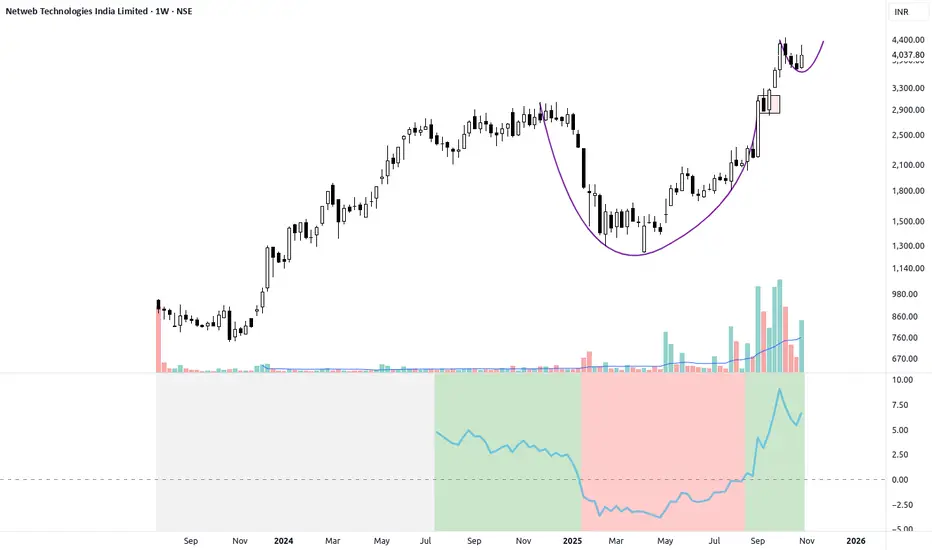
NETWEB - The Power Launch SetupThe Setup: Consolidation & Trend Continuation
NETWEB has successfully transitioned from a major correction (the large rounded dip, or "Cup") into a powerful, sustainable uptrend. This stock is now demonstrating a classic Continuation Flag just below its all-time high zone.
The stock staged a huge, high-volume rally out of its base (from the May 2025 low near ₹1,200).
It is currently consolidating in a tight, bullish manner right at the prior peak, setting up for a breakout into price discovery.
The tight consolidation pocket (the "handle" or flag) is providing a low-risk entry point for the next major leg up.
Key Technical Confirmation
Close to All-Time Highs: Trading at or near its all-time high is a sign of immense demand, as all prior sellers have been flushed out.
Trading Above All MAs: The price is trading above all key moving averages, which are perfectly stacked in a bullish order (shorter above longer). This confirms a strong, dominant uptrend.
Superior Relative Strength: The Relative Strength line is surging and remains strongly positive. This stock is a sector leader and is decisively outperforming the Nifty.
Volume Signature: Volume has been spiking aggressively on the recent upward moves, while the consolidation period (the last few weeks) shows quiet, decreasing volume. This confirms demand is overwhelming supply at this high level.
Sector Strength: Data Centre sector is experiencing strong tailwinds, supporting sustained momentum in leading names like Netweb.
The Trade Plan
Entry Signal: A decisive weekly close above the high of the current consolidation range (approx. ₹4,400). Look for a strong surge in volume accompanying the breakout to confirm conviction.
Stop Loss (Risk Management): Place a clear, objective stop loss below the low of the current tight consolidation pocket, for example, around ₹3,600 - ₹3,700. This maintains a favorable risk/reward ratio.
Target Expectation: Once this stock clears its all-time high on volume, it enters price discovery mode. The expectation is for a powerful, sustained run into new high territory.
Potential Risks & Cautionary Notes
All-Time High Resistance: Trading at an all-time high means there is often psychological resistance. If the stock fails to clear the pivot (₹4,400) and reverses sharply, it could lead to a quick shakeout.
Momentum Loss: The stock's strength relies heavily on its momentum. Any sudden market pullback could cause aggressive profit-taking, leading to a break below the recent support levels.
Volatility: This is a high-beta stock, meaning its price swings can be large. Use a smaller position size than usual to account for its high volatility and protect capital.
# Disclaimer: This is for educational and observation purposes only and is not financial advice. Trade at your own risk.
NETWEB 1 Week Time Frame 📉 Weekly Performance
Current Price: ₹3,743.70
1-Week Change: -2.19%
52-Week Range: ₹1,251.55 – ₹4,479.00
📌 Key Support & Resistance Levels
Immediate Support: ₹3,700
Immediate Resistance: ₹3,800
52-Week High: ₹4,479.00
52-Week Low: ₹1,251.55
🧠 Overall Technical Outlook
Trend: Bearish
Indicators: Majority suggest a sell or neutral stance
Market Sentiment: Weak, with potential for further downside if support levels are breached
NETWEB 1 Day Time Frame 📈 Current Intraday Levels
Current Price: ₹4,063.60
Day’s High: ₹4,125.9
Day’s Low: ₹3,821.00
VWAP (Volume-Weighted Average Price): ₹4,034.65
Volume Traded: Approximately 2.4 million shares
Market Cap: ₹22,894 crore
52-Week Range: ₹1,251.55 – ₹4,479.00
Circuit Limits: Upper: ₹4,756.30; Lower: ₹3,170.90
The stock has shown a notable rise today, breaking above the ₹4,000 mark and approaching its day high. This movement follows a recent dip to ₹4,014.35, indicating a rebound in investor sentiment
NETWEB TECH: Reversal Play with 50% Upside potential⚡️Price Analysis:
1️⃣ Price showing strength.
2️⃣ Price structure is bullish.
3️⃣ Good momentum is expected
✨ Key Observations:
➡️ RRR favorable at CMP.
➡️ Price bouncing from support zone
⚠️ Disclaimer: This is NOT a buy/sell recommendation. This post is meant for learning purposes only. Views are personal. Please, do your due diligence before investing.⚠️
💬 Share your thoughts in the comments below! ✌️
🔥 Trade Safe! ✅ 🚀
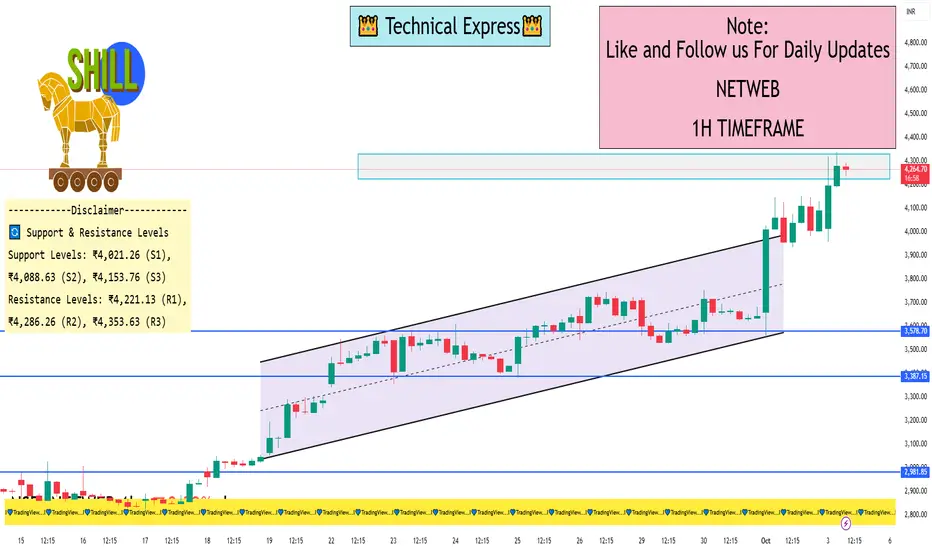
NETWEB 1 Hour ViewNETWEB is trading at ₹4,216.00, reflecting a 3.79% increase from the previous close.
📈 1-Hour Technical Analysis (as of 10:43 AM IST)
Based on intraday data, here are the key technical indicators for NETWEB on the 1-hour timeframe:
Relative Strength Index (RSI): 81.37 — indicates the stock is in the overbought zone, suggesting potential for a short-term pullback.
Moving Average Convergence Divergence (MACD): 395.90 — confirms a strong bullish momentum.
Average Directional Index (ADX): 60.55 — suggests a strong trend in the market.
Stochastic Oscillator: 89.93 — indicates the stock is in the overbought zone.
Super Trend: ₹3,386.37 — supports the current upward movement .
Williams %R: -4.50 — suggests the stock is in the overbought zone.
🔄 Support & Resistance Levels
According to pivot point analysis, the key support and resistance levels for NETWEB are:
Support Levels: ₹4,021.26 (S1), ₹4,088.63 (S2), ₹4,153.76 (S3).
Resistance Levels: ₹4,221.13 (R1), ₹4,286.26 (R2), ₹4,353.63 (R3).
The current price of ₹4,216.00 is near the R1 resistance level, indicating potential for a breakout if the price surpasses this level.
📊 Trend Analysis
The stock is exhibiting strong bullish indicators across multiple timeframes, including the 1-hour chart. The RSI, MACD, and ADX all suggest a continuation of the upward trend. However, the overbought conditions indicated by the RSI, Stochastic Oscillator, and Williams %R suggest that traders should be cautious of potential short-term pullbacks.
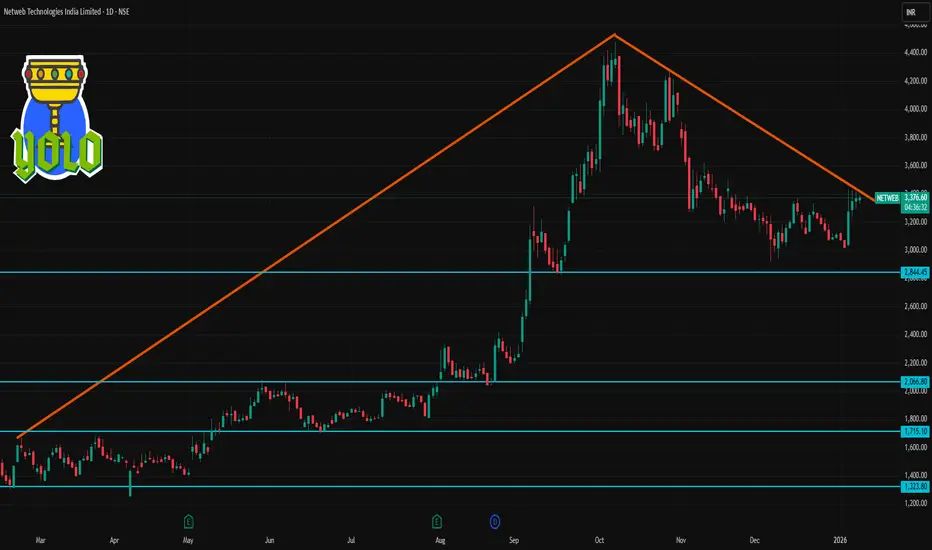
NETWEB: AI Infrastructure Goldmine ? Chart of the MonthNSE:NETWEB MarchingTowards 4,000: Is This the AI Infrastructure Goldmine You've Been Waiting For? Let's analyze in the "Chart of the Month".
As per the Latest SEBI Mandate, this isn't a Trading/Investment RECOMMENDATION nor for Educational Purposes; it is just for Informational purposes only. The chart data used is 3 Months old, as Showing Live Chart Data is not allowed according to the New SEBI Mandate.
Disclaimer: "I am not a SEBI REGISTERED RESEARCH ANALYST AND INVESTMENT ADVISER."
This analysis is intended solely for informational purposes and should not be interpreted as financial advice. It is advisable to consult a qualified financial advisor or conduct thorough research before making investment decisions.
Price Action Analysis:
- Current Price: ₹3,695.40
- 52-Week Range: ₹738.60 - ₹3,745.00
- Recent Performance: +64% gain in a Month with strong momentum
- Price structure shows consistently higher highs and higher lows pattern
- Stock has demonstrated remarkable resilience with a 380% rally from its 52-week low
Volume Spread Analysis:
- Volume surge visible during recent breakout phases
- High volume of 24.25M shares traded, indicating institutional participation
- Volume expansion coinciding with price breakouts confirms genuine buying interest
- Strong volume accumulation during consolidation phases suggests smart money positioning
Chart Patterns Identified:
- Symmetrical Triangle Breakout: Successfully broken above the triangle pattern
- Ascending Triangle: Multiple resistance tests followed by decisive breakout
- Flag and Pennant Patterns: Short-term consolidation after sharp moves
Key Technical Levels:
Support Levels:
- Immediate Support: ₹3,200 (recent consolidation zone)
- Strong Support: ₹2,800 (previous resistance turned support)
- Major Support: ₹2,400 (trendline support and psychological level)
- Critical Support: ₹2,000 (long-term ascending trendline)
Resistance Levels:
- Immediate Resistance: ₹3,745 (52-week high)
- Next Resistance: ₹4,000 (psychological round number)
- Extended Resistance: ₹4,400 (measured move projection)
- Long-term Resistance: ₹5,000
Base Formation:
- Primary Base: ₹1,200-₹1,600 range (established during deep consolidation)
- Secondary Base: ₹2,400-₹2,800 range (recent re-accumulation zone)
- The stock has clearly established a strong foundation above the ₹2,400 levels
Technical Indicators Assessment:
Momentum Indicators:
- RSI is in overbought territory but showing positive divergence
- MACD showing bullish crossover with expanding histogram
- Stochastic indicates strong upward momentum
- ADX suggesting strong trending behaviour
Moving Averages:
- Price trading well above all major moving averages
- 20 EMA, 50 EMA, and 200 EMA in perfect bullish alignment
- Strong uptrend confirmed by ascending moving averages
- No signs of trend reversal in the near term
Sectoral and Fundamental Backdrop:
AI Infrastructure Sector Outlook:
- India's IndiaAI Mission with ₹10,372 crore budget creating massive opportunities
- Government's push for sovereign AI infrastructure benefiting domestic players
- Global demand for AI computing infrastructure is experiencing exponential growth
- Limited domestic competition in the high-end computing solutions space
Company-Specific Fundamentals:
- Netweb's supercomputers have appeared 15 times across three entries in the global Top 500 supercomputers ranking
- The company is almost debt-free with a market cap of ₹20,936 crore
- Recent order wins worth ₹1,734 crore for IndiaAI Mission and ₹450 crore additional order
- Order pipeline of ₹4,142.1 crore as of June 2025, excluding new mandates
Key Growth Catalysts:
- Delivery of servers built on NVIDIA's Blackwell Architecture for India's Sovereign AI System
- Expanding presence in high-performance computing and AI systems
- Strong relationships with global technology partners
- Beneficiary of the government's Digital India and AI initiatives
Financial Performance Metrics:
- Strong revenue visibility from a large order book
- Improving profit margins due to premium product offerings
- Healthy cash flows supporting future expansion
- Zero debt structure providing financial flexibility
Strategic Outlook:
- Expect continued momentum driven by the AI infrastructure theme
- News-driven volatility possible around order execution updates
- Sector rotation into a technology infrastructure play is expected
- Quarterly results will be the key catalyst for sustained momentum
- India's AI infrastructure buildout is a multi-year opportunity
- The company is well-positioned to capture significant market share
Risk Factors to Monitor:
Technical Risks:
- Overbought conditions may lead to profit-taking
- High volatility expected given the stock's momentum
- Any break below ₹3,000 would signal trend weakness
Fundamental Risks:
- Execution risk on large government orders
- Competition from global players in AI infrastructure
- Technology disruption risks in a rapidly evolving sector
- Dependence on government spending cycles
Market Risks:
- Overall market correction could impact high-beta stocks
- Sector rotation away from technology themes
- Global supply chain disruptions affecting component availability
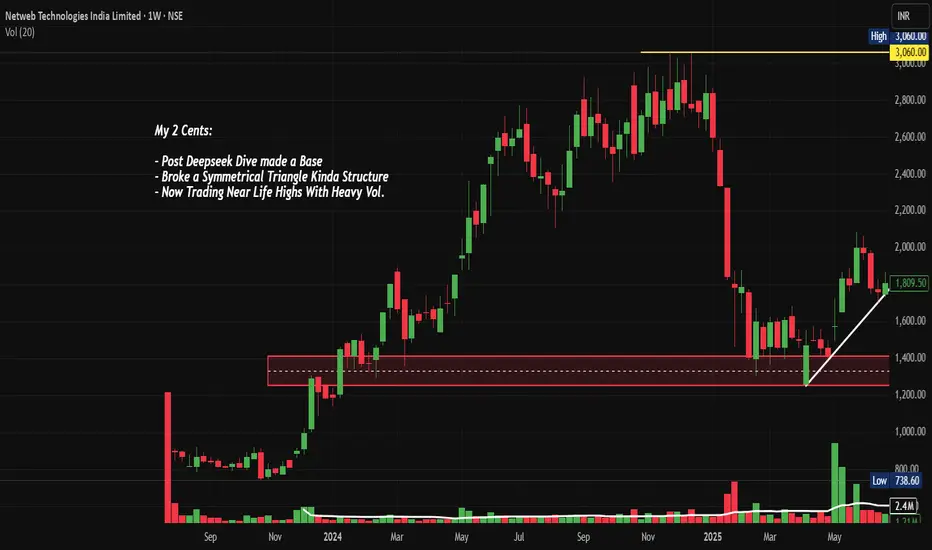
My 2 Cents:
NSE:NETWEB presents a compelling technical setup with strong fundamental support from India's push for AI infrastructure. The stock's breakout from multiple chart patterns, combined with substantial order wins and sector tailwinds, creates an attractive risk-reward proposition. However, position sizing and disciplined risk management remain crucial given the stock's high volatility and premium valuation.
Full Coverage on my Newsletter this Week
Keep in the Watchlist and DOYR.
NO RECO. For Buy/Sell.
📌Thank you for exploring my idea! I hope you found it valuable.
🙏FOLLOW for more
👍BOOST if you found it useful.
✍️COMMENT below with your views.
Meanwhile, check out my other stock ideas on the right side until this trade is activated. I would love your feedback.
As per the Latest SEBI Mandate, this isn't a Trading/Investment RECOMMENDATION nor for Educational Purposes; it is just for Informational purposes only. The chart data used is 3 Months old, as Showing Live Chart Data is not allowed according to the New SEBI Mandate.
Disclaimer: "I am not a SEBI REGISTERED RESEARCH ANALYST AND INVESTMENT ADVISER."
This analysis is intended solely for informational purposes and should not be interpreted as financial advice. It is advisable to consult a qualified financial advisor or conduct thorough research before making investment decisions.
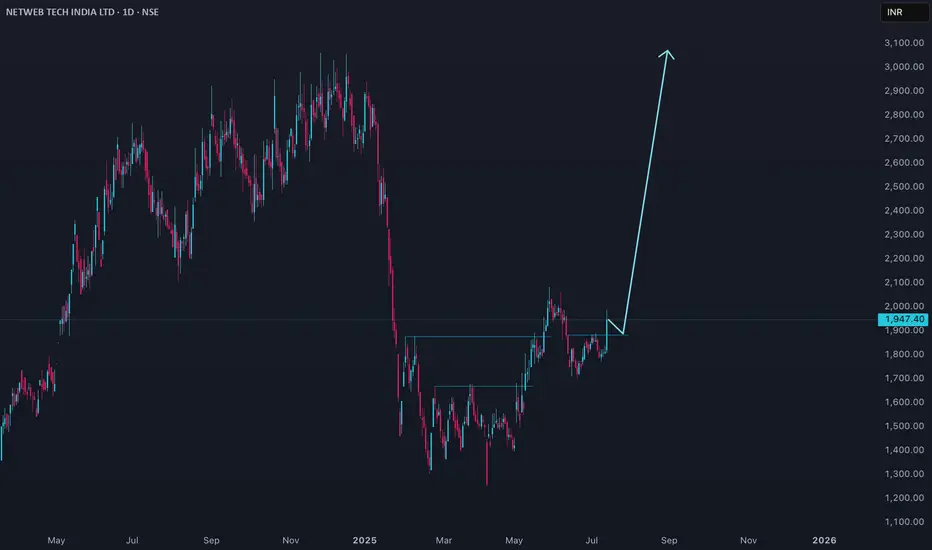
NETWEB Price actionNetweb Technologies (NETWEB) is trading at ₹1,947.40 as of July 11, 2025. The stock has shown a strong short-term recovery, up about 7.4% in the last session and nearly 6.8% over the past week, but it remains down by over 25% in the past six months. The 52-week high is ₹3,060 and the low is ₹1,251.55.
Valuation-wise, NETWEB is trading at a high price-to-earnings ratio (around 90–96) and a price-to-book ratio near 20, indicating a premium valuation. The company’s market capitalization is approximately ₹11,000 crore. Promoter holding has slightly decreased in the recent quarter.
For the near term, technical targets suggest resistance around ₹2,000–2,040 and support in the ₹1,750–1,850 range. Analyst forecasts for the next year place price targets between ₹1,824 and ₹2,805.
Fundamentally, the company is considered overvalued at current levels, despite strong recent profit growth. The stock’s premium valuation and recent volatility suggest caution for new investors, with further upside dependent on continued earnings momentum and broader market sentiment.
Netweb Technologies : Potential Breakout Since the listing of the stock in July 2023, the stock consolidated for some time and the higher high -higher low journey started in the stock from Jan 2024 which lasted till Nov 2024.
A handsome move from 1300 to 3000 levels within a span of 1 year.
The trendline breakdown of this upward journey took place in Jan 2025 resulting in a massive selloff resulting in the stock to correct it almost 75% from its high.
From low in Feb 2025 to Apr 2025, the stock consolidated for almost 3 to 4 months on low volume with a symmetrical triangle formation at bottom.
In may 2025 , there was again a buying interest in the stock with good volumes. May and July 2025 had good breakouts in the stock with reasonable buying interest keeping the price pushing on higher side.
On 08 Sept 2025, the stock covered all its lost ground and just halted above the one year key resistance of 3000 with very good volume reflecting the buying interest in the stock .
If the stock sustains above the level of 3000 for a week or so can further generate the buying interest in the stock.
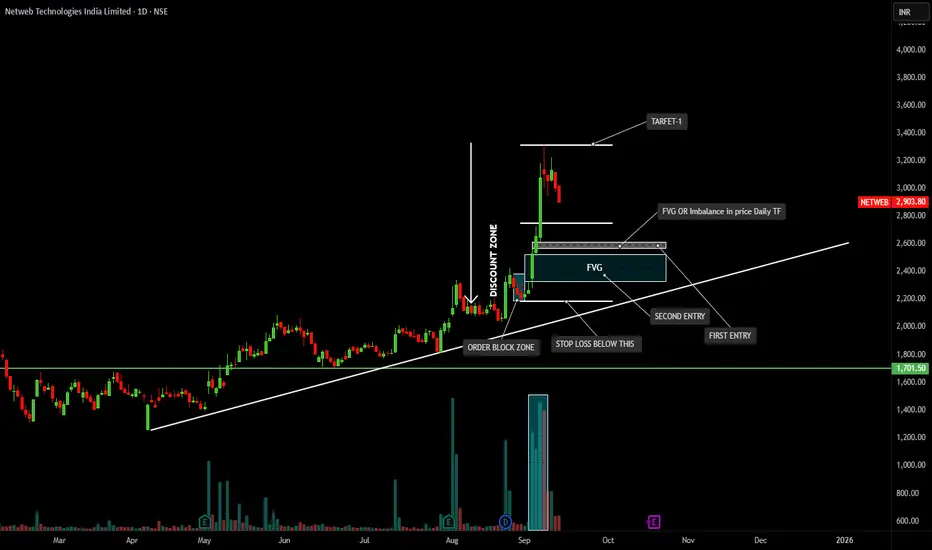
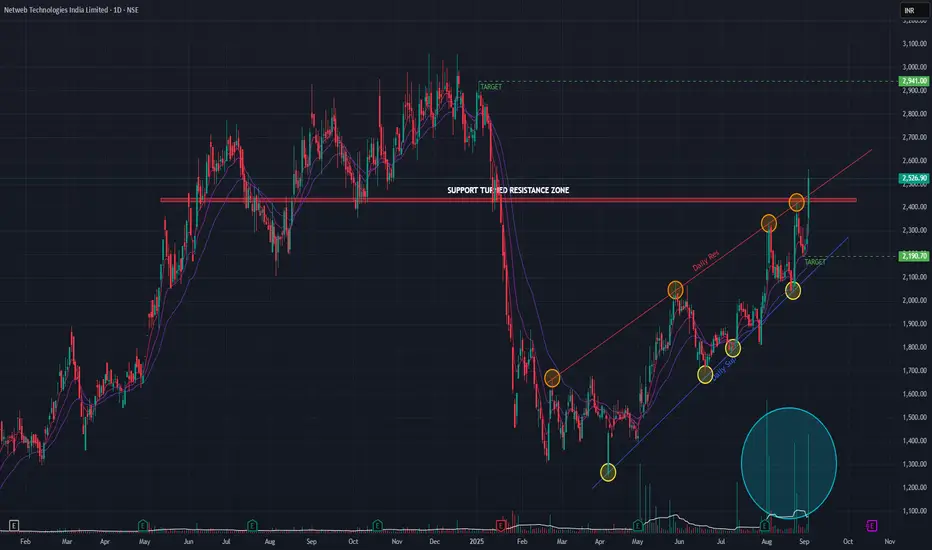
NETWEB TECHNOLOGIES INDIA LIMITEDPrice Action View
Stock had a strong breakout rally recently with heavy volume, creating an imbalance (FVG – Fair Value Gap) in the daily chart.
After the sharp move, price is now retracing downwards into the discount zone & order block area.
🟢 Bullish Points
Clear uptrend structure – higher highs and higher lows.
Strong volume spike confirms institutional interest.
Price is approaching the FVG zone (₹2,200–₹2,400) which can act as a demand zone for a bounce.
🔴 Risk / Bearish Signs
Current correction is sharp (–3.2% today) → showing sellers still active.
If price breaks below ₹2,000, structure weakens and downside towards ₹1,700 support is possible.
🎯 Trading Plan (As per Chart Markings)
First Entry: around ₹2,200–₹2,300 (inside FVG).
Second Entry: if deeper retracement near ₹2,000.
Stop Loss: below order block (~₹1,850–₹1,900).
Target 1: around ₹3,300 (previous high / resistance).
✅ Summary
Stock is in a strong uptrend but currently cooling off after a big rally. Best approach is to wait for retracement into the FVG/Order Block zone and then look for buying opportunities with a stop loss below ₹1,900. If the setup works, upside target remains ₹3,200–₹3,300
NETWEBNETWEB
bullish trend is Showing on the chart.
buy signals in
technical indicators and
cup with handle chart pattern.
Watch for a breakout above 2350-2370 to sustain the bullish trend. If the resistance holds, there could be a retest towards 2000 and an uptrend from here.
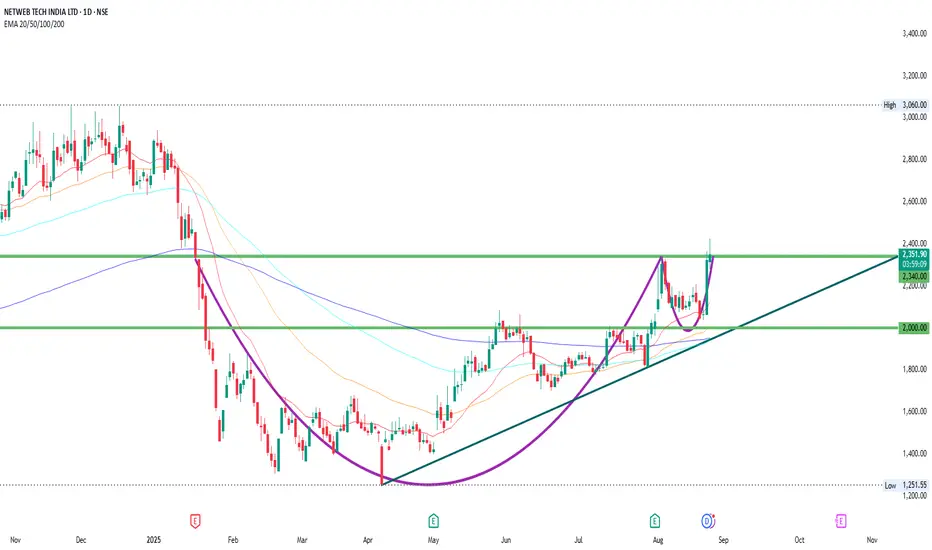
Netweb Tech (Daily Timeframe) - bullish signs ??Netweb has been on an uptrend since Feb 2025 and today it breached a key support turned resistance zone with huge volume. With a +11.48% gain combined with huge volume, the stock also breached the angular resistance trendline as indicated. Short-term EMAs are in positive cross-over state indicating bullish signs.
The recent quarter earnings are also positive for the stock.
If the uptrend momentum continues, then we may see the stock go upto 2940 range. On the downside it may go to 2190 range. The price action on the coming days would be key.
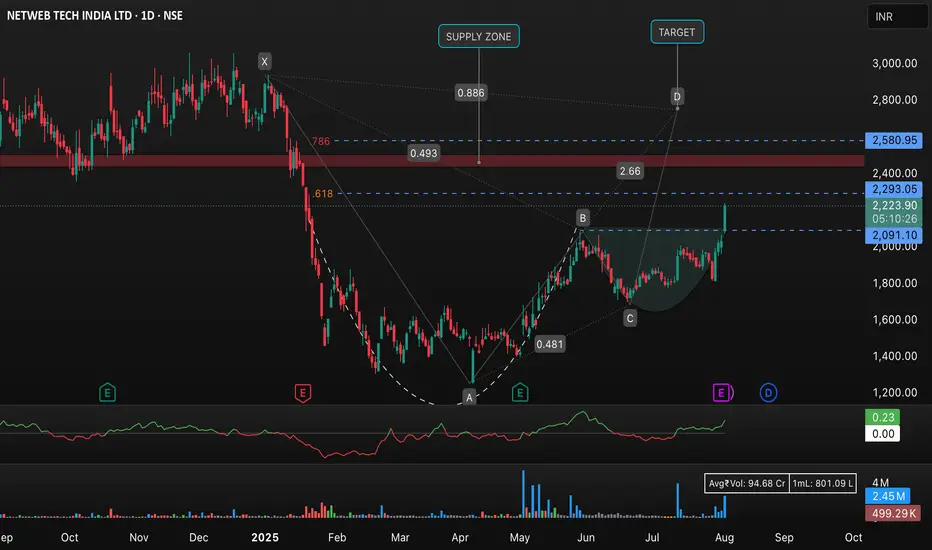
NETWEB TECH INDIA LTD – Cup and Handle Breakout | This chart of NETWEB TECH INDIA LTD (NSE: NETWEB) highlights a notable Cup and Handle pattern formation observed on the daily timeframe. The stock has just broken out above resistance with strong momentum (+9.96%).
• Key Levels:
• Support at 2,091.10 INR
• Immediate resistance/supply zone at 2,293.05–2,580.95 INR
• Target projected around 2,580.95 INR
• Technical Insights:
• Cup and Handle breakout with above-average volume
• Fibonacci retracement and extension levels marked for confirmation
• Potential for bullish continuation if breakout sustains
• Monitor for price action near the supply zone and watch for profit-booking signals
This setup provides a positive risk-reward for swing traders, but always ensure to manage risks and confirm with additional indicators.
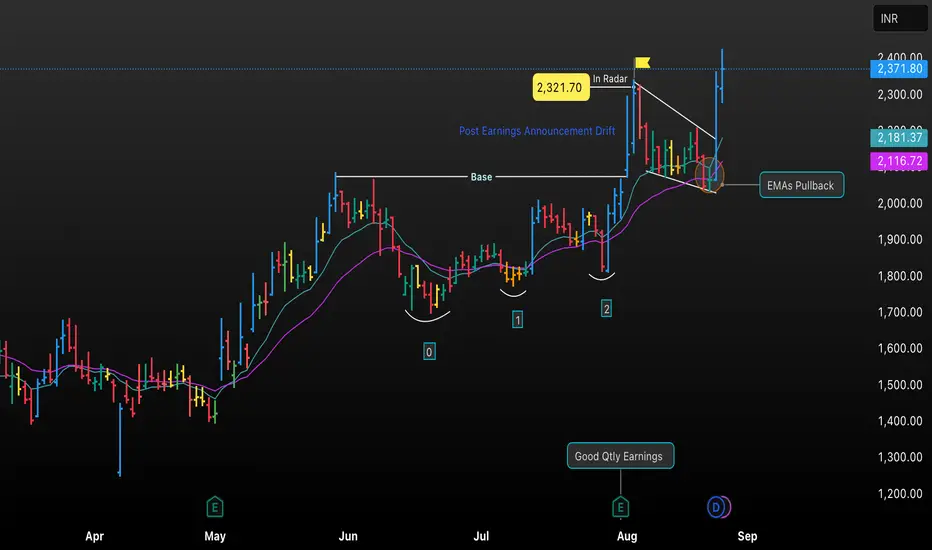
NETWEB Post-Earnings Momentum & EMA Pullback Analysis • This chart analyzes NETWEB’s price movement after a favorable quarterly earnings announcement, highlighting post-earnings drift, the formation of a trend base, and recent EMA pullback.
• Key annotations include buy signals, reaction levels, and actionable price zones to help identify optimal entry and exit opportunities for swing and positional trades.
• Clearly marked support and resistance, along with EMA overlays, provide a transparent ‘radar’ for traders to visualize how earnings and technical patterns interact.
NETWEB Tech India 1 Day ViewIntraday Snapshot as of August 25, 2025:
Current Price: ₹2,353.00
Previous Close: ₹2,322.40
Day’s Range: ₹2,280.60 to ₹2,423.90
Key Refreshers on Today’s Movement:
The stock is trading slightly higher than yesterday’s closing price, signaling a modest intraday gain.
The intra-day high of ₹2,423.90 indicates a strong session, though it hasn't crossed the 52-week high of ₹3,060.
Additional Key Metrics (As of August 25, 2025):
P/E (TTM): ~114.94
P/B Ratio: ~24.8
Indicative of a richly valued stock—priced at a premium compared to industry averages.