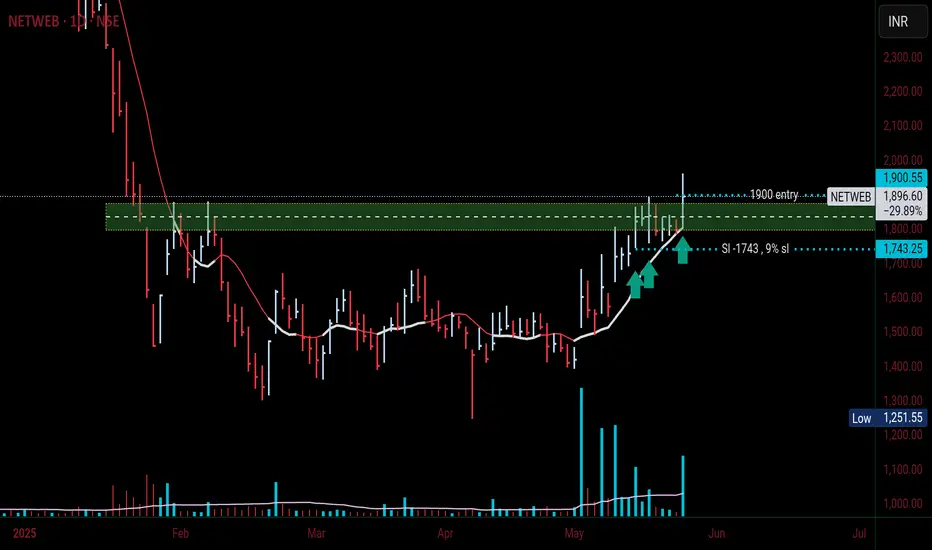
NetwebGood volume ✓
Tight range ✓
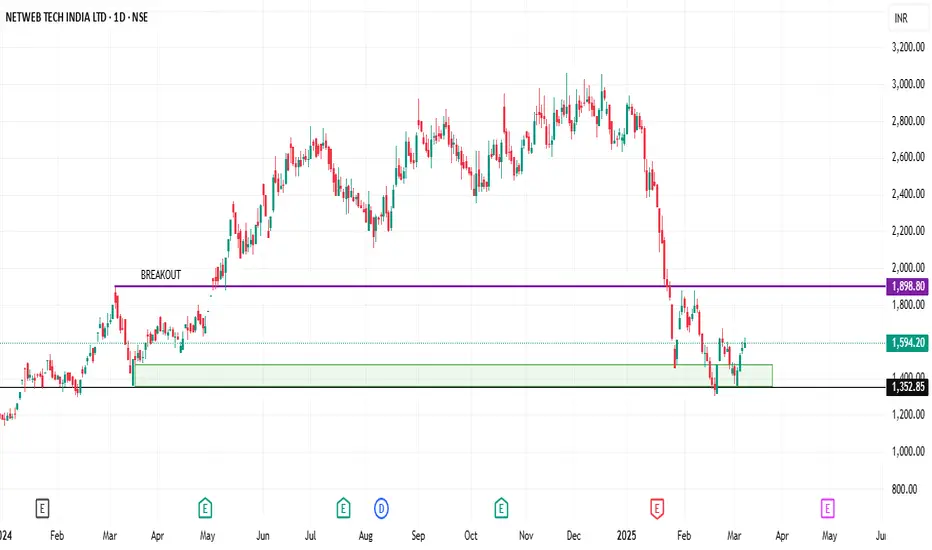
Break out with volume ✓
Previous buyer respected ✓
9 % sl why here put my sl , because previous buyer seen here. Target 20% half book half trailing with sma10
Why i consider this?
- it break out previous resistance
- it respected previous buyer candle
Yah, that it
Trade ideas
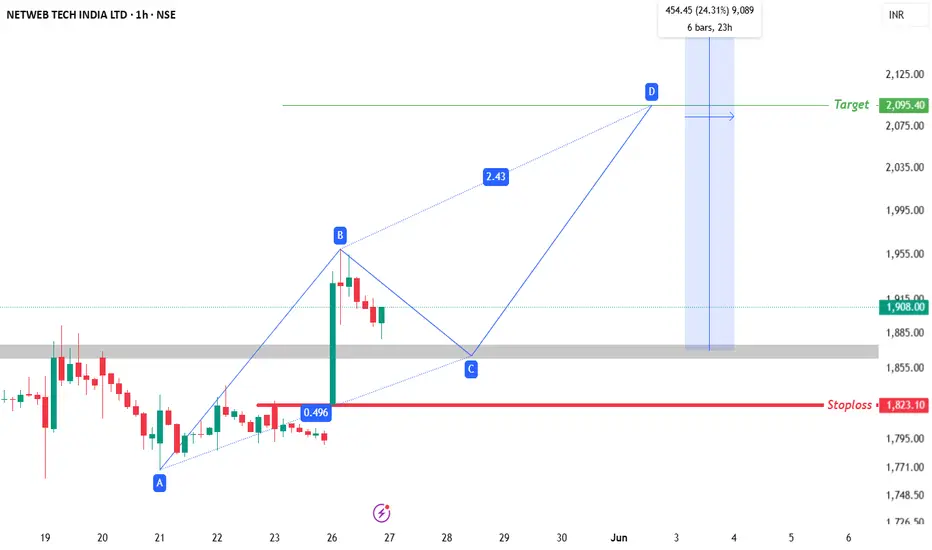
Netweb 📈 Netweb Tech India LTD Trade Setup (1H Chart)
🔹 Pattern: Bullish Harmonic Formation
🔹 Entry Zone: ₹1865 – ₹1880
🔹 Stoploss: ₹1823.10 (Candle Close Basis)
🔹 Target 1: ₹2095.40 🎯
🔹 Target 2: ₹2310+ 🎯 (Only if ₹2095 breakout happens — approx. 24% upside)
💡 Key Insights:
✅ Bullish Harmonic Setup with ideal Risk:Reward
✅ Entry Zone aligns with key demand area (grey zone)
✅ Target 1: ₹2095.40 is the immediate resistance zone
✅ If ₹2095 is broken, stock has potential to rally up to ₹2310 (24% upside from entry)
✅ Price action near Point C zone is critical for confirmation
📌 Stoploss candle close only, Target Trigger Price
📌 This is not a buy/sell recommendation, just an educational trading idea.
📌 Market conditions can change; always conduct your own research.
📌 Understand risks before investing and take full responsibility for decisions.
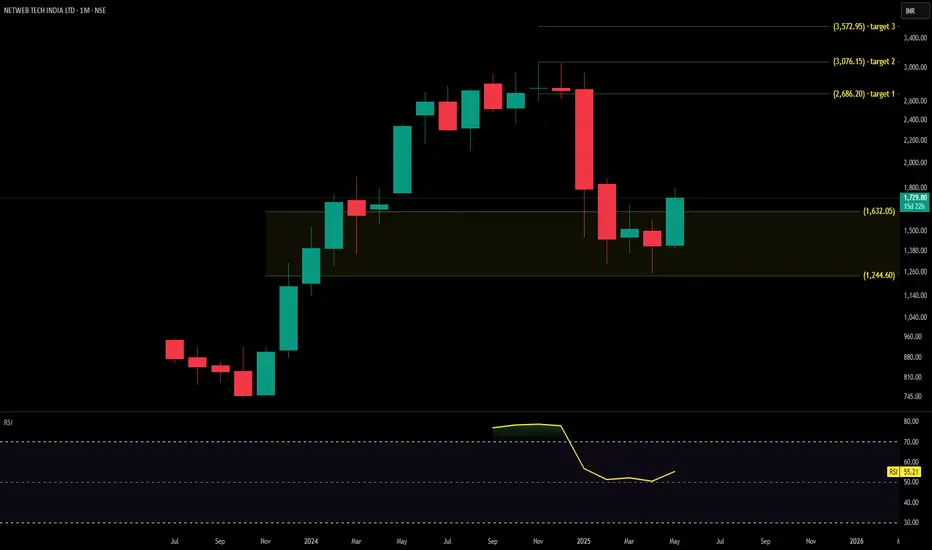
NETWEB TECHNOLOGIES technical analysisNETWEB TECH INDIA LTD (NSE: NETWEB) is currently trading at ₹1,729.80. The company specializes in technology solutions, providing high-performance computing, servers, and data center infrastructure.
Key Levels
Support Level: ₹1,244.60
Swing Level: ₹1,942.40
Possible Upside Levels: ₹2,686.20, ₹3,076.15, ₹3,572.95
Technical Indicators
RSI: The Relative Strength Index (RSI) is currently at 55.21, suggesting neutral momentum. The stock is moving towards the overbought zone but remains in a balanced state.
Volume: The trading volume stands at 17.1M, indicating high investor interest and strong participation in the market. Increased volume often confirms price trends and possible breakouts.
Sector and Market Context
NETWEB TECH operates in the technology and computing solutions sector, which has seen a surge in demand due to digital transformation and cloud adoption. The sector remains highly competitive, influenced by global trends in AI, data centers, and high-performance computing infrastructure. Recent industry updates suggest increasing government support for semiconductor and IT hardware manufacturing, potentially benefiting companies like NETWEB. While the sector is positioned for strong growth, broader market sentiment and macroeconomic factors such as interest rate policies, foreign investment flows, and supply chain constraints can impact stock performance.
Risk Considerations
Market Volatility: The stock may face fluctuations due to broader economic trends and sector movements.
Regulatory Changes: Government policies on data security and technology regulations can impact operations.
Supply Chain Challenges: Any disruptions in the global semiconductor and hardware supply chain could affect product availability and costs.
Competitive Pressure: The industry remains highly competitive, requiring continuous innovation for market positioning.
Analysis Summary
NETWEB TECH INDIA LTD shows strong momentum with significant trading volume confirming investor interest. Key support and swing levels indicate potential price movements, while the RSI suggests a balanced position. The sector outlook remains positive, driven by digital transformation and cloud infrastructure expansion. However, investors should consider economic factors, regulatory policies, and industry competition before making investment decisions.
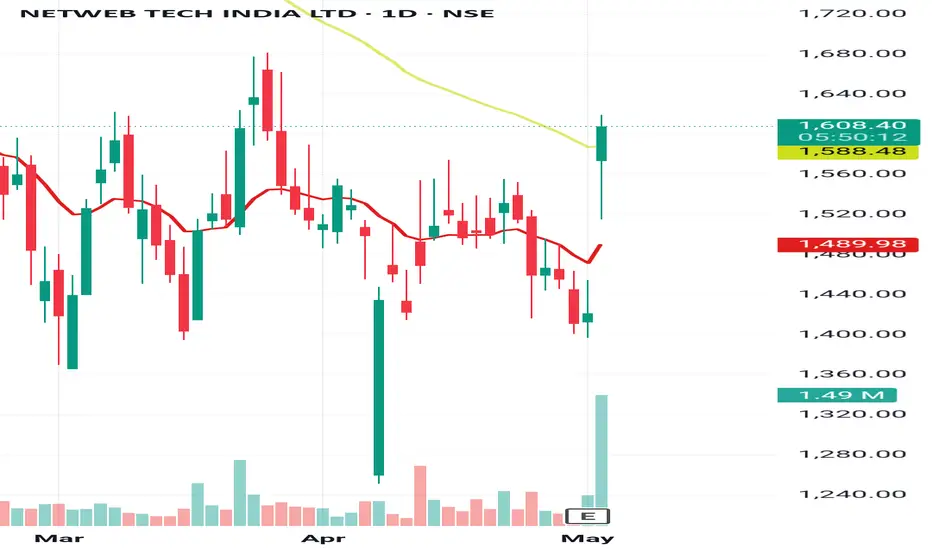
Strategy on netweb technology This stock was announced results above estimated so stock may move northward direction upto 1900 with 6 months time period. Stop loss 1500
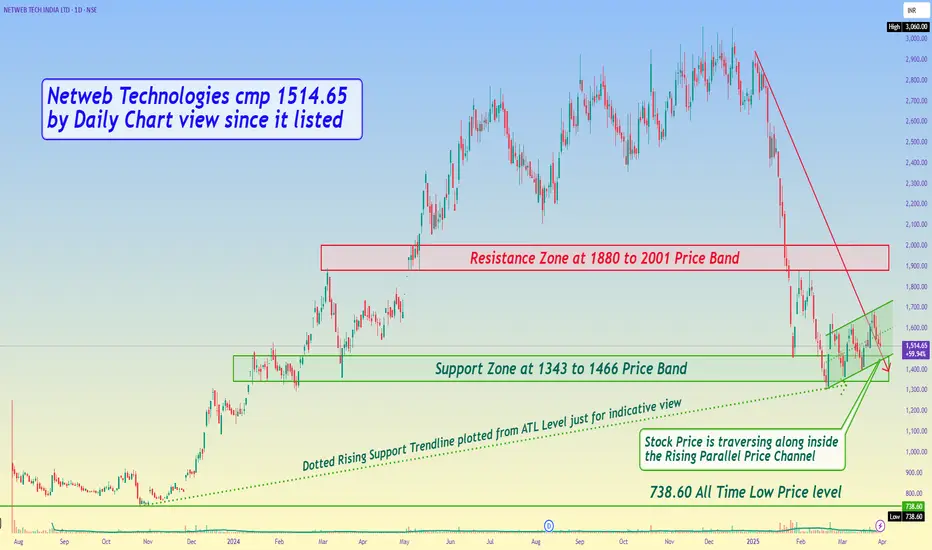
Netweb Technologies cmp 1514.65 by Daily Chart view since it lisNetweb Technologies cmp 1514.65 by Daily Chart view since it listed
- Support Zone at 1343 to 1466 Price Band
- Resistance Zone at 1880 to 2001 Price Band
- Stock Price is traversing along inside the Rising Parallel Price Channel
- Dotted Rising Support Trendline plotted from ATL Level just for indicative view
Netweb Technologies IndiaIncorporated in 1999, Netweb Technologies India (NTI) is one of India‘s leading high-end computing solutions (HCS) providers, with fully integrated design and manufacturing capabilities.
Netweb Technologies offers product and solution suite in designing, developing, implementing and integrating high performance computing solutions. Company develops homegrown compute and storage technologies, deploys supercomputing infrastructure. Three of the company's supercomputers have been listed 11 times in the world's top 500 supercomputers. Company is one of the few OEMs in India eligible to seek incentives in terms of both the IT Hardware PLI and Telecom and Networking PLI schemes.
Business Offerings:-
A) High-performance computing (Supercomputing / HPC) systems
B) Private cloud and hyper-converged infrastructure (HCI)
C) AI systems and enterprise workstations
D) High-performance storage (HPS / Enterprise Storage System) solutions
E) Data centre servers
F) Software and services for its HCS offerings.
BIG FUTURE IN INDIA Data centre servers.


Net Web Tech Growth stock had a excellent run through the year will this support hold? if it holds it will be HL

Netweb, probable breakout 1Da good probability setup in netweb, 1d timeframe.
sellers are getting exhausted 2900 area

NetWebThe chart looks bullish. The resistance is getting tested again and again with higher lows. Once the resistance breaks, the target is marked. The longs can be initiated only if the price stabilizes above the resistance zone.

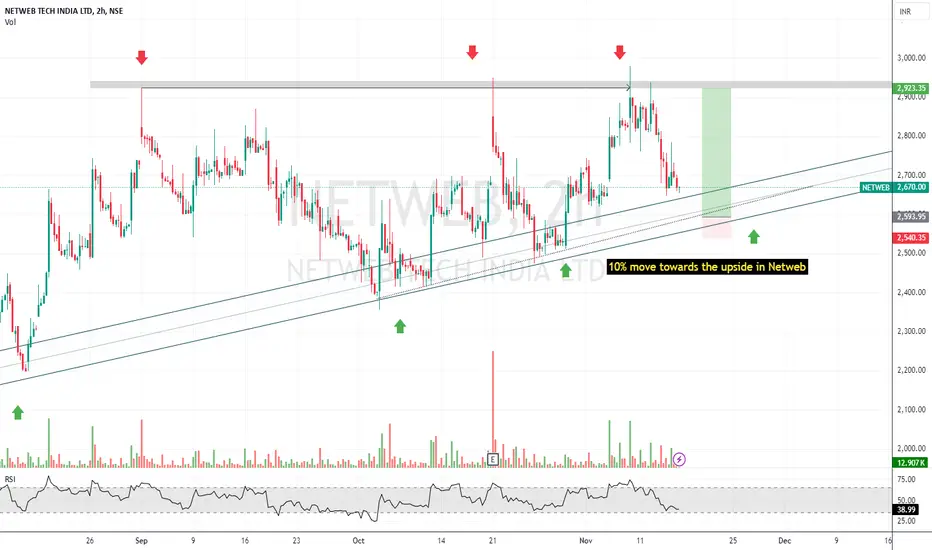
10% Move Left in Netweb towards upsideAs we can see in the charts there is support and the stock is at the support we can take easily long with a minimal stop loss of around 1.5% which will take us to the targets of around 10%
Netweb | Bullish |Netweb appears to be in a strong bullish phase, with the potential to break out if it surpasses the 3,200 resistance. Watching for a decisive move above this level with volume would be ideal for further upside confirmation.
#BullishTrend #BreakoutPotential #Netweb #StockAnalysis #Uptrend #StrongSupport

Turning Bullish: Netweb tech. India Ltd.Netweb tech. India Ltd. is testing the resistance of 2925 levels.
Volume buildup is confirming the bullish trend.
20 EMA is above 50 EMA.
RSI is over 63.
Retesting of the level is done.
The cup and Handle pattern confirms that the upside potential is huge.
It qualifies as a breakout candidate.

Breakout soon in NETWEBAscending Triangle Breakout Setup
RSI above 60 and rising
Trading above EMA50
Volume accumulation
Near to 52wk high
4+ months of consolidation
Good quarterly earnings
Enter after confirmation
Disc: for study, not a recommendation

Netweb Technologies - Nearing breakout zone on weekly chartOn weekly chart, Netweb Technologies is nearing its breakout zone.
A cup pattern followed by a base consolidation with higher lows makes it an ideal stock to keep in your watchlist.
Buy zone: 2925-3050
Stop loss: 5-8% basis one's risk management.
Initial target: 3500-3600
Note: Not a buy/sell recommendation. Please consult your financial advisor.

Reversal in NETWEB Ascending Triangle Breakout Setup
Bounce from important support and EMA100
RSI reversal
Trading above EMA50
Volume spurt
Near to 52wk high
Disc: for study, not a recommendation

Netweb Gearing Up for a Breakout: A Technical AnalysisNetweb Technologies has been under the radar lately, with its stock showing price action that could lead to an exciting move. After hitting an all-time high, the stock went into a consolidation phase, but several technical signals suggest it might be preparing for a breakout. Let’s dive deeper into what’s happening and why this stock could be on the verge of a bullish move.
📊 Consolidation with Rising Volume: A Key Signal
One of the standout features during this consolidation period is the increase in volume on rising days. This is a classic signal in technical analysis, where higher volume on bullish bars indicates that buyers are stepping in with conviction. Although Netweb recently tested its resistance level, the stock hasn't broken through yet. However, it’s showing some promising signs that a breakout could be imminent.
Failed Resistance Break : A few days ago, the stock attempted to break through its resistance level but failed, pulling back with relatively low volume. This pullback is a healthy sign as it indicates that sellers aren't as strong, giving bulls another chance to take control.
Small Base Formation Near Resistance : A small base has formed just below the resistance level. When a stock consolidates near resistance, it suggests that buyers are gradually absorbing the selling pressure, often a prelude to a breakout.
No Supply Zone on Daily or Higher Timeframes : Another bullish factor is the absence of a supply zone on the daily and higher timeframes. With no immediate overhead resistance, there’s less to stop the stock from moving higher once it breaks out.
🎯 Trading Plan: Set for a Potential Breakout
If you're planning a trade on this setup, here’s a possible approach. Buying on today’s candle could be a smart move, with at least a 1:2 risk-to-reward ratio in mind. You can ride the rally by trailing your stop-loss, ensuring you lock in gains as the stock moves in your favor. On the downside, if your stop-loss is hit, it’s important to exit the trade and respect your trading plan.
📅 Final Thoughts: A Potential Rally with Low Overhead Resistance
With no visible supply zone on the daily or higher timeframes, Netweb has room to run if it can break through its current resistance level. The combination of rising volume on up days, a small base near resistance, and the absence of selling pressure makes this a stock to watch closely. Whether you're a short-term trader or looking for a medium-term opportunity, this setup offers potential with clear risk management in place.
🚀 "Patience pays. In trading, it's not about predicting, but about waiting for the right setup." 🌟
Lastly, thank you for your support, your likes & comments. Feel free to ask if you have questions.
⚠️ This analysis is purely for educational purposes and is not intended as a trading or investment recommendation. I am not a SEBI registered analyst. Always consult with a professional before making any trading decisions.

NETWEB Good Accumulationit is near trading near ATH.
good accumulation volume between 1800 to CMP. multiple pocket pivot volumes.
down days has very less volume.
cup and handle pattern visible.

Long NetwebAt 52 Week highs
Anantraj sustaining above new highs. same line of work.Cloud Data storage real estate.
At inflection point, it can burst if markets support.
cmp 2711
sl 2550
target 3500

NETWEB Long BreakoutDate : 01-09-2024
-------------------------------------
Breakout (PICK RESEARCH TO OBSERVE)
Netweb Looks Good Above 2801
SL 1720
Target 3522, 4963++
Hold Period : Few Weeks to Months
Reason for Pick : Breakout, Above 20, 50, 200 SMA

VCP Breakout abv 1740.Netweb Technologies India (#NTI) #netweb
It is one of India‘s leading high-end computing solutions (HCS) providers.
Market Cap₹ 9,756 Cr.
ROCE 64.4%
InstHold 17.1%
Growth 3 Years:-
Sales 41%
PAT 129%
VCP Breakout abv 1740.

Symmetrical Triangle Breakout - NETWEB📊 Script: NETWEB
📊 Sector: IT - Software
📊 Industry: Computers - Software - Medium / Small
Key highlights: 💡⚡
📈 Script is giving Symmetrical Triangle Breakout on 18th April but there was no rally todays candle is giving breakout of that little consolidation so we may see some good rally.
📈 Script is trading at upper band of BB.
📈 MACD & Double Moving Averages are giving crossover .
📈 Right now RSI is around 61.
📈 One can go for Swing Trade.
⏱️ C.M.P 📑💰- 1730
🟢 Target 🎯🏆 - 1890
⚠️ Stoploss ☠️🚫 - 1664
⚠️ Important: Always maintain your Risk & Reward Ratio.
✅Like and follow to never miss a new idea!✅
Disclaimer: I am not SEBI Registered Advisor. My posts are purely for training and educational purposes.
Eat🍜 Sleep😴 TradingView📈 Repeat 🔁
Happy learning with trading. Cheers!🥂
