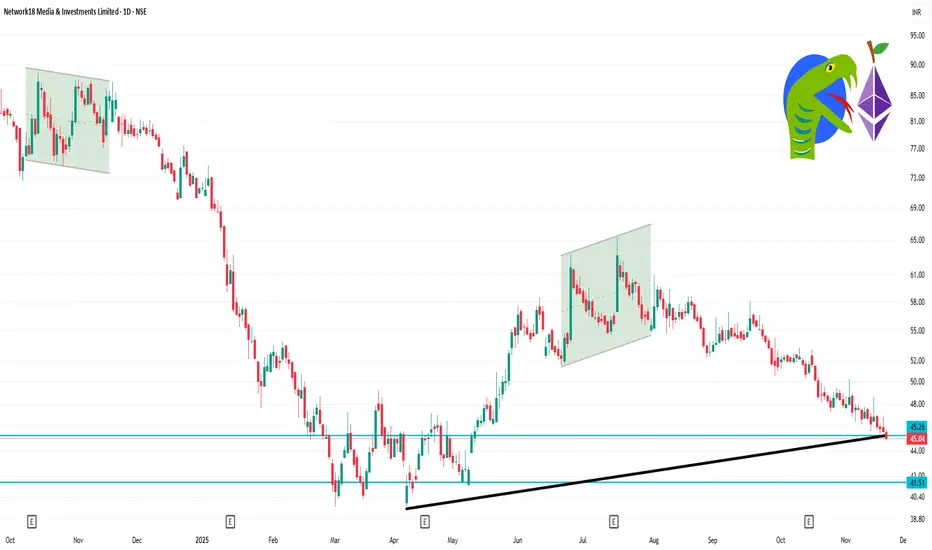
NETWORK18 1 Day Time Frame Current Price: ~ ₹ 45.04.
Day’s Range: ~ ₹ 44.89 (low) to ₹ 45.76 (high)
Key Support Level: Around ₹ 44.50-45.00 — if price breaks below this, further downside may open.
Key Resistance Level: Around ₹ 46.50-47.00 — if price breaks above this with volume, upside potential may resume.
52-week range: Low ~ ₹ 39.66, High ~ ₹ 85.39.
Network18 Media & Investments Limited
No trades
What traders are saying
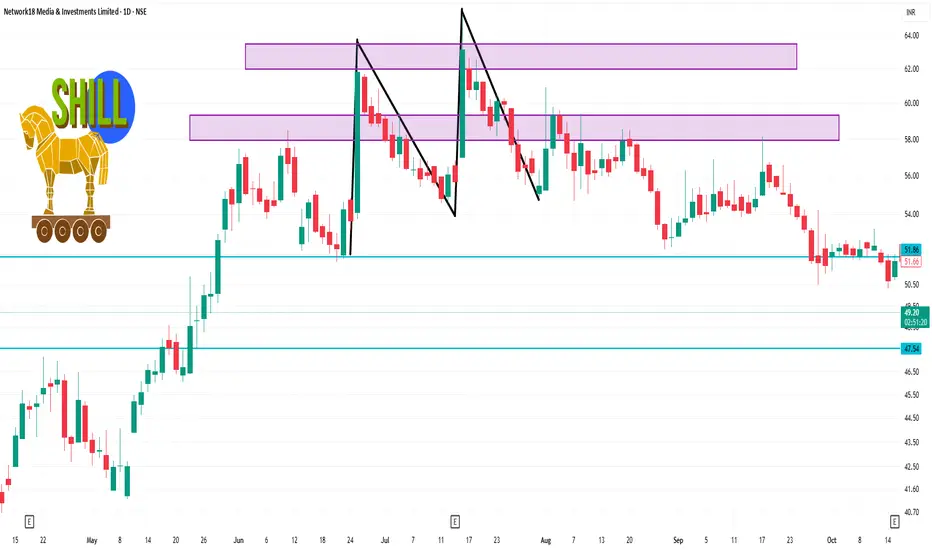
NETWORK18 1 Day Time Frame 📊 Key daily levels to watch
Here are approximate levels based on recent data:
Support: around ₹47.50-₹48.00 region (the near lower band)
Resistance: around ₹50.00-₹52.00 region — a near barrier if the stock tries to bounce.
Pivot/central reference: ~ ₹48.15 (classic pivot) for the day.
📌 Interpretation for a Day Trader
a) If price remains above ~₹48.00 and holds, that level may act as a short-term base.
b) A decisive break above ~₹49.50-₹50.10 with good volume could open a short relief move towards the next resistance zone.
Conversely, a break below ~₹47.50 would signal risk of deeper downside and may invalidate the c) short-term support.
d) Because the trend/indicator setup is weak (daily technicals show “Strong Sell” for daily timeframe), any long trade should be cautious and risk-managed.
Mastering Multi Time Frame Analysis | Swing and Intraday TradingWhether you're a price action trader or rely on indicators, mastering Multi Time Frame (MTF) Analysis can transform your swing and intraday trading decisions. In this video, I break down how to use MTF effectively to align your entries, spot fakeouts, and trade with higher conviction.

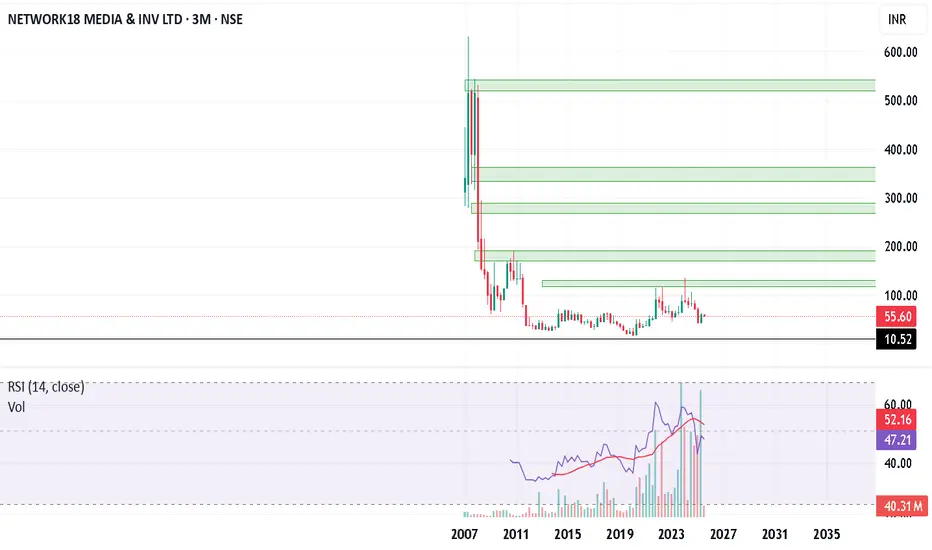
Network18, 3M, Long term Network18 is in long term base formation. With increase in volumes and price momentum, looks good for long term investment.
NETWORK 18 MEDIA & INV LTDAs of May 30, 2025, Network18 Media & Investments Ltd (NSE: NETWORK18) closed at ₹54.54. Over the past week, the stock has shown an upward trend, appreciating approximately 11.76%.
📊 Weekly Support and Resistance Levels
Based on recent price movements and technical analysis, the following are the key support and resistance levels for the upcoming week:
Support Levels:
S1: ₹52.82
S2: ₹50.90
S3: ₹49.15
Resistance Levels:
R1: ₹55.57
R2: ₹56.61
R3: ₹57.78
These levels are derived from pivot point analysis and recent trading ranges.
📈 Technical Overview
Trend: The stock has been in an uptrend over the past week, gaining approximately 11.76%.
Volume: On May 30, 2025, the trading volume was approximately 7.23 million shares, indicating healthy investor interest.
🔍 Key Observations
Price Range: The stock traded between ₹53.16 and ₹55.40 on May 30, 2025.
52-Week Range: The stock's 52-week low is ₹39.55, and the 52-week high is ₹106.01.
✅ Summary
Network18 Media & Investments Ltd is currently exhibiting bullish momentum. Traders should monitor the ₹55.57 resistance level; a breakout above this could signal further upside potential. Conversely, if the stock retraces, it may find support around ₹52.82. As always, it's advisable to consider broader market conditions and conduct thorough research before making trading decisions.

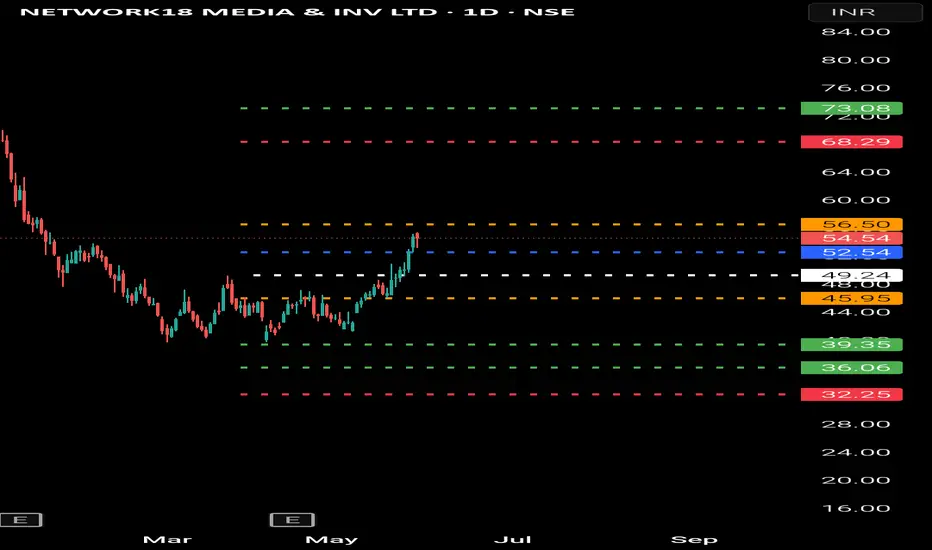
NETWORK18 (Network18 Media & Investments Ltd)- AnalysisBullish Levels -if sustain above 52 (early entry risky) then 57 (safe entry if sustain above this for a week) target can be around 68 to 73 first target, if sustain above for a week or two then we expect more upside and wait for targets around 98 to 101 above this more bullish
Bearish levels :- if sustain below 49 then 45 swing trade exit below this if sustains for 2-3 days then 39 to 36 good support with SL of 32 for long term investors below this more bearish.
**Consider some Points buffer in above levels
Please comment if you wish to see my analysis for any script/stock.
**Disclaimer -
I am not a SEBI registered analyst or advisor. I does not represent or endorse the accuracy or reliability of any information, conversation, or content. Stock trading is inherently risky and the users agree to assume complete and full responsibility for the outcomes of all trading decisions that they make, including but not limited to loss of capital. None of these communications should be construed as an offer to buy or sell securities, nor advice to do so. The users understands and acknowledges that there is a very high risk involved in trading securities. By using this information, the user agrees that use of this information is entirely at their own risk.
Thank you.
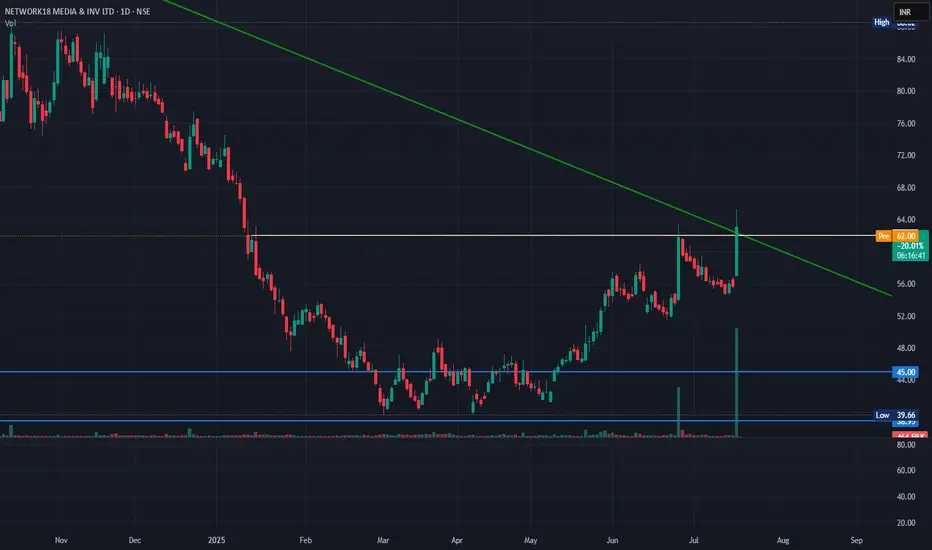
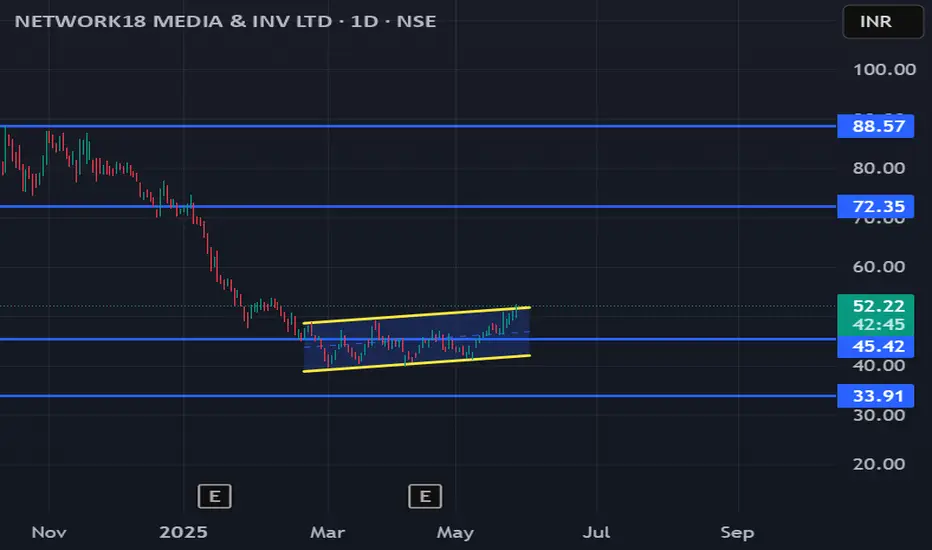
Network18: Eyeing 72 on BreakoutDetails:
Asset: Network18 Media & Investments Ltd.
Breakout Level: 55
Potential Targets: 62, 68, 72
Stop Loss: 50
Timeframe: Short to Medium Term
Rationale:
Network18 is trading near the upper boundary of a descending channel pattern and is showing signs of breaking out above ₹55. Volume buildup and consolidation near resistance indicate strong buying interest.
Market Analysis:
Technical Setup: Channel breakout in progress, supported by increasing volume.
Catalysts: Positive sector momentum and recovery in media & entertainment space.
Risk Management:
Stop Loss: ₹50 to limit downside in case of false breakout.
Capital Allocation: Prefer small-to-medium position due to relatively volatile price action.
Risk-Reward Ratio:
Favourable with an upside potential of ~30% from breakout level.
If sustained above 55, Network18 may witness a strong uptrend towards the ₹72 zone.
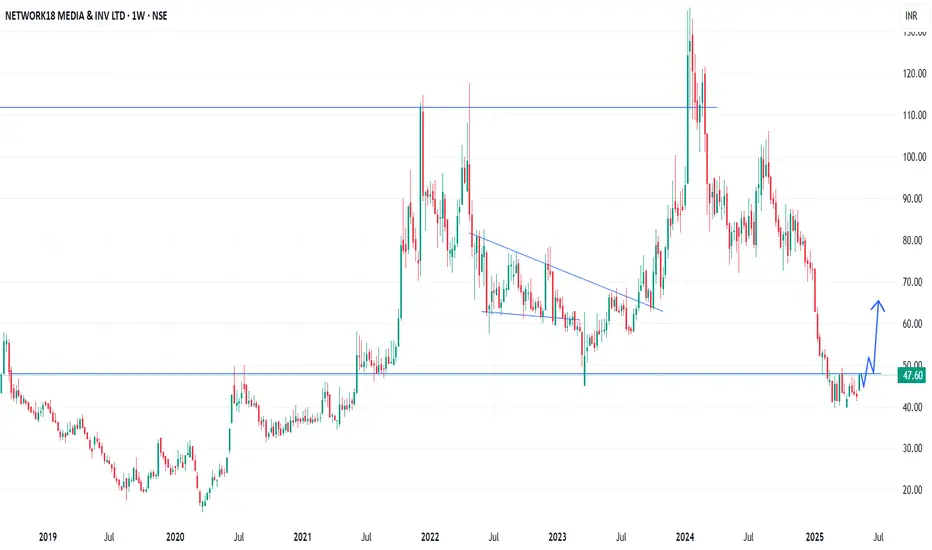
NETWORK18 - Weekly AnalysisIn the Weekly Chart of NETWORK18 ,
we can see that; it is trying to recover from very bottom with W Shape recovery.
Let it create one or two Halt candles to get more strong momentum.
Expected momentum is shown in chart.
Multiyear Breakout With Big Volume In Network18Multiyear Breakout With Big Volume
Buy At Cmp 91.4
SL - 45 ( Monthly Closing Basis )
Target - 200/400
High of 2014 Broken In 2021 & Since Then It's In Consolidation. Now In 2024 Looking For A Good Bullish Move In It.

Network 18 - in a correction modecurrently in the weekly tf network 18 holds strong support at 62 to 60 levels.
price may fall further till these levels if this correction continues.

NETWORK 18 TURNING BULLISH WITH WEEKLY ABCD & SUPERTREND BUYNetwork 18 Media & Investments Ltd. is an interesting chart with following
1. RSI on all time frames almost at or above 60 (DWM)
2. Price Gaining Momentum with rising volumes
3. After a long consolidation of price between 77-95 zone since March 2024, Price made a breakout from the range last week with volume
4. Super trend on weekly turned positive
5. Narrowing Bollinger Bands on weekly chart and price walking on upper band
6. Cluster of moving averages support in 85-89 zone 20, 50, 100, 200 day simple averages fall within this zone
7. ABCD Pattern under formation on weekly chart
Can be a Good Risk reward to buy on dips and dips only
Lets See How it evolves
Disclaimer: NOT A BUY / SELL RECOMMENDATION I am not an expert I just share interesting charts here for educational purpose and not to be taken as buy/sell recommendation. Please seek expert opinion before investing and trading as trading/ investing in market is subject to market risks. I do not hold any position in the stock as on date but I may look to buy on dips with my own Risk Reward matrix.

"Network18: Wedge Pattern on Daily Chart"Network18 is forming a **wedge pattern** on the daily chart, signaling a potential breakout. Key levels to watch:
- **Resistance:** ₹
- **Support:** ₹
A breakout above or below with volume can indicate the next trend. Manage risk with stop-losses near the wedge boundaries.

Potential upmove | Bottom fishing - NETWORK18Checkout an amazing breakout happened in the stock in Weekly timeframe.
IMPORTANT BREAKOUT LEVELS ARE ALWAYS RESPECTED!
NOTE for learners: Place the breakout levels as per the chart shared and track it yourself to get amazed!!
#No complicated chart patterns
#No big big indicators
#No Excel sheet or number magics
Fundamentally it can be due to any major decisions in the management or tremendous performance shown or any such positive actions. Technically, it would have shown an upmove using MA or RSI breakout or any such analysis.
The secret sauce is not revealed here that how I pick my stocks, however the idea is shared as an educational material. This will also help me to keep a track of my accuracy in doing analysis. Hence & also, I request anyone not to take any positions based on the accuracy of my previous feeds or moving forward.
Checkout an amazing breakout happened in the stock in Weekly timeframe. Wait for weekly close above the breakout level.
Breakouts happening in longer timeframe is way more powerful than the breakouts seen in Daily timeframe. You can blindly invest once the weekly candle closes above the breakout line and stay invested forever. Also these stocks breakouts are lifelong predictions, it means technically these breakouts happen giving more returns in the longer runs. Hence, even when the scrip makes a loss of 10% / 20% / 30% / 50%, the stock will regain and turn around. Once they again enter the same breakout level, they will flyyyyyyyyyyyy like a ROCKET if held in the portfolio in the longer run.
Time makes money, GREEDY & EGO will not make money.
Also, magically these breakouts tend to prove that the companies turn around and fundamentally becoming strong. Also the magic happens when more diversification is done in various sectors under various scripts with equal money invested in each N500 scripts.
The real deal is when to purchase and where to purchase the stock. That is where Breakout study comes into play.
LET'S PUMP IN SOME MONEY AND REVOLUTIONIZE THE NATION'S ECONOMY!

Network 18 Watch for a Upside Swing Trade...Network 18 Trade in an upside range. Which support is 70 and resistance is 140.
You should watch upto 140 🎯

BULLISH NETWORK 18!?Network18 operates a wide array of channels under its umbrella, catering to various audiences with different interests. This includes news channels like CNN-News18, CNBC-TV18, and CNBC Awaaz, which provide 24/7 coverage of national and international news, business, and financial markets. Additionally, the group owns entertainment channels like Colors, which has become a household name in Indian television, and digital properties like Moneycontrol, a leading financial news portal.

VIEW ON NETWORK 18Next multibagger stock
Good volume on monthly basis
Stock has not shown any move in this market rally
Target 130/150 and above
Stop loss 75
I am just representing my views
For educational purpose only.

NETWORK18 MEDIA - Swing Trade Analysis - 28th July #stocksNETWORK18 MEDIA (1D TF) - Swing Trade Analysis given on 28h July, 2024
Pattern: FALLING WEDGE BREAKOUT
- Weekly Resistance Trendline Breakout - Done ✓
- Weekly Support Consolidation with Volumes buildup - Done ✓
- Strong Pullback from Weekly Support Level - Done ✓
- Demand Zone retest for a Small SL and a better RR - In Progress
* Disclaimer

Network 18 Stock Breaking out of an Accumulation phaseNetwork 18 Stock Breaking out of an Accumulation phase📈
The stock has witnessed an accumulation of nearly 20 weeks and may be a good pick in the short term. It upholds a potential of nearly 40% if confirms a breakout above 96 on weekly chart✅
Entry: Above 96✅
SL: 77❌
TGT 1: 117🔥
TGT 2: 136.31📈
Positional ones may hold till 171📈
Note: Its better to apply a 3 legged entry strategy in this stock as Stoploss is a bit expensive.

Network18 Daily TF analysis for LongTerm
NSE:NETWORK18 has created strong bullish structure LL-LH-HL.
We can re-enter in stock between 79 level with SL of 76.
Major targets levels are highlighted in blue lines.

Network 18 ,M pattern formation M pattern formation in Network 18 chart.
Downtrend may form till trendline
MACD NEGATIVE with
RSI below 40

Network 18 ,M pattern formation M pattern formation in Network 18 chart.
Downtrend may form till trendline
MACD NEGATIVE with
RSI below 40

Network18 Media - Bullish Signals on the Horizon!Attention to all savvy investors! If Network18 Media & Investments Limited has been on your radar, here's why now might be the right time to consider making a move:
Strong Support on 200 EMA: Network18 continues to hold strong on its 200-Day Exponential Moving Average (EMA), a key indicator of long-term stability and a potential platform for growth.
RSI Above 50: Adding to the bullish sentiment, the Relative Strength Index (RSI) for Network18 is currently above 50. This is a crucial indicator that signifies more buyers are entering the market, pushing the momentum towards a positive uptrend.
Why These Indicators Matter: Holding above the 200 EMA suggests underlying strength, while an RSI over 50 typically indicates increasing bullish momentum. Together, these metrics suggest that the stock might be setting up for a potential rise, making it a strong candidate for those looking to capture gains in the media and investment sector.
Investor Action: For those who value technical analysis in their investment strategy, Network18 offers a compelling chart with these signals aligning. It's a promising time to consider this stock as part of a diversified investment portfolio.
Final Thoughts: Always pair technical analysis with due diligence and consider broader market conditions. If you’re bullish on the media sector and seek a stock showing strong technical support, Network18 might just be your next smart move.
#InvestmentOpportunity #Network18 #StockMarket #FinancialWisdom #BullishSignals
