NH - STWP Equity Snapshot________________________________________
📊 STWP Equity Snapshot – NH
(Educational | Chart-Based Interpretation)
________________________________________
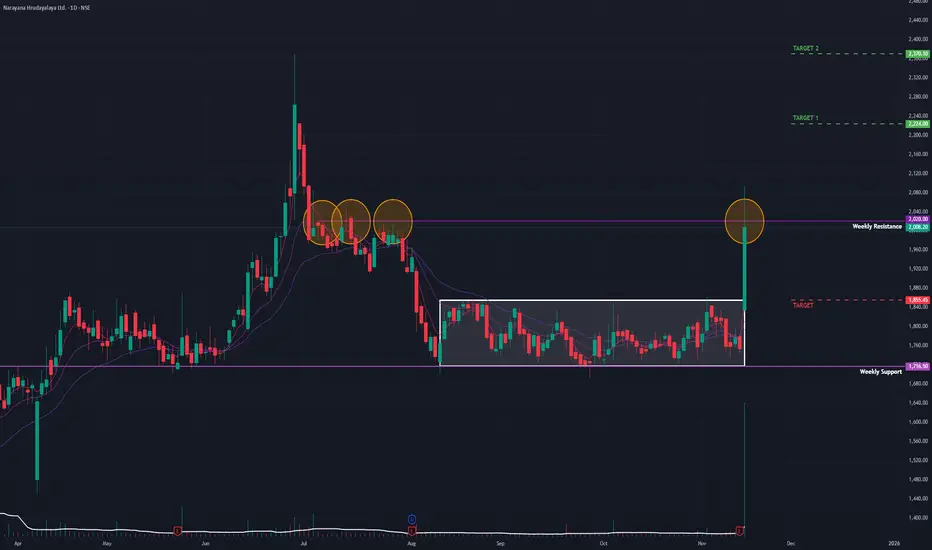
📌 Intraday Reference Levels (Structure-based)
Reference Price Zone: 1950
Risk Reference (If price weakens): 1829
Observed Upside Zones: 2095 → 2192
Narayana Hrudayalaya Ltd.
No trades
Next report date
—
Report period
—
EPS estimate
—
Revenue estimate
—
38.30 INR
7.90 B INR
54.83 B INR
69.17 M
About Narayana Hrudayalaya Ltd.
Sector
Industry
CEO
Emmanuel Rupert
Website
Headquarters
Bangalore
Founded
2000
IPO date
Jan 6, 2016
Identifiers
2
ISIN INE410P01011
Narayana Hrudayalaya Ltd. engages in the provision of medical and health care services. It also provides services in the areas of cardiac surgery, cardiology, diabetes and endocrinology, gastroenterology, general surgery, neurosciences, facial surgery, nephrology, obstetrics and gynecology, orthopedics, oncology, pediatrics, transplant, urology, and vascular surgery; and other specialty services, such as dental, dermatology, emergency medicine, ears, nose, and throat, family medicine, general medicine, and genetic. The company was founded by Devi Prasad Shetty on July 19, 2000 and is headquartered in Bangalore, India.
Related stocks

#NH cancer speciallity wealth creator#NH cancer speciallity wealth creator
ABOVE 1940 FOR 2200/2370 (22%)
SL for traders 1799

Narayana Hrudayalaya (NH) – Weekly Chart Breakout Setup🏥 Narayana Hrudayalaya (NH) – Weekly Chart Breakout Setup
Narayana Hrudayalaya shows a strong bullish recovery on the Weekly timeframe after a consolidation phase, supported by high volume and momentum reversal. The price action is now moving toward a retest of the All-Time High (ATH).
🔑 Key Techn

#NARAYANAHARDULA #NH #TECHNICALANALYSISCASH STOCK BEST PICK
SHORT-SWING-LONG
#NH
Buy 1795.65 - 1905
Target 1 - 2200-2300 short
Target 2 - 2600-2700 swing
Target 3 - 3100-3300 long 1
Target 4 - 4100-4300 long 2
Narayana Hrudayalaya presents a compelling long-term investment case based on strong fundamentals and a vast market

Narayana Hrudayalaya (D): Earnings-Driven BreakoutThe stock has decisively broken out of a 3-month consolidation phase. This technical breakout is powered by a strong fundamental catalyst (Q2 earnings), validating the surge and the high volume.
🚀 1. The Fundamental Catalyst (The "Why")
The breakout is a direct reaction to the company's Q2 FY26
Narayana Hrudayalaya Ltd. (NH)Narayana Hrudayalaya Ltd. has experienced a recent decline in stock momentum, primarily due to short-term challenges despite its strong long-term performance.
Recent Stock Price Declines:
As of August 8, 2025, the stock price was Rs 1,734, down 2.42% for the day and 10.77% over the past week, in

Narayana Hrudayalaya Ltd Price ActionNarayana Hrudayalaya Ltd (NH) is trading around ₹1,946 as of August 1, 2025, after hitting a record high of ₹2,370 in late June. The stock has gained over 53% in the past year and about 44% in the last six months, showing strong long-term momentum, though it has corrected nearly 10% over the previou

Buy on Dips Narayana Hrudayalaya NSE:NH has a beautiful structure on the Daily timeframe it saw Good Volumes around the marked Key Levels which were previously All-Time highs around last year it broke out today and made a new ATH after a year.
Technically above all Moving Averages and RSI and MACD show an Uptrend.
About:
NSE:

Narayana Hrudayalaya Ltd.(NH)The Business Model is very important for investors to assess a company's growth, profitability, and potential for long-term success. let's we talk about the "Narayana" Business Model.
Narayana Hrudayalaya Ltd. operates a scalable and cost-efficient healthcare delivery model focused on providing hig

a consolidation phase (flag)🟢 Trend:
Primary Trend: Strong uptrend since mid-2023.
Price is making higher highs and higher lows with strong bullish candles.
Weekly close at ₹1,913, near its all-time high zone.
🔷 Chart Pattern:
Bullish Flag / Range Breakout Formation:
After a strong rally from ₹1,300 to ₹1,900, price entere

See all ideas
Summarizing what the indicators are suggesting.
Neutral
SellBuy
Strong sellStrong buy
Strong sellSellNeutralBuyStrong buy
Neutral
SellBuy
Strong sellStrong buy
Strong sellSellNeutralBuyStrong buy
Neutral
SellBuy
Strong sellStrong buy
Strong sellSellNeutralBuyStrong buy
An aggregate view of professional's ratings.
Neutral
SellBuy
Strong sellStrong buy
Strong sellSellNeutralBuyStrong buy
Neutral
SellBuy
Strong sellStrong buy
Strong sellSellNeutralBuyStrong buy
Neutral
SellBuy
Strong sellStrong buy
Strong sellSellNeutralBuyStrong buy
Displays a symbol's price movements over previous years to identify recurring trends.
840NHL30
Narayana Hrudayalaya Limited 8.4% 15-FEB-2030Yield to maturity
—
Maturity date
Feb 15, 2030
825NHL29
Narayana Hrudayalaya Limited 8.25% 19-MAR-2029Yield to maturity
—
Maturity date
Mar 19, 2029
See all NH bonds
SMALLCAP
Mirae Asset Nifty Smallcap 250 Momentum Quality 100 ETF Units Exchange Traded FundWeight
1.79%
Market value
1.49 M
USD
Explore more ETFs
Frequently Asked Questions
The current price of NH is 1,819.80 INR — it has decreased by −2.42% in the past 24 hours. Watch Narayana Hrudayalaya Ltd. stock price performance more closely on the chart.
Depending on the exchange, the stock ticker may vary. For instance, on NSE exchange Narayana Hrudayalaya Ltd. stocks are traded under the ticker NH.
NH stock has risen by 5.80% compared to the previous week, the month change is a −2.94% fall, over the last year Narayana Hrudayalaya Ltd. has showed a 30.55% increase.
We've gathered analysts' opinions on Narayana Hrudayalaya Ltd. future price: according to them, NH price has a max estimate of 2,520.00 INR and a min estimate of 1,575.00 INR. Watch NH chart and read a more detailed Narayana Hrudayalaya Ltd. stock forecast: see what analysts think of Narayana Hrudayalaya Ltd. and suggest that you do with its stocks.
NH stock is 3.22% volatile and has beta coefficient of 1.20. Track Narayana Hrudayalaya Ltd. stock price on the chart and check out the list of the most volatile stocks — is Narayana Hrudayalaya Ltd. there?
Today Narayana Hrudayalaya Ltd. has the market capitalization of 372.12 B, it has decreased by −0.62% over the last week.
Yes, you can track Narayana Hrudayalaya Ltd. financials in yearly and quarterly reports right on TradingView.
Narayana Hrudayalaya Ltd. is going to release the next earnings report on May 15, 2026. Keep track of upcoming events with our Earnings Calendar.
NH net income for the last quarter is 1.27 B INR, while the quarter before that showed 2.58 B INR of net income which accounts for −50.96% change. Track more Narayana Hrudayalaya Ltd. financial stats to get the full picture.
Yes, NH dividends are paid annually. The last dividend per share was 4.50 INR. As of today, Dividend Yield (TTM)% is 0.25%. Tracking Narayana Hrudayalaya Ltd. dividends might help you take more informed decisions.
Narayana Hrudayalaya Ltd. dividend yield was 0.27% in 2024, and payout ratio reached 11.57%. The year before the numbers were 0.31% and 10.29% correspondingly. See high-dividend stocks and find more opportunities for your portfolio.
As of Feb 16, 2026, the company has 14.9 K employees. See our rating of the largest employees — is Narayana Hrudayalaya Ltd. on this list?
EBITDA measures a company's operating performance, its growth signifies an improvement in the efficiency of a company. Narayana Hrudayalaya Ltd. EBITDA is 14.64 B INR, and current EBITDA margin is 23.84%. See more stats in Narayana Hrudayalaya Ltd. financial statements.
Like other stocks, NH shares are traded on stock exchanges, e.g. Nasdaq, Nyse, Euronext, and the easiest way to buy them is through an online stock broker. To do this, you need to open an account and follow a broker's procedures, then start trading. You can trade Narayana Hrudayalaya Ltd. stock right from TradingView charts — choose your broker and connect to your account.
Investing in stocks requires a comprehensive research: you should carefully study all the available data, e.g. company's financials, related news, and its technical analysis. So Narayana Hrudayalaya Ltd. technincal analysis shows the neutral today, and its 1 week rating is buy. Since market conditions are prone to changes, it's worth looking a bit further into the future — according to the 1 month rating Narayana Hrudayalaya Ltd. stock shows the buy signal. See more of Narayana Hrudayalaya Ltd. technicals for a more comprehensive analysis.
If you're still not sure, try looking for inspiration in our curated watchlists.
If you're still not sure, try looking for inspiration in our curated watchlists.