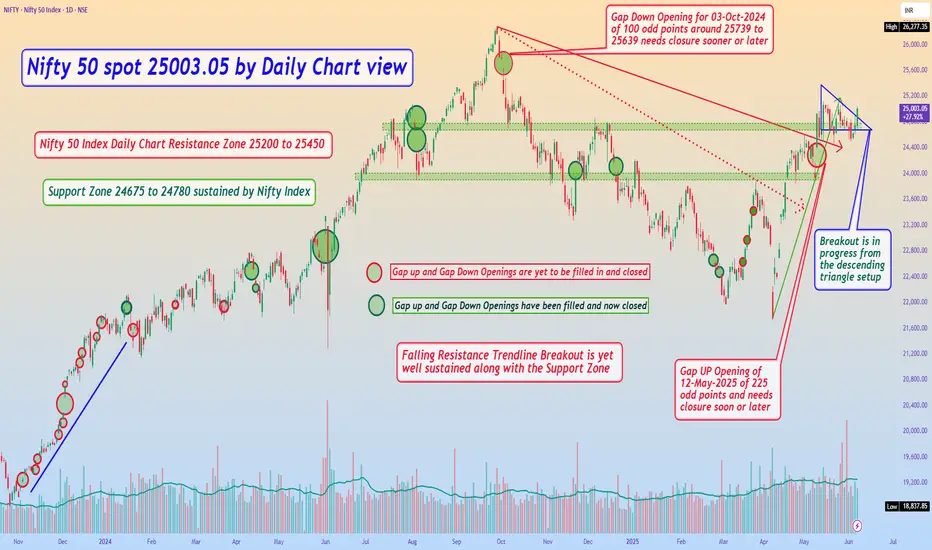
Nifty 50 spot 25003.05 by Daily Chart view - Weekly UpdateNifty 50 spot 25003.05 by Daily Chart view - Weekly Update
- Support Zone 24675 to 24780 sustained by Nifty Index
- Nifty 50 Index Daily Chart Resistance Zone 25200 to 25450
- Breakout seems in progress from the descending triangle setup
- Gap UP Opening of 12-May-2025 of 225 odd points, needs closure sooner or later
- *Nifty 50 Index yet lagging well behind to create a New ATH unlike the Bank Nifty Index*
NIFTY trade ideas
06 Jun 2025 - Nifty reclaims 25000 + RBI cuts repo rate by 0.5%Nifty Stance Bullish ⬆
First of all, a big sorry for not posting in the last 3 months. No, it was not because I wasn't trading; it was because of some other good news. I got a contract to write a new book on "How to learn mutual funds in 30 days," and I was working on that manuscript night and day. I wrote almost 45 chapters, and I hope around 90% of the work is done.
Coming back to Nifty trading, look at the red and green arrows. I have simplified my chart to show only 2 EMAs and the crossovers indicate whether we are long or short. On 28th May, we went with a short trade and yesterday, 5th of June, we went long.
Markets discount everything, and the reason we went long was proven correct today when the RBI Governor made the following changes.
Repo rates cut by 0.5% to 5.5%
Policy stance is now neutral instead of accommodative, which means further rate cuts may be ruled off.
CRR to be cut by 0.25% x 4 times to a total of 1%
The total liquidity infusion is expected to be around 2.5 lakh crores.
This is a phenomenal achievement for the Indian equity markets, as lower repo rates would mean the borrowing is going to get cheaper. For everyone in India, its good news too as the loans become cheaper and small-medium scale business owners feel safer to borrow to expand their businesses.
The issue comes in the Indian debt market and our debt market is not small by any means whatsoever. I guess we are managing close to 2.5+ trillion USD in debt. The real problem is the spread in interest rate of the US fed rate (4.55%) vs our repo rate (5.5%), i.e. 1% gap. No foreigners would be enticed to invest in India as the US market, plus its dollar appreciation capability, reigns supreme. Well, if the US FED cuts its rate further, we may be able to maintain the status quo.
Coming back to our markets, our stance is now bullish, and we will wait for the EMA to cross for a status change.

Nifty's Baby Shower: Will Mother Candle Deliver Before Expiry?👶📉📈
Will Mama Candle Deliver Before Expiry or Hold the Bump?
Hey traders, grab your popcorn (or baby carrots) because the Nifty is hosting a drama worthy of a maternity ward! Let’s break down this prenatal price action without any fancy indicators—just pure candle gossip !
The "Mother Candle" Saga
On May 15th, Nifty formed a MOTHER CANDLE (high: 25116, low: 24500) that’s been “pregnant” with 8 little baby candles. That’s right, 8 days of consolidation, and Mama’s still holding her ground. Will she deliver a explosive breakout before the expiry, or is this a false pregnancy? Let’s diagnose:
Key Levels to Watch (aka The Baby Monitor)
Due Date Resistance: 25116 (Mama’s high). Break this, and we’re naming the firstborn “Rocket Singh” 🚀.
Support Zone: 24500-ish (Mama’s comfy yoga pants zone). Hold here, and the bulls get baby shower confetti.
Critical Breakdown: 24700. Crack this, and it’s a slippery slope to 24500. Close below? Call it a "Failed Pregnancy" :(
The Obstetrician’s Bias (Spoiler: Bullish)
The price action suggests Mama Candle’s still got that pregnancy glow. Bulls are sipping coconut water, waiting for contractions (read: breakout). But if 24700 breaks, the midwives (bears) might rush in with forceps.
Will the Water Break This Week?
Bull Case: Mama holds 24500, pops above 25116, and we’re all godparents to a fresh uptrend. Baby shower theme: “All-Time Highs & Diaper Flys.”
Bear Case: A breakdown to 24500 turns into a ”diaper blowout”—messy, stinky, and nobody’s happy.
Trade Setup: Pack Your Hospital Bag
Long Entry: If Nifty snuggles above 24700 and eyes 25116. Bring tissues for happy tears.
Short Trigger: Close below 24500. Cancel the baby registry and buy bearish pacifiers.
Stop Loss: For bulls, keep it tight below 24500. For bears? Don’t get kicked out of the delivery room.
Final Thought: The expiry clock is ticking louder than a 3 AM baby monitor. Will Mama Candle push this week, or will the 24500 support double as a crib? Either way, keep your charts clean and your risk management tighter than a onesie.
Disclaimer: No actual candles or babies were harmed in this analysis. Trade at your own risk—parenthood (and trading) is unpredictable! 🍼🕯️

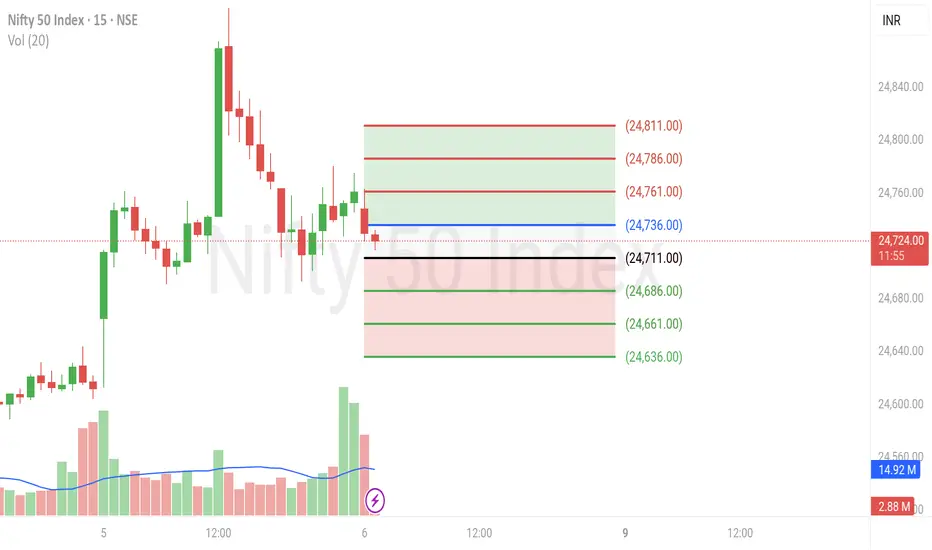
NIFTY 50 Intraday 06 JUN| Breakout or Breakdown Scenario NSE:NIFTY – Key Levels Setup | Breakout or Breakdown Scenario
According to the price action observed at session start , NSE:NIFTY is currently consolidating between the resistance at 24,736 and the support at 24,711 . The structure suggests price is coiling, and a decisive move beyond either level could trigger a directional breakout.
• Key Levels:
Resistance: 24,736
Support: 24,711
• Breakout Scenario:
If price breaks and sustains above 24,736 :
TP1 (1:1): 24,761
TP2 (1:2): 24,786
TP3 (1:3): 24,811
• Breakdown Scenario:
If price breaks and sustains below 24,711 :
TP1 (1:1): 24,686
TP2 (1:2): 24,661
TP3 (1:3): 24,636
"Stay neutral, stay ready. Let the chart pick the direction."
Information and analysis provided is for educational purposes only.
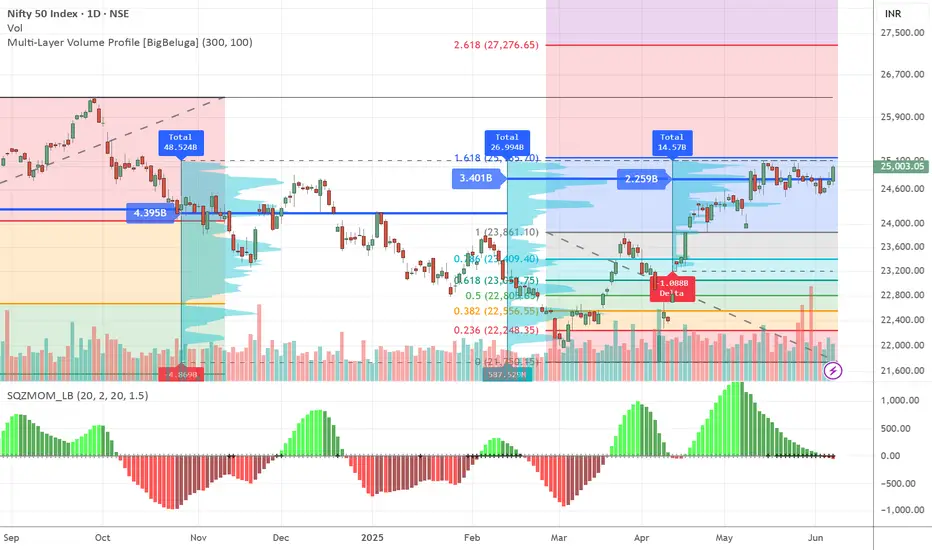
NIFTY ready for 27200 and Beyond!NIFTY Poised for 27,200 and Beyond! 🚀
I’ve always maintained a bullish stance on the Indian markets for the long term, consistently advising investors to buy the dips. Today’s RBI rate cut has further strengthened that conviction.
The surprising strength of the INR amidst global trade tensions gave RBI the room to act decisively — and it did. This rate cut, combined with improving liquidity and macro tailwinds, has added powerful momentum to the NIFTY at 25,000.
From here, a 9–10% upside in NIFTY could translate to an exciting 10–25% rally in Midcap and Smallcap stocks. The risk-reward is skewed in favor of long-term investors.
Stay invested. Add on dips. The journey to 27,200+ has just begun!
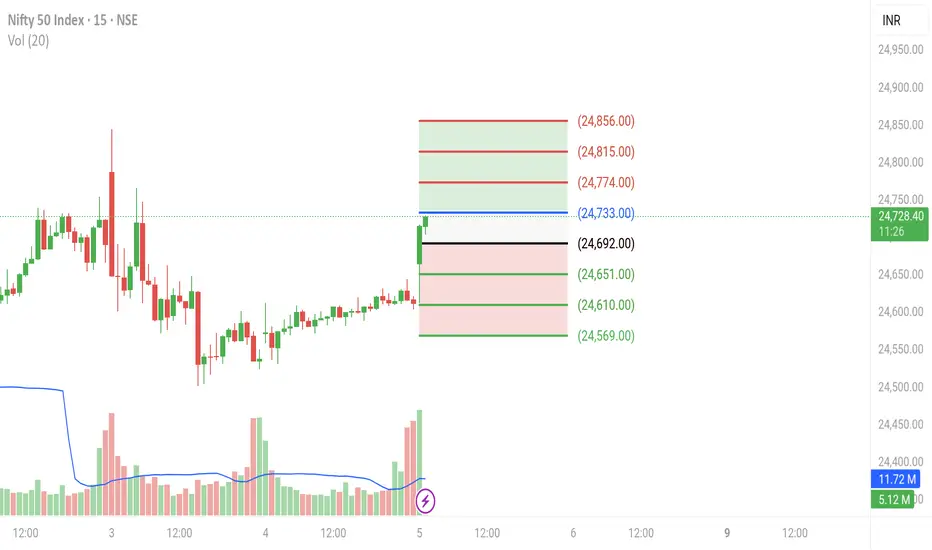
NIFTY 50 Intraday 05 JUN| Breakout or Breakdown Scenario NSE:NIFTY – Key Levels Setup | Breakout or Breakdown Scenario
According to the price action observed at session start , NSE:NIFTY is currently consolidating between the resistance at 24,733 and the support at 24,692 . The structure suggests price is coiling, and a decisive move beyond either level could trigger a directional breakout.
• Key Levels:
Resistance: 24,733
Support: 24,692
• Breakout Scenario:
If price breaks and sustains above 24,733 :
TP1 (1:1): 24,774
TP2 (1:2): 24,815
TP3 (1:3): 24,856
• Breakdown Scenario:
If price breaks and sustains below 24,692 :
TP1 (1:1): 24,651
TP2 (1:2): 24,610
TP3 (1:3): 24,569
"Stay neutral, stay ready. Let the chart pick the direction."
Information and analysis provided is for educational purposes only.
Nifty Intraday Analysis for 06th June 2025NSE:NIFTY
Volatility expected on RBI June’25 MPC Meeting outcome.
Index has resistance near 24900 - 24950 range and if index crosses and sustains above this level then may reach near 25200 – 25250 range.
Nifty has immediate support near 24575 – 24525 range and if this support is broken then index may tank near 24350 – 24300 range.

Class for Advanced Trader part 2To understand how to become a trader, follow these seven steps:
Complete your education. ...
Learning the basics of trading. ...
Determine the product in which you want to trade. ...
Develop trading techniques. ...
Gain trading experience. ...
Understand risk management. ...
Review your trades.

Nifty very positive after Rte cut and CRR cut 25200 important How to take trades using Harmonic pattern projection Trade setup is explained below :-
Entry : 1st SL point : 0% is recent top or bottom.
Trailing D: 15.1% is work as trailing SL of buy or sell trade if hit then we have to book profit
.If price goes below 2nd D 22.5% to 24.5% range then early traders can make fresh reversals trade after breaking 1st D 15.1% safe traders can reversal trade after breaking Point D 22.5.4% to 24.5% range
Targets :
Target T1 : 36.1% to 38.3%
Target T3 : 49.1% to 52.5%
T3: 60.9% to 64.8% is our 3rd Target since this is reversal zone so must book profit if break then take fresh trade again
Target T4 : 76.4% to 79.7%
Next Targets are 100% , 127.2% ,141.4% and final Target 161.8%.
How to take reversal trade :
If price going upside/ downside then then buy or sell levels appear on Chart ( Automatically show when price reach any reversal zone of harmonic projection ).
Trailing SL:
After reach 1st Target trail SL to just above or below cost ( for example we are holding sell trade from 100 1st Target 110 hit then move trailing sl to 104-105 and move SL as price move upside or Downside)
Re- Entry :
For Re-entry in any pull back Point D ( 15.1% ) is used for re-entry then SL recent high or low Point SL ( 0% ) .
Blue Line is 1st support/ Resistance
Green line is 2nd support/ resistance
Red line is 3rd Support/ resistance

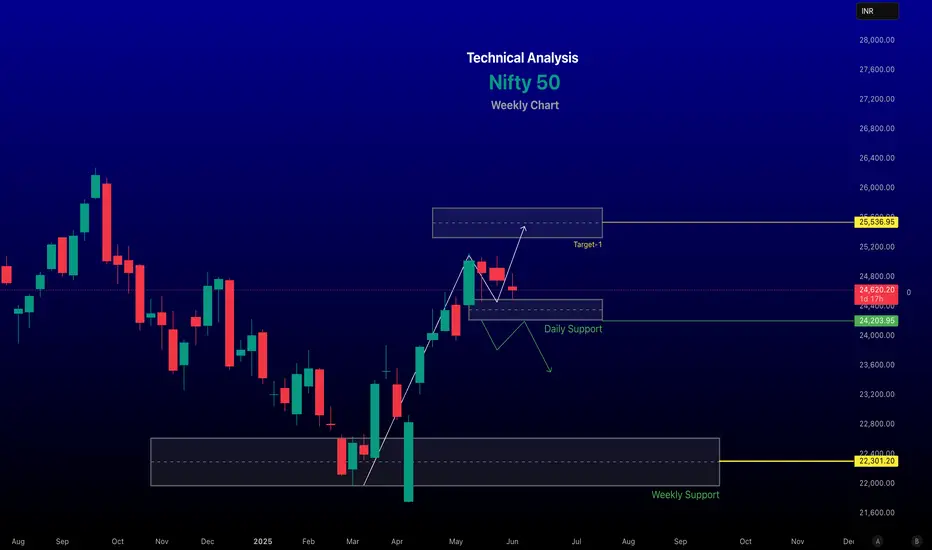
Nifty 50 Weekly Technical Analysis for June 02–06, 2025~~ Technical Analysis ~~
Trend: The Nifty 50 is currently in a Sideways trend. A close above 25800 level could signal a shift to a bullish trend.
#Support and Resistance:
Support: Key levels at 24,552, 24,485, and 24,200 further buying expected near 24,300 if breached.
Resistance: Immediate resistance at 24,666, 24,712, and 24,780. A breakout above 24,900 could push the index toward 25,200–25,600, while a sustained move above 25,050–25,070 may target 25,350–25,600.
Chart Patterns: The Nifty is consolidating within a 24,600–25,050 range, moving within an ascending channel. A bearish candle formed recently, breaching the 20-day EMA, indicating potential weakness unless it holds above 24,300.
Momentum Indicators: The Relative Strength Index (RSI) is mildly bullish at 65.47 for Bank Nifty, but Nifty-specific RSI data suggests consolidation. Oversold conditions (RSI sub-30) have historically signaled potential bottoms or bounces at levels like 23,900–24,100.
-- Disclaimer --
This analysis is based on recent technical data and market sentiment from web sources. It is for informational and educational purposes only and not financial advice. Trading involves high risks, and past performance does not guarantee future results. Always conduct your own research or consult a SEBI-registered advisor before trading.
#Boost and comment will be highly appreciated
NIFTYHello & welcome to this analysis
There is a good chance of the narrow range bound action that we are witnessing in the index to continue probably till the RBI policy, after that it could attempt a break on the upside.
The triangle outlook will be invalid if spot breaks 24525 on the downside.
Broader market specially Mid & Small caps continue to seeing buying.
Regards


Nifty strategy for todayNifty may open on quite note as per SGX nifty. RBI will announce its policy stance at 10a.m today. Majority of analysts and market participants expected 25 basis points rate cut by RBI. IF RBI cut 25 basis points on repo rate the market not impacts much more because it has pricedin already by the market. The much move either side if RBI announced any surprised in the today policy. Should RBI cuts in the repo rata it will 3rd rate cut since April. Repo rate stands at 6% now. Coming to the market the VIX is soften 3% in yestrday trading but it still above the psychological mark i.e.15 which is indicates more uncertainity existing in the market yet now. So investors should trade with strict stop losses on both sides. I am suggested to traders initiate positions after provided growth forecasts by RBI Governor.
Support levels : 24690,24593,24500
Resistance levels : 24900,25040
Disclimer : These recommendations are only for education purpose not for trading purpose, please consult your financial advisor before taking position on my postings.
Pls suggest about my channel to your friends if u like my content


NIFTY Levels for June 6,2025
NIFTY Levels for Today
Here are the today's NIFTY Levels for intraday. Based on market movement, these levels can act as support, resistance or both.
Please consider these levels only if there is movement in index and 15m candle sustains at the given levels.
The SL (Stop loss) for each BUY trade should be the previous RED candle below the given level. Similarly, the SL (Stop loss) for each SELL trade should be the previous GREEN candle above the given level.
Note: This idea and these levels are only for learning and educational purpose.
Your likes /boosts gives us motivation for continued leaning and shar
in.tradingview.com
NIFTY 50 Plan for 06.06.20251. Market is indecisive --> Highly likely that market will remain sideways to cool off the heightened option premiums
2. Expect the market to create a new inside doji today with trading range between yesterday's high and close
3. If any meaningful closing above 24900 followed by the next swing low above 24900, we can expect 25000 - 25100 level.
4. If the above upside doesn't materialize, highly likely that market will become sideways
5. If any meaningful closing below 24600 followed by the next swing high below, 24600, we can expect 24400 - 24300 level
Disclaimer: I am not a registered SEBI Research Analyst nor I am authorized to consult in Stock Market trading matters. I am just sharing my view for fun and learning. Please trade at your own risk.

Nifty trades and targets for - 6/6/25Hello Everyone. The market was in a bearish mode. Its start of new week so SL hunting will happen on both sides before giving a proper move, if you have made good profits yesterday do avoid trading till RBI policy is announced. Its going to be volatile so new traders avoid trading till 12.30. If the market opens flat then we can see continuation of trend. If it opens gap up then we need to see the resistance level to break before looking for CE trades. If it opens gap down then look for PE trades after support zone is broken. Let the market settle in first 15 to 30 minutes then look for directional trades. Book profits every 30 points as we are getting very few trending moves.

Nifty Inverted Head and Shoulder Bullidh Breakout possibleNifty has confirmed an Inverted Head and Shoulder breakout around 22,650, indicating a strong bullish momentum. This classic reversal pattern suggests that buyers are gaining control, and further upside movement is expected.
Trade Setup:
Entry: Above 22,650
Stop Loss: 22,350 (below the right shoulder)
Target: 22,950 (measured move projection)
Technical Analysis:
The neckline breakout with good volume confirms bullish strength.
RSI is showing positive divergence, supporting the uptrend.
If Nifty sustains above the breakout level, we may witness further upward momentum.
Risk Management:
Always follow proper risk-reward management.
Keep position sizing appropriate to your risk appetite.
Avoid over-leveraging.
Disclaimer: This analysis is for educational and informational purposes only and should not be considered financial advice. Trading in the stock market involves risk. Please do your own research and consult a SEBI-registered financial advisor before making any investment decisions.

Nifty Trading Strategy for 06th June 2025📊 NIFTY Intraday Trade Plan – June 6, 2025
🟢 Buy Setup (Bullish Bias)
📌 Entry Condition:
Enter a Buy trade only if the 15-minute candle closes above ₹24,830.
🎯 Targets:
✅ 1st Target: ₹24,865
✅ 2nd Target: ₹24,899
✅ 3rd Target: ₹24,945
🛑 Suggested Stop Loss: Below ₹24,800 or based on your personal risk level.
🔴 Sell Setup (Bearish Bias)
📌 Entry Condition:
Enter a Sell trade only if the 15-minute candle closes below ₹24,670.
🎯 Targets:
✅ 1st Target: ₹24,625
✅ 2nd Target: ₹24,590
✅ 3rd Target: ₹24,565
🛑 Suggested Stop Loss: Above ₹24,700 or as per your risk appetite.
⚙️ Trade Management Tips
⏱️ Wait for candle close confirmation before entering.
🧮 Manage position size carefully based on your capital and risk tolerance.
📉 Avoid trading during major news events unless you are experienced in handling volatility.
⚠️ Disclaimer:
This analysis is shared for educational and informational purposes only. I am not a SEBI registered advisor. All trading involves significant risk. Please consult with your financial advisor before making any investment or trading decision. You are solely responsible for your trades and financial actions.


Well anticipated move!As we can see despite the bearishness, NIFTY showed immense strength as expected and analysed in our previous posts. We had been adamant to our levels and hence every dip was our buying opportunity and also told u guys to make fresh entries for better risk to reward. Now we will stick to our analysis and will keep on buying the dip unless 24400 is broken and sustained below for ATH target.

Nifty View For 06-06-2025Bullish Scenario (Upward Move): If the price breaks above ₹24,895, the next target is around ₹25,039. A breakout retest at the upper green zone is shown as a possible confirmation.
Bearish Scenario (Downward Move): If the price fails to break ₹24,895 and falls below the current range, it may test: First: Middle support zone (~₹24,675). Then: Lower support zone (~₹24,550). If this breaks, a fall toward ₹24,500 or lower is possible.

Nifty gearing up for the big move soon! Today’s candle in NSE:NIFTY is a Squatting Candle.
Such a candle absorbs supply, increases demand, and then absorbs demand too –
It closes far below the high, making people think the market will fall.
Even buyers exit their positions.
This way, it traps both sellers and buyers, and then gives a big, clean move in the direction of the trend.
Stocks where this candle has formed are likely to give a big move – like NSE:VMM
So I clearly say – Market trend is bullish, and we may see a big move in the coming days.
We just need a follow-up move tomorrow to confirm this.
Till then, Nifty levels:
Resistance: 24865 / 24900
Support for tomorrow: 24690
Stop-loss (SL) for all short-term holdings: 24460
Important Note:
Tomorrow is RBI’s meeting and also the last day of the week,
So we can expect a shakeout.
NSE:BANKNIFTY needs attention too because it has very strong momentum.
If 56200 is crossed, we can see a big breakout.
If that happens, keep an eye on all PSU Banks.
Short-term support in BankNifty: 55250
That’s all for today.
Take care. Always use proper Stop-Loss in all your positions.

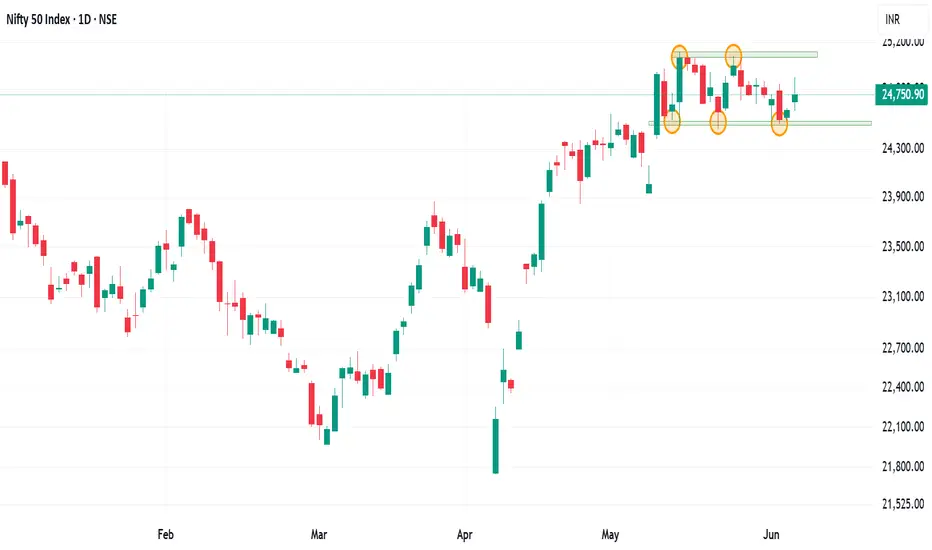
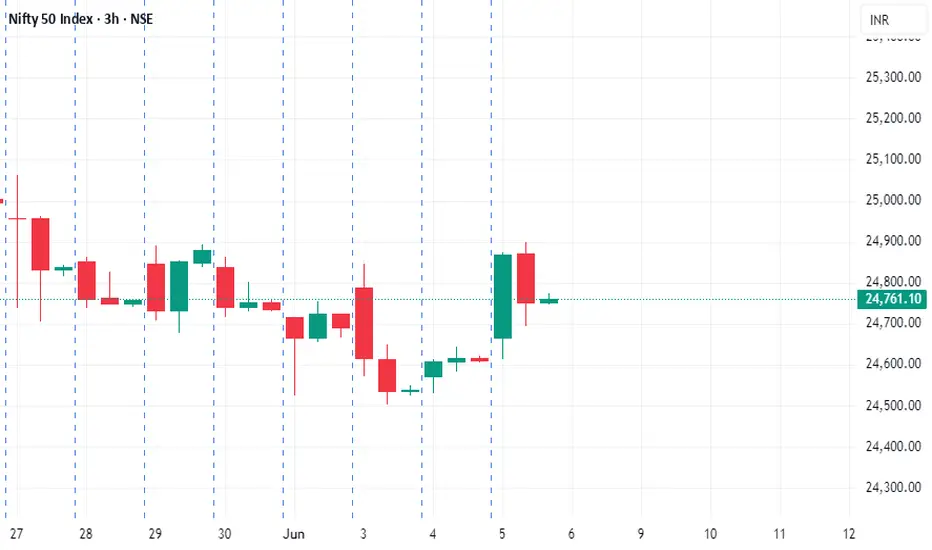
Outlook on nifty 50 for the next week. Is it going trending?Nifty 50 on the daily chart is trading in a range and has respected the zone quite effectively.
Index has remained sideways since a 3.82% move on 12th may. Market trade in cycle and after a sideways cycle, a trending market is predicted.
Either side movement can be seen in the index as 18 bars or 24 days it has remained in the range.
Major Resistance :- 25125, 25500
Major support :- 24500, 23930
This 600 range and change into same range of trending market.
Even the moving averages are coinciding and forming a MA gate which can give good momentum trading setup
Wait for the price action near the price levels before forming a trading basis. Trade only the setup and wait for the retest on either side.