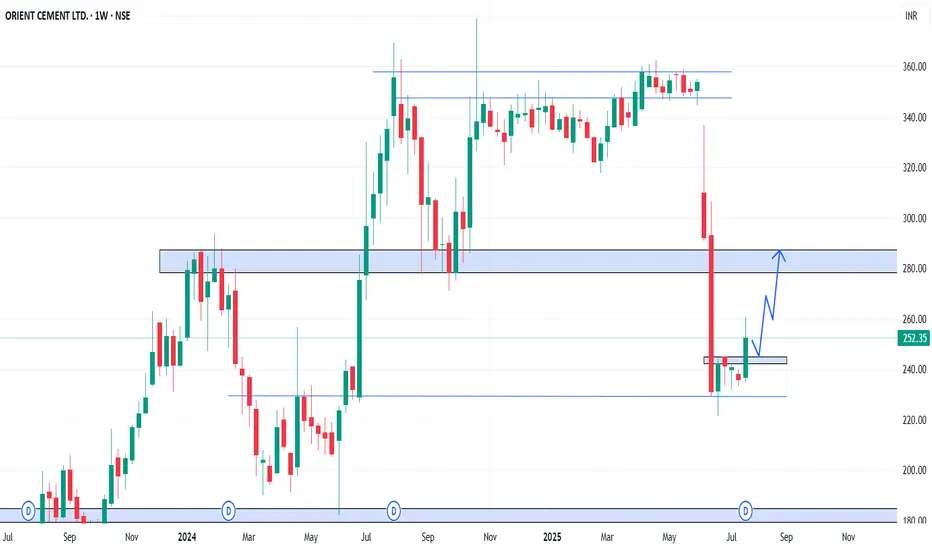
ORIENTCEM - Weekly AnalysisIn the Weekly Chart of ORIENTCEM ,
we can see that, it has given a W pattern breakout from Support Zone.
Let it retest and enter with SL and targets,
Expected momentum is shown in chart.
Orient Cement Ltd.
No trades
Next report date
—
Report period
—
EPS estimate
—
Revenue estimate
—
15.79 INR
912.46 M INR
27.09 B INR
52.65 M
About Orient Cement Ltd.
Sector
Industry
CEO
Vaibhav Dixit
Website
Headquarters
Ahmedabad
Founded
1979
IPO date
Jul 12, 2013
Identifiers
2
ISIN INE876N01018
Orient Cement Ltd. engages in the manufacture and sale of cement. Its products include Birla A1 Strong Crete, Birla A1 Premium Cement-PPC, Birla A1 Premium Cement-OPC 53 Grade and Birla A1 Premium Cement-OPC 43 Grade. The company was founded in 1979 and is headquartered in Ahmedabad, India.
Related stocks
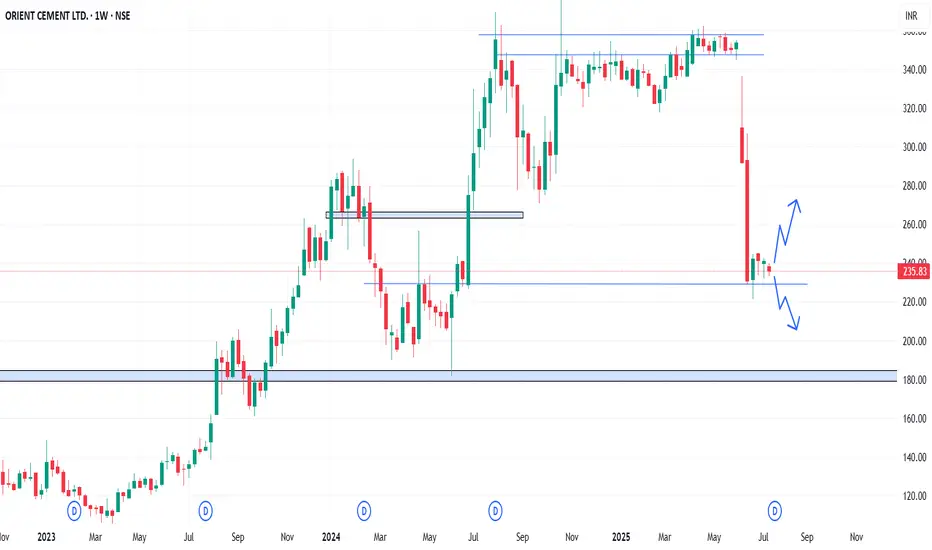
ORIENTCEM - Weekly AnalysisIn the Weekly Chart of ORIENTCEM ,
we can see that, it is at decision making point.
Possible momentums are shown in chart.
Ambuja Cement news can shake up thingsThis is making a great stock pattern on the long-term charts
The Ambuja acquisition news can only sweeten the deal for NSE:ORIENTCEM

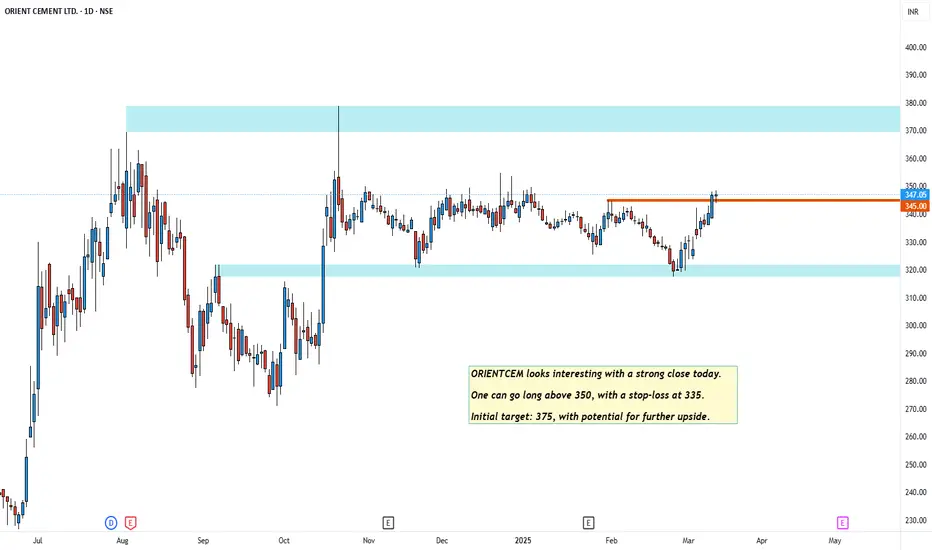
ORIENTCEM ORIENTCEM looks interesting with a strong close today.
One can go long above 350, with a stop-loss at 335.
Initial target: 375, with potential for further upside.
ORIENT CEMENT - Fast Momentum can be expectedPrice analysis & Overview:
1. Liquidity taken from the demand zone.
2. Bouncing from EMA.
3. Good volumes.
4. RRR is favourable.
Trade Plan:
1. ENTRY = Will be best 255, as it is already moved away from entry currently.
2. SL = !0%
3. TP = 1:2,1:3
- Stay tuned for further insights, updates and tr

It can go up Monthly RSI> 60.
As we See in previous posts when RSI crossed above 60 then it go up minimum 20 percentage Max we can't say


5 examples on Breakout vs Fakeout and Ideas for 3 Oct I make educational content videos for swing / positional trading

Orient Cement Open for 360-390-450+Orient Cement Open for 360-390-450+
50% Retracement of last upmove at 275-280
Base formation at 275-280
Strong upmove seen in last 2 days

Possible up move in Orient CementThere was a good up move after rounding bottom and with a slight pullback till the neckline, the stock seems to be moving up. One can buy with a target of 392

See all ideas
Summarizing what the indicators are suggesting.
Neutral
SellBuy
Strong sellStrong buy
Strong sellSellNeutralBuyStrong buy
Neutral
SellBuy
Strong sellStrong buy
Strong sellSellNeutralBuyStrong buy
Neutral
SellBuy
Strong sellStrong buy
Strong sellSellNeutralBuyStrong buy
An aggregate view of professional's ratings.
Neutral
SellBuy
Strong sellStrong buy
Strong sellSellNeutralBuyStrong buy
Neutral
SellBuy
Strong sellStrong buy
Strong sellSellNeutralBuyStrong buy
Neutral
SellBuy
Strong sellStrong buy
Strong sellSellNeutralBuyStrong buy
Displays a symbol's price movements over previous years to identify recurring trends.
Frequently Asked Questions
The current price of ORIENTCEM is 161.70 INR — it has increased by 0.83% in the past 24 hours. Watch Orient Cement Ltd. stock price performance more closely on the chart.
Depending on the exchange, the stock ticker may vary. For instance, on NSE exchange Orient Cement Ltd. stocks are traded under the ticker ORIENTCEM.
ORIENTCEM stock has fallen by −0.22% compared to the previous week, the month change is a −4.64% fall, over the last year Orient Cement Ltd. has showed a −51.66% decrease.
We've gathered analysts' opinions on Orient Cement Ltd. future price: according to them, ORIENTCEM price has a max estimate of 240.00 INR and a min estimate of 174.00 INR. Watch ORIENTCEM chart and read a more detailed Orient Cement Ltd. stock forecast: see what analysts think of Orient Cement Ltd. and suggest that you do with its stocks.
ORIENTCEM reached its all-time high on Oct 22, 2024 with the price of 379.00 INR, and its all-time low was 28.50 INR and was reached on Jul 31, 2013. View more price dynamics on ORIENTCEM chart.
See other stocks reaching their highest and lowest prices.
See other stocks reaching their highest and lowest prices.
ORIENTCEM stock is 2.95% volatile and has beta coefficient of 0.15. Track Orient Cement Ltd. stock price on the chart and check out the list of the most volatile stocks — is Orient Cement Ltd. there?
Today Orient Cement Ltd. has the market capitalization of 32.99 B, it has increased by 3.87% over the last week.
Yes, you can track Orient Cement Ltd. financials in yearly and quarterly reports right on TradingView.
Orient Cement Ltd. is going to release the next earnings report on May 22, 2026. Keep track of upcoming events with our Earnings Calendar.
ORIENTCEM net income for the last quarter is 277.99 M INR, while the quarter before that showed 490.89 M INR of net income which accounts for −43.37% change. Track more Orient Cement Ltd. financial stats to get the full picture.
Yes, ORIENTCEM dividends are paid annually. The last dividend per share was 0.50 INR. As of today, Dividend Yield (TTM)% is 0.31%. Tracking Orient Cement Ltd. dividends might help you take more informed decisions.
Orient Cement Ltd. dividend yield was 0.15% in 2024, and payout ratio reached 11.23%. The year before the numbers were 1.15% and 26.36% correspondingly. See high-dividend stocks and find more opportunities for your portfolio.
As of Feb 16, 2026, the company has 4.42 K employees. See our rating of the largest employees — is Orient Cement Ltd. on this list?
EBITDA measures a company's operating performance, its growth signifies an improvement in the efficiency of a company. Orient Cement Ltd. EBITDA is 5.41 B INR, and current EBITDA margin is 11.50%. See more stats in Orient Cement Ltd. financial statements.
Like other stocks, ORIENTCEM shares are traded on stock exchanges, e.g. Nasdaq, Nyse, Euronext, and the easiest way to buy them is through an online stock broker. To do this, you need to open an account and follow a broker's procedures, then start trading. You can trade Orient Cement Ltd. stock right from TradingView charts — choose your broker and connect to your account.
Investing in stocks requires a comprehensive research: you should carefully study all the available data, e.g. company's financials, related news, and its technical analysis. So Orient Cement Ltd. technincal analysis shows the strong sell today, and its 1 week rating is sell. Since market conditions are prone to changes, it's worth looking a bit further into the future — according to the 1 month rating Orient Cement Ltd. stock shows the sell signal. See more of Orient Cement Ltd. technicals for a more comprehensive analysis.
If you're still not sure, try looking for inspiration in our curated watchlists.
If you're still not sure, try looking for inspiration in our curated watchlists.