BUY TODAY SELL TOMORROW for 5%DON’T HAVE TIME TO MANAGE YOUR TRADES?
- Take BTST trades at 3:25 pm every day
- Try to exit by taking 4-7% profit of each trade
- SL can also be maintained as closing below the low of the breakout candle
Now, why do I prefer BTST over swing trades? The primary reason is that I have observed that 90% of the stocks give most of the movement in just 1-2 days and the rest of the time they either consolidate or fall
Symmetrical Triangle Breakout in OSWALGREEN
BUY TODAY SELL TOMORROW for 5%
OSWALGREEN trade ideas

OSWALGREEN (Oswal Greentech Ltd)- AnalysisBullish Levels -day closing above 54 (early entry risky) then 86 (safe entry if day closing above this) first target is around 118 then 150 and then 184
Bearish levels :- Day closing below 49 SL for swing trade then 21 or 19 strict SL for Long term Investor below this more bearish.
**Consider some Points buffer in above levels
**Disclaimer -
I am not a SEBI registered analyst or advisor. I does not represent or endorse the accuracy or reliability of any information, conversation, or content. Stock trading is inherently risky and the users agree to assume complete and full responsibility for the outcomes of all trading decisions that they make, including but not limited to loss of capital. None of these communications should be construed as an offer to buy or sell securities, nor advice to do so. The users understands and acknowledges that there is a very high risk involved in trading securities. By using this information, the user agrees that use of this information is entirely at their own risk.
Thank you.

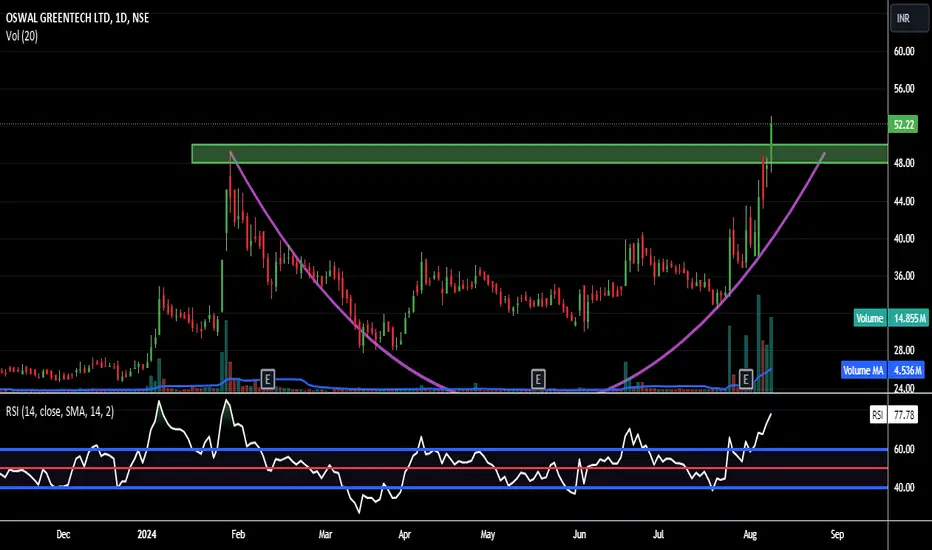
OSWAL GREENTECH LTD (OSWAL) - Cup and Handle PatternCup and Handle Pattern - Bullish Breakout: OSWAL GREENTECH LTD (OSWAL)
OSWAL GREENTECH LTD is showing strong bullish momentum. RSI is in a bullish zone.
- Trading over 21EMA
- Strong Bullish Momentum
- Trading 52 weeks’ High
- Massive Volume Buildup
Disclaimer: This analysis is based on historical data and technical indicators. It does not constitute financial advice. Always consult with a financial advisor before making investment decisions.

Oswal Greentech cmp 48 by Monthly Chart viewOswal Greentech cmp 48 by Monthly Chart view
- Support Zone at 41 to 44 Price Band
- Weekly basis : Support at 35 > 24 > 14 with the Resistance at 55 > 67 > 79
- Multiple Bullish Technical patterns completed, creating huge upside breakout on stock counter
- Rounding Bottoms
- Sliding Head and Shoulders
- Cup and Handle in the past years

OSWAL GREENTECHOSWAL Greentech is ready for upmove but after touching its important level around 34 to 36, so its good buy level at around 34 to 36 with target of 68 within just three months target will hit

Oswal Greentech Ltd. @ 43.96Sector: Finance - Investment
Mid range performer
Stock with medium financial performance with average price momentum and valuation. These stocks may be affordable and are showing some investors interest.
Promoters holding remains unchanged at 64.34% in Jun 2024 qtr.
52 Week High 54.25
52 Week Low 23.15
All Time High 54.25
All Time Low 6.06
Book Value Per Share 96.94
Dividend Yield: --
Sector PE 32.10
Face Value 10
Beta 1.06
Mkt Cap (Rs. Cr.) 1,125
Supports: 27/16/5
Immediate Resistance: 55
Upside can be: 64, 77, 95, 107, 125, 144.
NOTE: Not a BUY or SELL SIGNAL.
All updates are only for the educational and knowledge purpose.

oswal can take pull back price can retrace my points and move upside wait for the price to touch th epoints and then plan your trades

OSWAL GREENTECH BREAKOUT SPOTTEDOSWAL GREENTECH has formed a Rounding Bottom Pattern with Resistance cum Support zone @48 - 50. Today it has given a greakout from this zone. Safe traders can wait for a pull back to enter.
This share ready to go up according to the chart patternThis is very sweet spot to invest like this type of share because they are confirmed Trend change visible here according to the volume according to the chrat pattern according to the trade lines for a steady purpose just look it

#Oswal Green -for green portfolio 🟢🔥🚀#Oswal Green -for green portfolio 🟢🔥🚀
-CMP 37.6
-Triangle breakout in MTF,WTF
-Narrow &inside monthlyCPR
-Volume spurt

OswalGreentech - Consolidation Pitta AgainPitta stocks...Again testing
OswalGreentech - Consolidation
Breakout may be possible in long run, consolidating
