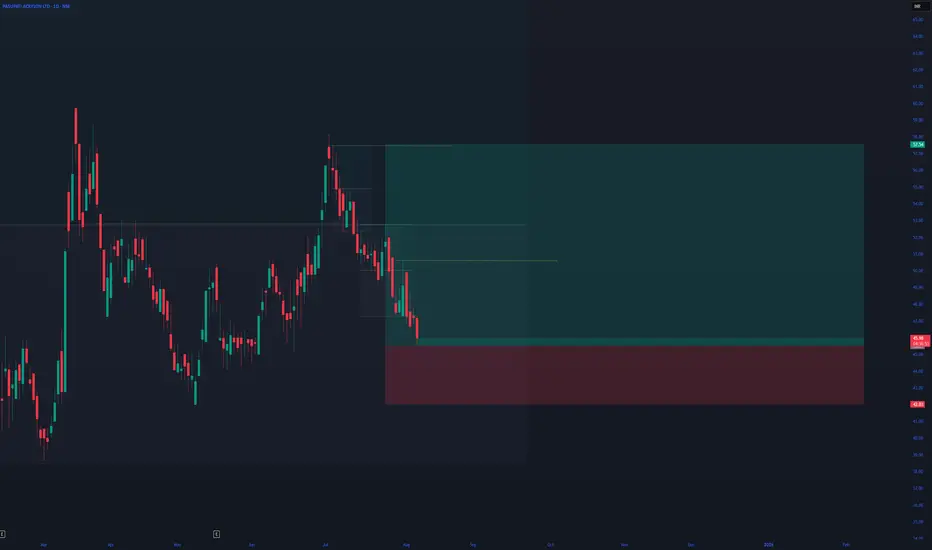
PASUPATI DAY TF ENTRYFirst target 50.60, then the daytime frame wants to close above the 50.60 level, then the next target is 57.54
4.41 INR
353.81 M INR
6.19 B INR
30.42 M
About Pasupati Acrylon Limited
Sector
Industry
CEO
Vineet Jain
Website
Headquarters
New Delhi
Founded
1982
ISIN
INE818B01023
FIGI
BBG000CXLZY5
Pasupati Acrylon Ltd. engages in the manufacturing and marketing of acrylic fiber. Its products include Acrylic Fiber, Tow, Tops, Metalized CPP, Natural CPP, and White CPP. It operates through the following segments: Acrylic Fibre, Cast Polypropylene Films (CPP), and Ethonol segments. The company was founded on October 22, 1982 and is headquartered New Delhi, India.
Related stocks
IPO Base Breakout In Pasuptac - Keep In Radar✅ The stock has finally broken out of its long-term resistance near 54-55 which has acted as a significant ceiling since its IPO. This level marks the upper boundary of its trading range for the past two years and the breakout is a strong signal for further upward movement.
✅ The breakout is accomp

PASUPATI ACRYLON BREAKOUT AFTER 3YEARSThe stock has broken the 3 year old resistance with great volumes and pretty decent pattern , fundamentals of the stock are not quite attractive and are a cause of concern but still with good future prospects and expansion plan company can make an impact
Also the compnay has diversified itself int

Pasupati Acrylon cmp 64.97 by Weekly ChartPasupati Acrylon cmp 64.97 by Weekly Chart
- Support Zone at 53 to 55 Price Band
- Bullish Double Rounding Bottom with neckline at 51 price level
- Price is well above the Falling Resistance Trendline and Way above Rising Support Trendline
- Weekly basis Support seen at 53 > 41 > 30 with the Resist

PASHUPATI ACRYLON LTD(PASHUPTAC)
Elliott Wave Analysis for PASUPTAC (NSE)
Overview
This Elliott Wave analysis highlights the expected price movement of PASUPTAC, illustrating potential future trends using Elliott Wave theory. The analysis identifies key wave patterns, suggesting a bullish outlook with specific price targets

PASUPTAC : Breakout Stock #PASUPTAC #swingtrade #breakout #patterntrading #roundingbottom
PASUPTAC : (1-3 months)
>> Breakout candidate
>> Rounding Bottom Formation
>> Good Trendign stock
>> Good Strength & Volumes
>> Low Risk High Reward Trade
Swing Traders Can lock Profit at 10% & Keep Trailing
If u Like the Analysis,

INVERSE HEAD & SHOULDERS OR CUP & HANDLE PATTERNPASUPATI ACRYLONS has a daily chart CUP & HANDLE PATTERN and a weekly chart INVERSE HEAD & SHOULDERS showing the 47 level has broken with good volume

PASUPATHY ACRYLON:Likely rounding bottom b/outPASUPATHY ACRYLON: After a brief consolidation has formed a nice rounding bottom.Sustaining at 45 levels double bottom pattern/channel break out n long term chart suggests a move towards 50+(For educational purpose only)

PASUPTAC- SG - TRAPS LONG crossed above 100 49PASUPTAC- SG - TRAPS LONG crossed above 100 49
1) Broke trendline
2) ema 49 100 crossed above

PASUPTAC's Chart: Breakout, Retest, Momentum, and DivergenceIn this analysis, we will explore the chart of PASUPTAC, focusing on the breakout of a falling trendline, completion of a retest, gaining momentum, and the breakout of the 100 EMA (Exponential Moving Average). Additionally, we will consider the completion of a divergence on the weekly chart. It's im

See all ideas
Summarizing what the indicators are suggesting.
Oscillators
Neutral
SellBuy
Strong sellStrong buy
Strong sellSellNeutralBuyStrong buy
Oscillators
Neutral
SellBuy
Strong sellStrong buy
Strong sellSellNeutralBuyStrong buy
Summary
Neutral
SellBuy
Strong sellStrong buy
Strong sellSellNeutralBuyStrong buy
Summary
Neutral
SellBuy
Strong sellStrong buy
Strong sellSellNeutralBuyStrong buy
Summary
Neutral
SellBuy
Strong sellStrong buy
Strong sellSellNeutralBuyStrong buy
Moving Averages
Neutral
SellBuy
Strong sellStrong buy
Strong sellSellNeutralBuyStrong buy
Moving Averages
Neutral
SellBuy
Strong sellStrong buy
Strong sellSellNeutralBuyStrong buy
Displays a symbol's price movements over previous years to identify recurring trends.
Frequently Asked Questions
The current price of PASUPTAC is 59.17 INR — it has decreased by −3.13% in the past 24 hours. Watch Pasupati Acrylon Limited stock price performance more closely on the chart.
Depending on the exchange, the stock ticker may vary. For instance, on NSE exchange Pasupati Acrylon Limited stocks are traded under the ticker PASUPTAC.
PASUPTAC stock has risen by 14.43% compared to the previous week, the month change is a −0.55% fall, over the last year Pasupati Acrylon Limited has showed a 42.92% increase.
PASUPTAC reached its all-time high on Sep 11, 2024 with the price of 70.98 INR, and its all-time low was 22.35 INR and was reached on Mar 29, 2023. View more price dynamics on PASUPTAC chart.
See other stocks reaching their highest and lowest prices.
See other stocks reaching their highest and lowest prices.
PASUPTAC stock is 7.75% volatile and has beta coefficient of 0.90. Track Pasupati Acrylon Limited stock price on the chart and check out the list of the most volatile stocks — is Pasupati Acrylon Limited there?
Today Pasupati Acrylon Limited has the market capitalization of 5.47 B, it has increased by 17.27% over the last week.
Yes, you can track Pasupati Acrylon Limited financials in yearly and quarterly reports right on TradingView.
PASUPTAC net income for the last quarter is 162.00 M INR, while the quarter before that showed 17.50 M INR of net income which accounts for 825.71% change. Track more Pasupati Acrylon Limited financial stats to get the full picture.
No, PASUPTAC doesn't pay any dividends to its shareholders. But don't worry, we've prepared a list of high-dividend stocks for you.
As of Dec 3, 2025, the company has 514 employees. See our rating of the largest employees — is Pasupati Acrylon Limited on this list?
EBITDA measures a company's operating performance, its growth signifies an improvement in the efficiency of a company. Pasupati Acrylon Limited EBITDA is 604.20 M INR, and current EBITDA margin is 7.03%. See more stats in Pasupati Acrylon Limited financial statements.
Like other stocks, PASUPTAC shares are traded on stock exchanges, e.g. Nasdaq, Nyse, Euronext, and the easiest way to buy them is through an online stock broker. To do this, you need to open an account and follow a broker's procedures, then start trading. You can trade Pasupati Acrylon Limited stock right from TradingView charts — choose your broker and connect to your account.
Investing in stocks requires a comprehensive research: you should carefully study all the available data, e.g. company's financials, related news, and its technical analysis. So Pasupati Acrylon Limited technincal analysis shows the buy rating today, and its 1 week rating is buy. Since market conditions are prone to changes, it's worth looking a bit further into the future — according to the 1 month rating Pasupati Acrylon Limited stock shows the strong buy signal. See more of Pasupati Acrylon Limited technicals for a more comprehensive analysis.
If you're still not sure, try looking for inspiration in our curated watchlists.
If you're still not sure, try looking for inspiration in our curated watchlists.