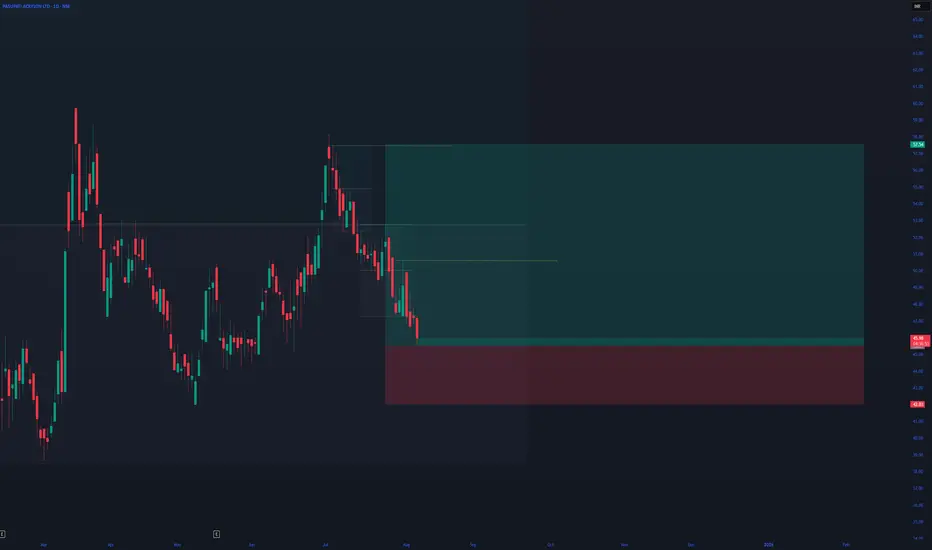
PASUPATI DAY TF ENTRYFirst target 50.60, then the daytime frame wants to close above the 50.60 level, then the next target is 57.54
Trade ideas
IPO Base Breakout In Pasuptac - Keep In Radar✅ The stock has finally broken out of its long-term resistance near 54-55 which has acted as a significant ceiling since its IPO. This level marks the upper boundary of its trading range for the past two years and the breakout is a strong signal for further upward movement.
✅ The breakout is accompanied by a surge in volume indicating strong buying interest. The high volume lends credibility to the breakout reducing the likelihood of a false breakout.
✅The RSI is currently at 72 entering the overbought territory. While this signals strong bullish momentum, traders should be cautious of potential short-term consolidation before the stock continues its upward movement.

PASUPATI ACRYLON BREAKOUT AFTER 3YEARSThe stock has broken the 3 year old resistance with great volumes and pretty decent pattern , fundamentals of the stock are not quite attractive and are a cause of concern but still with good future prospects and expansion plan company can make an impact
Also the compnay has diversified itself into ethanol products
TARGET 4-6 WEEKS - 85
PATTERN - CUP AND HANDLE
PRETTY SOLID VOLUMES ON WEEKLY TIMEFRAME
ROCE - 6.09%
ROE - 4.09%
P/E - 25.4

Pasupati Acrylon cmp 64.97 by Weekly ChartPasupati Acrylon cmp 64.97 by Weekly Chart
- Support Zone at 53 to 55 Price Band
- Bullish Double Rounding Bottom with neckline at 51 price level
- Price is well above the Falling Resistance Trendline and Way above Rising Support Trendline
- Weekly basis Support seen at 53 > 41 > 30 with the Resistance only at the ATH 65.83 price level
- Huge Volumes surge and demand based buying giving a breakout with New Lifetime High Milestone

PASHUPATI ACRYLON LTD(PASHUPTAC)
Elliott Wave Analysis for PASUPTAC (NSE)
Overview
This Elliott Wave analysis highlights the expected price movement of PASUPTAC, illustrating potential future trends using Elliott Wave theory. The analysis identifies key wave patterns, suggesting a bullish outlook with specific price targets.
Detailed Wave Count
Primary Wave Count (I to V)
1. Wave I : The initial impulse wave started from the base around April 2023 and progressed upwards, completing near 50.00.
2. Wave II : A corrective wave followed, marked by a sharp decline, bottoming out at around 33.50.
Sub-Wave Count within Wave I
- Wave (1) to (5) : The movement within Wave I can be further divided into five smaller waves, where:
- Wave (1) initiated the uptrend.
- Wave (2) saw a brief correction.
- Wave (3) was a strong upward movement.
- Wave (4) experienced another correction.
- Wave (5) completed the upward wave to conclude Wave I.
Sub-Wave Count within Wave II
- Wave A to C : The corrective phase Wave II can be subdivided into an ABC pattern:
- Wave A marked the initial drop.
- Wave B was a brief recovery.
- Wave C completed the correction, forming a five-wave decline within itself, labeled as (1) to (5)C forming an ending diagonal with hidden bullish divergence in RSI.
Forecast and Future Projections
Upcoming Waves (III to V)
- Wave III: Expected to be a powerful impulse wave. This wave is projected to target around 80.34 that is 1.68 Feb level initially, potentially extending higher.
- Wave IV: Anticipated to be a corrective wave after the completion of Wave III. This correction is expected to be mild, holding above the 70.00 level.
-Wave V: The final impulse wave in the current cycle is projected to push the stock towards 85.00 or higher, marking the completion of the broader upward cycle.
Key Levels to Watch
- Support Level:33.50 – This level marked the bottom of Wave II and is crucial for maintaining the bullish outlook.
- **Resistance Levels:** 50.00 (previous high of Wave I), 80.34 (target for Wave III), 85.00+ (target for Wave V).
Cup and Handle Pattern Analysis for PASUPTAC (NSE)
Overview
This technical analysis highlights the formation of a bullish cup and handle pattern in the PASUPTAC stock, accompanied by significant accumulation and a spike in trading volumes. The pattern suggests a potential upward breakout, offering a favorable risk-reward opportunity for investors.
Detailed Pattern Analysis
Cup Formation
• Base Formation: The stock formed a rounded bottom, starting from around July 2022 and extending through to June 2023. This phase represents the cup’s base, indicating a period of consolidation and accumulation.
• Rim of the Cup: The stock reached its initial high around 50.55 in June 2023, marking the upper rim of the cup.
• Depth of the Cup: The lowest point of the cup formation was around 22.35, indicating a significant retracement before the price started to recover.
Handle Formation
• Initial Decline: Following the cup formation, the stock experienced a minor pullback, forming the handle. This retracement was relatively shallow, maintaining support around the 33.50 level.
• Volume Spike: During the handle formation, there was a notable spike in trading volumes, indicating strong accumulation and investor interest.
Volume Analysis
• Accumulation Phase: The volume analysis during the cup’s base formation shows consistent accumulation, suggesting that investors were gradually building positions.
• Volume Surge: The handle’s formation phase saw a significant increase in trading volumes, further confirming the bullish sentiment and potential for an upward breakout.
Price Targets and Key Levels
• Breakout Level: The critical breakout level for the cup and handle pattern is around 50.55. A decisive move above this level would confirm the bullish breakout.
• Target Projection: Based on the depth of the cup, the target projection for the breakout is approximately 80.34, representing a substantial upside potential from the current levels.
Conclusion
The Elliott Wave analysis indicates a strong bullish potential for PASUPTAC, with significant upward movements expected in the coming months and also The cup and handle pattern in PASUPTAC, combined with strong volume accumulation, indicates a bullish outlook. Investors should watch for a breakout above the 50.55 level, which could lead to significant gains, with a potential target around 80.34. This pattern offers a promising trading opportunity, supported by robust technical indicators with invalidation level of 33.5

PASUPTAC : Breakout Stock #PASUPTAC #swingtrade #breakout #patterntrading #roundingbottom
PASUPTAC : (1-3 months)
>> Breakout candidate
>> Rounding Bottom Formation
>> Good Trendign stock
>> Good Strength & Volumes
>> Low Risk High Reward Trade
Swing Traders Can lock Profit at 10% & Keep Trailing
If u Like the Analysis, Pls give a Boost / Leave a Comment / Follow me.
Disclaimer : Charts Shared r for Learning Purpose, Not a trade Recommendation. Consult ur financial advisor before taking position.

INVERSE HEAD & SHOULDERS OR CUP & HANDLE PATTERNPASUPATI ACRYLONS has a daily chart CUP & HANDLE PATTERN and a weekly chart INVERSE HEAD & SHOULDERS showing the 47 level has broken with good volume

PASUPATHY ACRYLON:Likely rounding bottom b/outPASUPATHY ACRYLON: After a brief consolidation has formed a nice rounding bottom.Sustaining at 45 levels double bottom pattern/channel break out n long term chart suggests a move towards 50+(For educational purpose only)

PASUPTAC- SG - TRAPS LONG crossed above 100 49PASUPTAC- SG - TRAPS LONG crossed above 100 49
1) Broke trendline
2) ema 49 100 crossed above

PASUPTAC's Chart: Breakout, Retest, Momentum, and DivergenceIn this analysis, we will explore the chart of PASUPTAC, focusing on the breakout of a falling trendline, completion of a retest, gaining momentum, and the breakout of the 100 EMA (Exponential Moving Average). Additionally, we will consider the completion of a divergence on the weekly chart. It's important to note that PASUPTAC is a small-cap stock with a market capitalization of just 269.2 Crore. With that in mind, let's proceed with the analysis.
Chart Analysis:
Upon reviewing the provided TradingView chart for PASUPTAC, we can observe several key technical factors that may influence the stock's future price action. These include the breakout of a falling trendline, completion of a retest, gaining momentum, the breakout of the 100 EMA, and the completion of a divergence on the weekly chart.
Breakout of Falling Trendline and Retest:
The chart indicates that PASUPTAC has experienced a breakout of a falling trendline, which suggests a potential shift in the stock's trend from bearish to bullish. The subsequent completion of a retest after the breakout further validates the breakout's strength. A successful retest indicates that the previous resistance has now turned into support, potentially supporting further upward movement.
Gaining Momentum and Breakout of 100 EMA:
Additionally, the stock is gaining momentum again after the breakout and retest, indicating increasing buying interest. Furthermore, PASUPTAC has also experienced a breakout of the 100 EMA, which is a significant technical milestone. The breakout of a major moving average like the 100 EMA suggests a potential shift in the stock's overall trend and could attract further buying interest.
Completion of Divergence on Weekly Chart:
The analysis reveals that there was a divergence on the weekly chart's RSI (Relative Strength Index), which now seems to be completed. Divergence occurs when the price and an oscillator like the RSI move in opposite directions. The completion of the divergence suggests a potential reversal or continuation of the stock's current trend.
Buy Setup and Targets:
Based on the analysis, a potential buying opportunity arises at the current CMP (Current Market Price). Traders may consider initiating a long position with a stop loss set at 28, which helps limit potential losses if the anticipated upward movement does not materialize.
In terms of target levels, a target of 37 can be considered. However, it is important to monitor the price action and adjust the profit-taking strategy based on individual risk appetite and trading plan.
Considerations for Small-Cap Stock:
It's important to note that PASUPTAC is a small-cap stock with a market capitalization of just 269.2 Crore. Small-cap stocks tend to be more volatile and have lower liquidity compared to large-cap stocks. Therefore, traders should exercise caution and be mindful of the risks associated with trading small-cap stocks.
Conclusion:
Based on the technical analysis, PASUPTAC's chart indicates a breakout of a falling trendline, completion of a retest, gaining momentum, and a breakout of the 100 EMA. Furthermore, the completion of a divergence on the weekly chart adds weight to the potential upward movement. However, as a small-cap stock, traders should consider the associated risks and exercise caution when trading PASUPTAC.
Traders should carefully assess their risk tolerance and consider implementing appropriate risk management strategies, such as setting stop-loss levels. It is essential to closely monitor price action and any changes in the technical landscape to make informed trading decisions.
Disclaimer: The information provided in this analysis is for educational purposes only and should not be considered as financial advice. Trading stocks involves risks, and past performance is not indicative of future results. It is advisable to consult with a financial advisor or conduct further research before making any financial decisions.

PASUPATI ACRYLON LTD quick long setupHi Guys this is very nice short term buy setup in making of approx 9-10% move, very nice running flat in place, if you wanna buy then its right time to get in. because it might move fast break the mentioned level and return from there. so be cautious don't hold trade after it breaks the mentioned resistance levels. take profit and get out.

PASUPATI ACRYLON DAILY CHART ANALYSIS AS ON 03.01.2022PASUPATI ACRYLON as per daily chart analysis stock above 55 level for a target 58 level.

Pasupati acrylon Multi year BO ..could be good opportunity with SL 30(cb) ....₹72 upside possible
Note : educational post.
