PI Industries (PIIND) almost touches our predicted level!Sep 3, 2024
On July 31, 2024, we published the expected destination of Wave 3 of PIIND, which was around the 200% Fib level.
The chart below shows our previous analysis of PIIND.
On Sep 3, 2024, PIIND hit a high of Rs 4630.
With this it seems that both Wave 3 and Wave 5 are over, and it is time for a short correction.
Once again, we got the levels almost right. PIIND came within a whisker of our projected level.
Don't miss out on the biggest breaks! Follow our Ideas to stay ahead of the game.
Share the name of the stock you're interested in, and we'll be more than happy to conduct a thorough analysis for you.
Disclaimer: We are not SEBI registered. The content presented here is based on personal opinions. Conduct your own research and consult with a qualified financial advisor before making any investment decisions.
PIIND trade ideas

PI Industries_ATHCurrently PI Industry closed above ATH
Kindly find discription in the chart and Keep on investing in this scrip until it breaks 💔 previous market structure.
Happy Trading!! Only for educational Purpose.

In PI Industries (PIIND), where is Wave 3 expected to reach?After the Covid crash, PIIND has completed Waves 1 and 2 as per Elliott wave.
Right now, it is in Wave 3, and in uptrend.
However, Wave 3 is not forming the usual 1,2,3,4,5 pattern. Instead, it is going up as a corrective wave in the form of triangles.
We can see that the time between waves is almost equal (a minor difference of 4-5 bars)
Applying Fibonacci extension, the current uptrend is expected to touch Fib level 200%, after which we may see a fall, which will complete the current triangle.
Disclaimer : We are not SEBI registered. The content presented here is based on personal opinions. Conduct your own research and consult with a qualified financial advisor before making any investment decisions.
We look forward to engaging with all those who follow our ideas on Tradingview. Share with us your thoughts through the comment section.

PI Ind given breakout on Weekly..Heading to 5000The 56 weeks consolidated range contraction was 820 points (52.47%). And we expect the range expansion towards 5000 in near future. Mainly this breakout backed by huge volume also on weekly chart.

Amazing breakout on Weekly TF - PIINDCheckout an amazing breakout happened in the stock in Weekly timeframe, macroscopically seen in Daily timeframe. Having a great favour that the stock might be bullish expecting a staggering returns of minimum 25% TGT. IMPORTANT BREAKOUT LEVELS ARE ALWAYS RESPECTED!
NOTE for learners: Place the breakout levels as per the chart shared and track it yourself to get amazed!!
#No complicated chart patterns
#No big big indicators
#No Excel sheet or number magics
TRADE IDEA: WAIT FOR THE STOCK TO BREAKOUT IN LOWER TIMEFRAME AND RETRACE IF NEEDED. SL IS NEARER SUPPORT ZONE IN Daily TIMEFRAME.
PS: No new Nifty500 script can escape from me when making a breakout. :-)
Checkout an amazing breakout happened in the stock in Weekly timeframe.
Breakouts happening in longer timeframe is way more powerful than the breakouts seen in Daily timeframe. You can blindly invest once the weekly candle closes above the breakout line and stay invested forever. Also these stocks breakouts are lifelong predictions, it means technically these breakouts happen giving more returns in the longer runs. Hence, even when the scrip makes a loss of 10% / 20% / 30% / 50%, the stock will regain and turn around. Once they again enter the same breakout level, they will flyyyyyyyyyyyy like a ROCKET if held in the portfolio in the longer run.
Time makes money, GREEDY & EGO will not make money.
Also, magically these breakouts tend to prove that the companies turn around and fundamentally becoming strong. Also the magic happens when more diversification is done in various sectors under various scripts with equal money invested in each N500 scripts.
The real deal is when to purchase and where to purchase the stock. That is where Breakout study comes into play.
LET'S PUMP IN SOME MONEY AND REVOLUTIONIZE THE NATION'S ECONOMY!

LONGPI INDUSTRIES
CMP: 4204
Weekly Chart
Key Study Points:
- Rounding bottom breakout and ATH breakout.

Buy or SellWeekly Chart
RSI crossed 60 with Bullish Candle
Challenged upper BB
ADX- Bullish , turned up, with + DMI crossing - DMI
Near Major Resistance
If crossed in coming weeks, Good Buy trade till Upper trend channel
If channel crossed, Next in new territory
daily RSI made Bullish Range shift with 60 support, One can go long with SL of RSI in 1 Hour, crosses below 40
Educational purpose

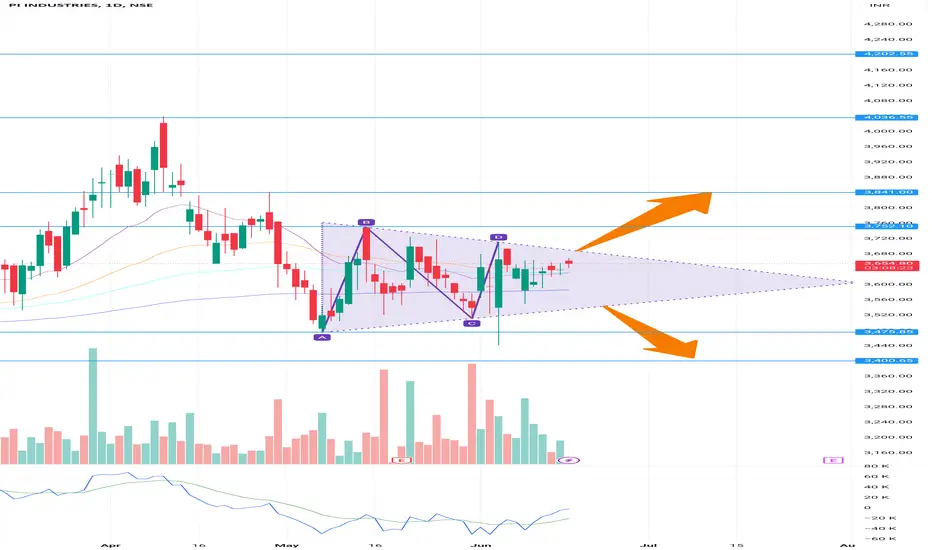
Long PIIND FOR TARGET OF 4200PIIND is trading in symmetrical triangle pattern on daily charts.
Currently inside the triangular channel. Once breakout is confirmed.
We can see piind moving to new highs in future. Another positive found is moving average crossovers occurring on weekly charts.
Wait for breakout confirmation to enter.
All targets are marked on chart.
Follow stop loss as the triangle breakout point on either side. Strictly on closing basis
Piind : Strong Breakout -Need to sustainPIInd :
Closed above strong resistance zone.
Cup & Handle breakout too
Sustaining 4070 levels is crucial for strong upmove

PI Ind - ATH breakoutWith both Pharma+ Agri looking to do well going ahead...one of the leaders in the segment of CDMO has just broken out int one ATH territory.
Long at current prices (50% allocation) with SL below 3900..
ideally wait for a retest or follow thru on Monday to take an allocation...
The stock has consolidated for a long time..so the breakout could be powerful.

PI INDUSTRIES 1DThe stock is at an all-time high. Either side move can give a good result. on the short side 1st target would be 3478.

PI Ind - Post budget moverThe stock showed some good strength today and is on the neckline of a breakout..
The market futures are showing like they will open weak tomorrow but any pullback into the 10EMA or atleast 3920 can be got with a stoploss below 3825.
A breakout above 4030 can be a double up trigger to catch a quick move of 5-10%
An fresh breakout after consolidation here can give a good move.

Breakout soon in PI INDDarvas box range Breakout setup
RSI above 65 and rising
Trading above EMA50
Volume increasing
12+ months of consolidation
Enter after confirmation
Disc: for study, not a recommendation


PI Ind - Potential breakout candidateThe stock has been on the v erge of a breakout several times but cooled off..
This will try again either tomorrow or next week.
Long above 3935 with stoploss below 3800.
The stock has been consolidating since July of last year..so a break above 4100 could give it some great momentum. With the pharma sector and agri-chem recovering..this stock has a good chance of taking off above an ATH breakout.

Long PIINDShowing Strenght and can break out with the support of sectorial tailwinds
good fundamentals
cmp 3850
sl 3600
target 5000

PIIND Long PositionalDate : 22-06-2024
-------------------------------------
SWING RESEARCH TO OBSERVE
PIIND Looks Good ABOVE 3763
SL 3472
Target 3867, 3971, 4282
Hold few weeks
Please consult your financial advisor before investing
All research for educational purposes only.

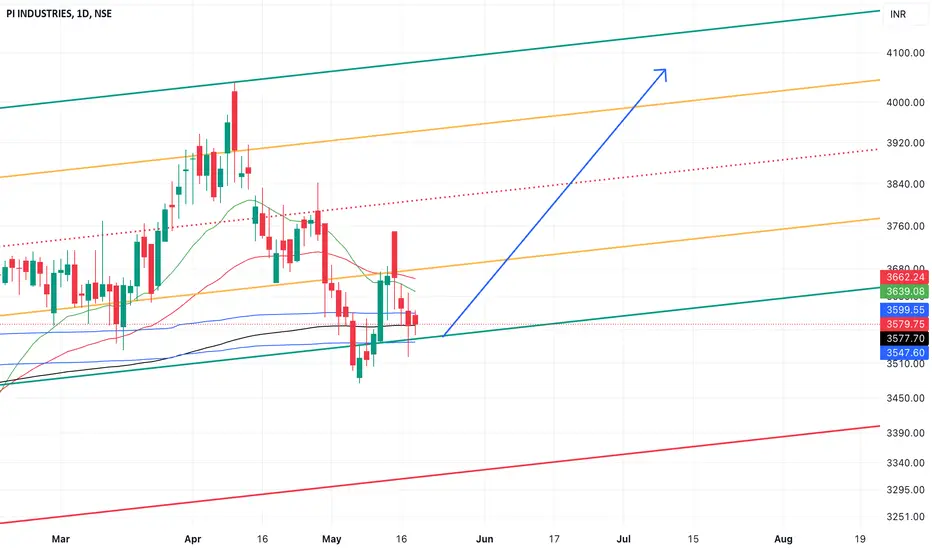
PI INDUSTRIES (SIP QUALITY STOCK)Market Leaders from AGROCHEMICAL as per chart this Stock has been a Wealth compounder currently trading inside a channel same as Nifty 50 has correlation with 50
One can buy the stock at cmp and Hold for long Term
Has Strong FII and DII HOLDING
Not a Buy sell Recommendation pure Techincal Analysis


PI Industries - Excellent buy point . positional trade1) PI Industries retested 200 DMA
2) Bottom of pitchfork
3) in the AWAP buying band.
PIINDS TGT 4300 BUY ZONE 3400-3500/ BUY ON DIPSPI Industries Ltd. is an interesting chart with following
1. Price moving in a rising channel and consolidating since July 2022
2. Multiple Supports at 3460-3500 zone
3. 20 Day SMA support at 3470; 50 EMA daily support at 3490
4. 50 day EMA weekly support at 3474, 20 months SMA support at 3410 levels
ABCD Pattern under formation on weekly chart with Narrowing Bollinger Bands.
MOVING AVERAGE CROSSOVERS
5. 20 SMA crossed 50 SMA from below
6. 50 EMA crossed 200 EMA from below
7. Price making higher highs for last three weeks
8. Rising Returns on equity ; Rising Returns on capital Employed
A Stock to keep in watch list to buy on dips at supports as channel high near 4300 can be a good target.
Caution: Stock is in long consolidation since 2022 and can remain sideways as it is under performing the index and sector for a long time.
Disclaimer: I am not an expert I just share interesting charts here for educational purpose and not to be taken as buy/sell recommendation. Please seek expert opinion before investing and trading as trading/ investing in market is subject to market risks. I do not hold any position in the stock as on date but I may look to buy on dips with my own Risk Reward matrix.


PI Industries Projection for coming days(09-04-2024)Its a weekly time frame chart analysis for PIIND. It is forming a ascending triangle. And its first target will 4400. I have considered chart pattern and trend. I have also considered few other things like previous result, etc. And then i came to this conclusion which i am sharing it for study purpose.
