PNB (Punjab National Bank)- AnalysisFor Potential Entry:
PNB stock could present a good buying opportunity if its price falls into the ₹56 to ₹65 range. If you enter at this level, consider setting a stop-loss (SL) at ₹47 or ₹41 to manage potential downside risk.
Bullish Scenario:
If PNB sustains above ₹141, it suggests a strong bullish trend. In this scenario, we could see initial targets of ₹195 to ₹235. Should the stock maintain its position above ₹235, it indicates further bullish momentum, potentially leading to higher targets around of ₹300, ₹400, and even ₹500.
**Consider some Points buffer in above levels
**Disclaimer -
I am not a SEBI registered analyst or advisor. I does not represent or endorse the accuracy or reliability of any information, conversation, or content. Stock trading is inherently risky and the users agree to assume complete and full responsibility for the outcomes of all trading decisions that they make, including but not limited to loss of capital. None of these communications should be construed as an offer to buy or sell securities, nor advice to do so. The users understands and acknowledges that there is a very high risk involved in trading securities. By using this information, the user agrees that use of this information is entirely at their own risk.
Thank you.
PNB trade ideas

Punjab National Bank Flag Breakout Setup📈 Punjab National Bank (PNB) – Flag Breakout Setup
Observed a classic flag pattern on the daily chart after a strong pole move in 2023–24.
✅ Breakout above the channel confirmed with price action near 113.
✅ Entry plan: Watch for daily close >113 with volume.
✅ Stop-loss idea: Below 106.
✅ Target 1: 140 (first swing resistance).
✅ Measured move projection targets up to ~198 possible based on full flag pole.
Volume confirmation and broader market context will guide the actual trade trigger.

PNB Bottom Pick LongDate : 11-10-2024
-------------------------------------
Bottom Pick (PICK RESEARCH TO OBSERVE)
PNB Looks Good Above 107
SL 100
Target 109, 111, 114, 120, 127, 135++
Hold Period : Few Weeks to Months
Reason for Pick : Bottom Pick, Volume built-up
Please consult your financial advisor before investing
All research for educational purposes only.

PNB Technical Analysis Simple Breakdown🔍 PNB
✅ Daily Chart:
PNB took support at the 200-day MA, forming a strong bullish candle — clear sign of buyer strength at a key level.
✅ Weekly Chart:
The stock closed above the 50-week MA, indicating momentum building on a higher timeframe.
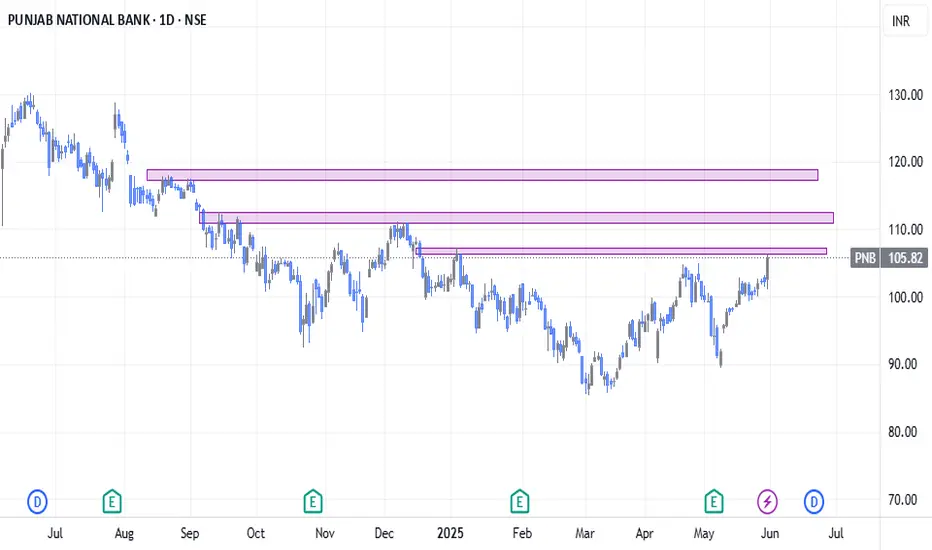
🧱 Resistance Zone Ahead – ₹107.20 to ₹112:
Price is nearing a supply zone. Sustaining above ₹107.40 with volume would indicate strength and continuation.
📌 What to Watch:
🔼 Buy Trigger:
Only consider a potential move if price sustains above ₹107.40 with strong momentum and volume confirmation.
💡 Conclusion:
PNB is showing strength with a bullish structure — holding 200 MA on daily and crossing 50 MA on weekly. Focus remains on price action near ₹107.40 for further movement.
📊 Refer to the zones marked in the above chart for better clarity.
⚠️ Disclaimer: This is purely for educational purposes. Not financial advice. Please consult your advisor before making any trading decisions.
Bullish in PNB CMP-100.80Punjab National Bank (PNB) appears to be entering a strong uptrend, supported by improving fundamentals and increasing momentum within the broader PSU banking space. With sector rotation favoring public sector banks, PNB stands out as a promising candidate poised to benefit from this shift.
Technicals are aligning with broader market sentiment, showing higher highs and strong volume accumulation. As PSU banks gain institutional and retail interest, PNB could be among the key beneficiaries in the upcoming leg of the rally.
Target: ₹112 (10–15% upside)
Stop-loss: Maintain a strict stop-loss at 5% below your entry to manage risk effectively.
This setup offers a favorable risk-reward ratio and aligns well with the ongoing bullish shake-up in the PSU banking sector.
PNB: Buy on Retest Level1. PNB has been an underperformer for a long time.
2. Looking at the strength at the current price, the buying opportunity appears attractive with a very small stop-loss.
3. This is not a very high-conviction setup since there is an overhead trendline resistance.
4. Since the risk is minimal, it is worth taking the opportunity. If it reverses, we accept the stop-loss and move on.
⚠️ Disclaimer: This is NOT a buy/sell recommendation for learning ONLY. Views are personal. Please, do your due diligence before investing. ⚠️
🔥 Happy Trading! 🚀


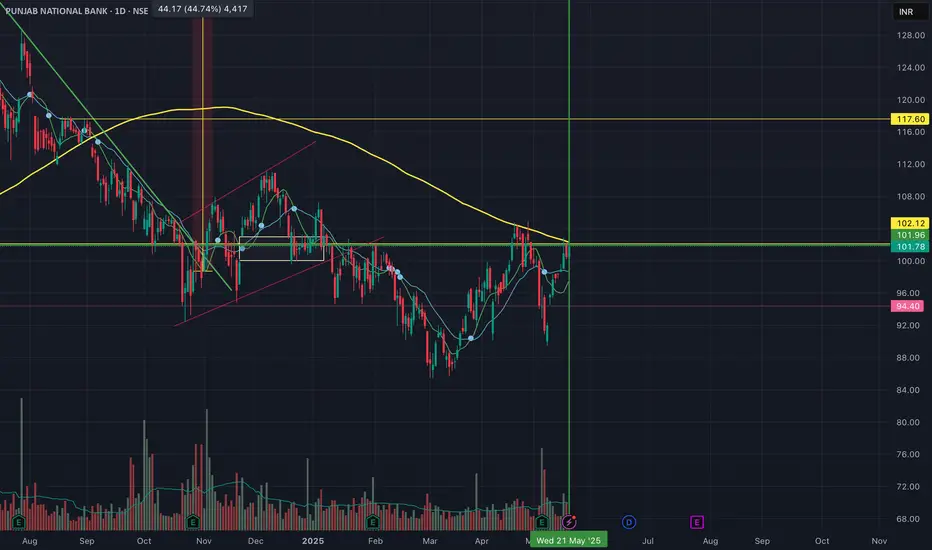
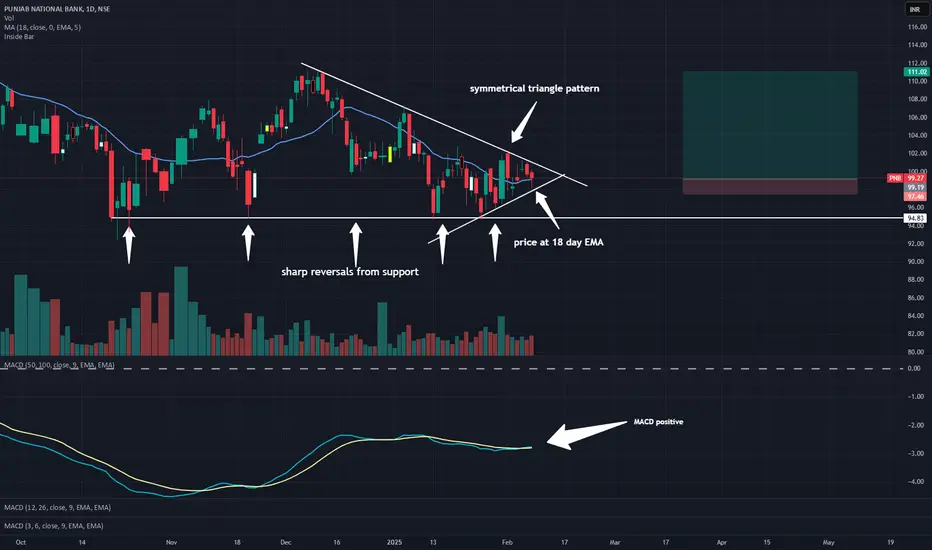
PNB is really Trend shifting?High probability that trend shifting can be seen in PNB bank. On daily chart high probability of trend reversing with the support of 50 EMA. Also stock is trading above the resistance area. Can take long entry above 99 for the first target between 112-115. later we can trail the SL .This is for your educational purpose only.
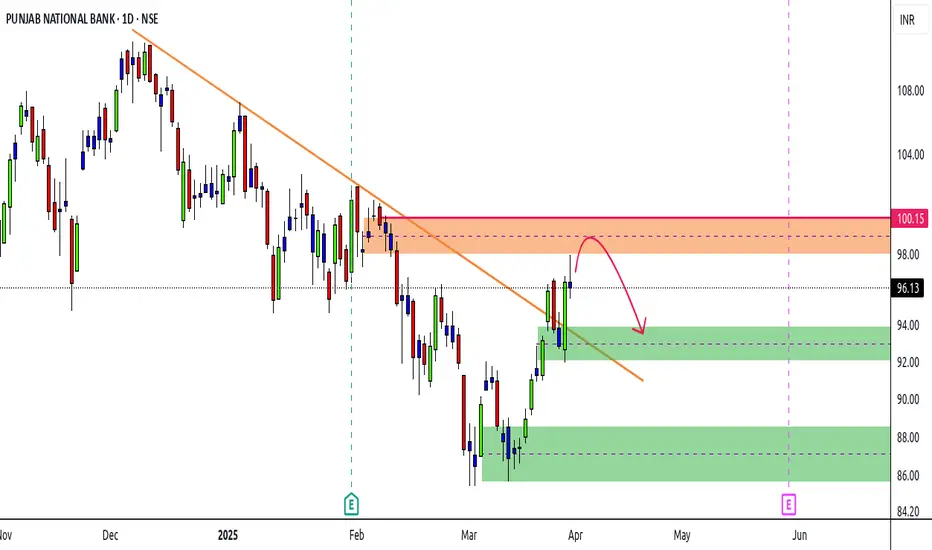

PNB Trade Setup**🚀 PNB Trade Setup - Key Levels to Watch! 📊📉**
📊 **Stock:** PUNJAB NATIONAL BANK (NSE)
🕒 **Timeframe:** 1D Chart
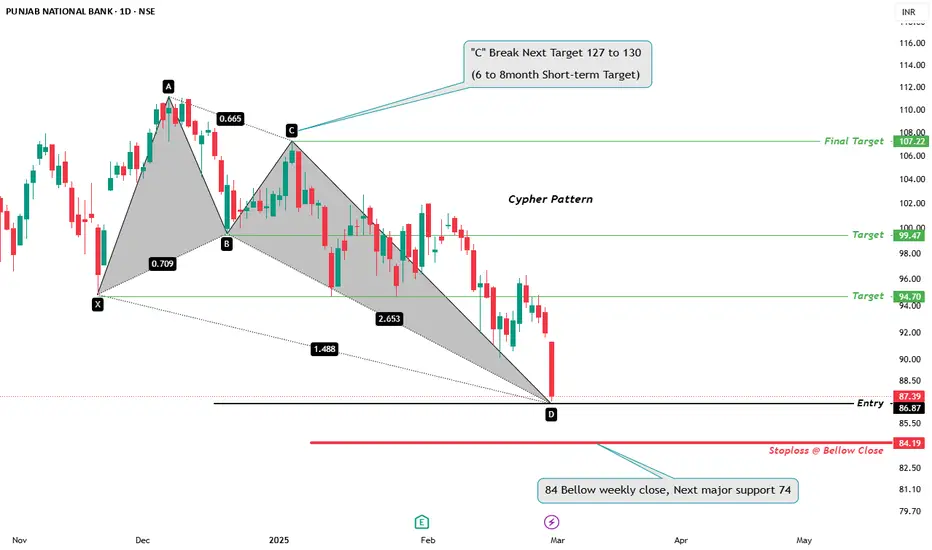
🔹 **Current Price:** **₹87.39**
🔹 **Entry Level: 86 to 87 ⚡
🔹 **Stoploss:** **Below ₹84.19** (If weekly close is below ₹84, next major support is ₹74)
🎯 **Bullish Targets:**
✅ **₹94.70**
✅ **₹99.47**
✅ **Final Target ₹107.22**
✅ **If 'C' Breaks, Next Target ₹127 - ₹130 (6-8 Months)**
🔻 **Bearish Breakdown Levels:**
🚨 **₹84 Breakdown → Next major support at ₹74**
💡 **Key Insights:**
✔️ **Cypher pattern completion at 'D' - Possible Reversal Zone!**
✔️ **Sustaining above ₹87.39 could lead to a strong bullish move** 📈
✔️ **Failure to hold ₹84 may result in further downside towards ₹74** 📉
⚠️ **Disclaimer:** This analysis is for **educational purposes only** and not financial advice. Trade wisely! 📊


PNB on a Bearish Run!Market Update: PNB on a Bullish Breakout!
PNB has recently broken its key resistance level of ₹98, marking a significant milestone for the stock. This breakout, accompanied by high volumes, indicates robust buyer interest and signals strong momentum in the stock's favor.
Key Insights
Trend: The bullish trend remains intact, evidenced by the formation of higher highs and higher lows.
Volume Support: The breakout is well-supported by increased trading volume, adding credibility to the upward move.
Opportunity: This development suggests potential upside opportunities for traders and investors.
What to Watch
Keep an eye on PNB for further bullish momentum. As long as it sustains above ₹98, the stock could continue its upward trajectory. Monitor volume patterns and broader market sentiment for additional confirmation.
#PNB #StockMarket #Breakout


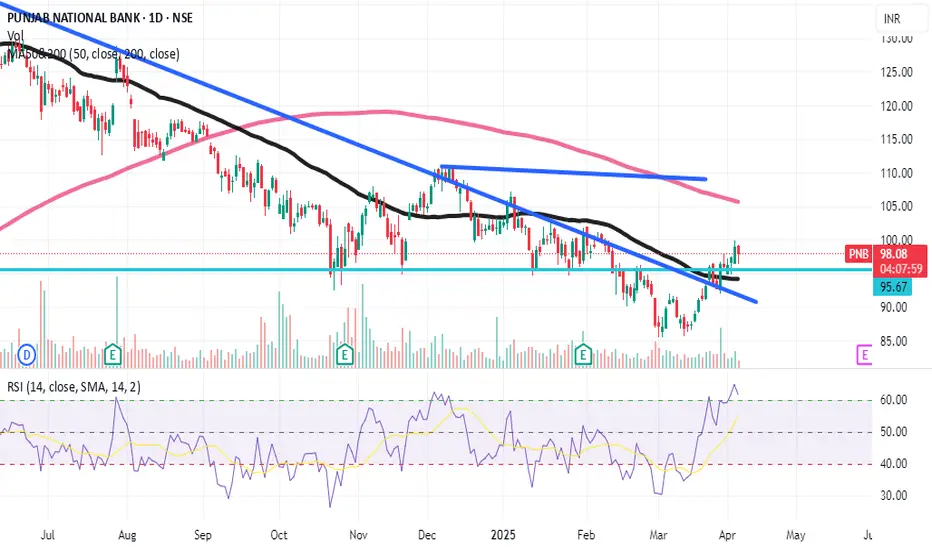
PNB: Oversold Stock with inherent bullishnessTopic Statement: The stock has become oversold but shows recovery potential as it moves in an up-trending channel following a recent breakout over the downtrend line.
Key Points:
1. The stock recently broke out over its downtrend line, signaling a reversal.
2. It is moving in an up-trending channel, indicating bullish momentum.
3. The price is currently below the 180-day moving average, making it oversold and a potential buying opportunity.


PNB Break or RejectionPNB is a large PSU financial institution. The chart has some interesting aspects.
After an upmove, it has shown retracement upto 61.8% level. It is currently trading at narrow range.
The result is due in Feb first fortnight. This is a make or break stage for the script. If it shows strength, it can move to is first target of 124, second target of 140 and higher targets upto 180-190.
Keep a close watch.
This is not a buy/sell recommendation.
This post is only for educational purpose.
Kindly consult your financial advisor before investing.
Keep strict stoploss and money management rules.
Happy Trading!!


Punjab National Bank Chart Analysis with Targets PNB Support and Resistance for Invesment and Positional Trading
For Punjab National Bank's (PNB) current chart analysis, the major support level is around ₹90, indicating a key price floor that could prevent further declines. This level has been established based on past lows and acts as a safety net if the stock price falls.
The first target for PNB is set at ₹129 , which represents a bullish upward trend from current levels. This target may be reached if PNB breaks above its resistance and sustains positive momentum.
The second target is set at ₹140, a further potential upside based on technical analysis. This target is achievable if the stock continues to gain strength after breaking the ₹129 resistance.
This analysis is supported by historical price action and key technical indicators like support/resistance levels, moving averages, and relative strength.
