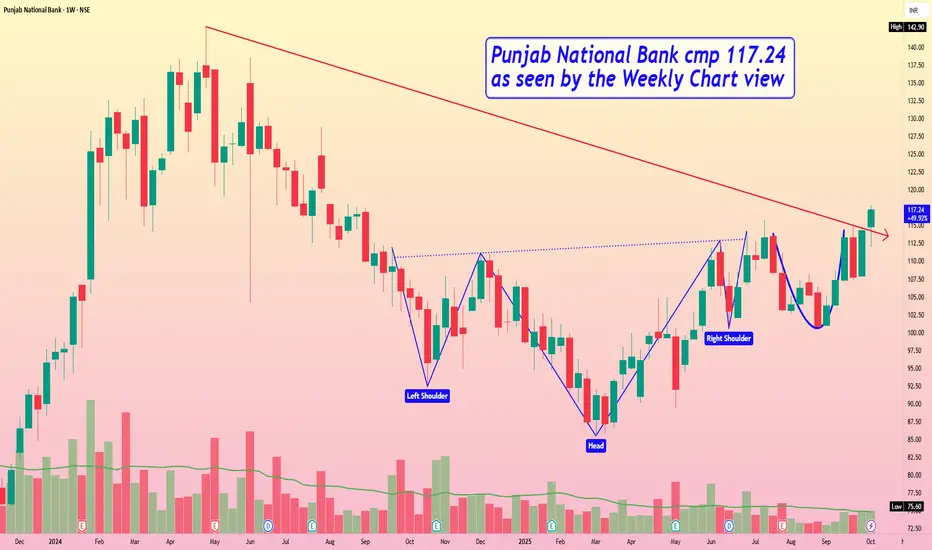
Punjab National Bank cmp 117.24 by Weekly Chart viewPunjab National Bank cmp 117.24 by Weekly Chart view
- Weekly basis Support levels seen at 107 > 98 > 87
- Weekly basis Resistance levels at 124 > 133 > ATH 142.90
- Bullish Head & Shoulders followed by Rounding Bottoms formed
- Volumes seen getting in close sync with the average traded quantity
Trade ideas
PNB (W) - Historic Crossroads, 15-Year Trendline Breakout LoomsPunjab National Bank (PNB) is currently positioned at one of its most significant technical junctures in over a decade. A classic bullish reversal pattern is now challenging a formidable, long-term resistance, setting the stage for a potentially explosive move.
The Bullish Setup: An Inverted Head & Shoulders
After reversing its downtrend in February 2025, the stock has meticulously formed a large Inverted Head and Shoulders pattern . This is a well-regarded bullish reversal pattern that typically signals the beginning of a sustained uptrend upon a successful breakout.
The Critical Resistance Confluence
What makes this setup particularly compelling is the location of the pattern's neckline. A breakout requires the stock to overcome a confluence of two powerful resistance levels simultaneously:
1. A 15-Year Resistance Trendline: A major, long-term descending trendline that has been in place since November 2010. Breaking this would be a historically significant event.
2. A Short-Term Horizontal Resistance: A more recent horizontal price ceiling that aligns perfectly with the long-term trendline.
This alignment of a classic reversal pattern with a multi-decade resistance makes the current price level a critical battleground between buyers and sellers.
Supporting this potential breakout, momentum indicators are strong. The short-term EMAs are in a positive crossover and the RSI is rising on both the Monthly and Weekly timeframes. Furthermore, a gradual increase in volume recently suggests growing buyer interest.
Outlook and Key Levels
The outcome depends entirely on whether this critical resistance zone can be breached.
- Bullish Breakout Scenario: A decisive close above the neckline and the dual trendlines, especially on high volume, would confirm the breakout. The measured target of the pattern projects a potential move towards the ₹138 level.
- Rejection Scenario: If the stock fails to overcome this heavy resistance, a rejection could send it back to test support near the ₹100 level, which roughly corresponds to the right shoulder of the pattern.
The key signal to watch for is a high-volume close above the neckline. Until that occurs, this historic resistance remains the primary obstacle.

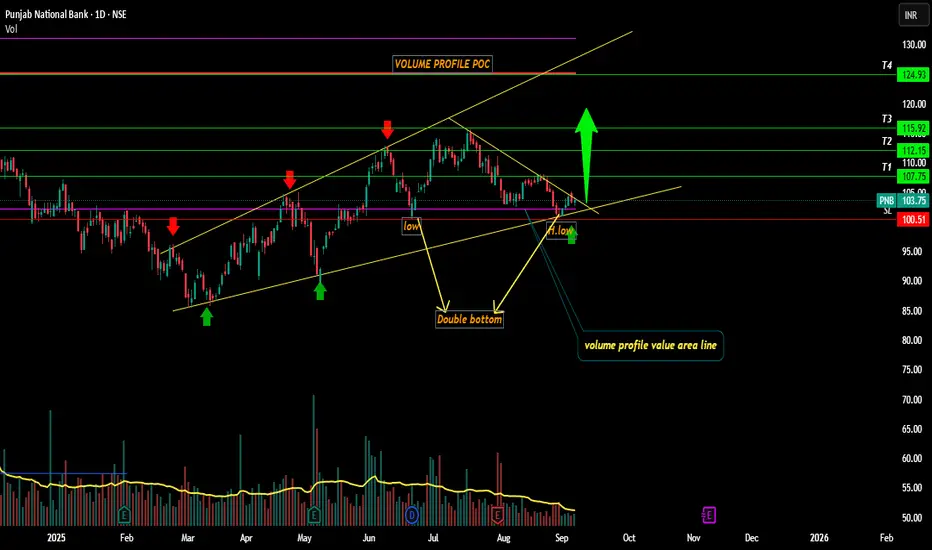
PNB looking Bullish ahead??!!Kindly check out the chart for the explanation.
Reasons-
1. Trendline Support
2. Double bottom
3. Fixed volume profile value area support
4. Low and lower low
5. PSU BANK index too looking bullish , check out idea below
Close below 100.52 - invalidation level
Targets mentioned @ chart.
Just my view ...not a tip nor advice!!!!
Thank you!!!
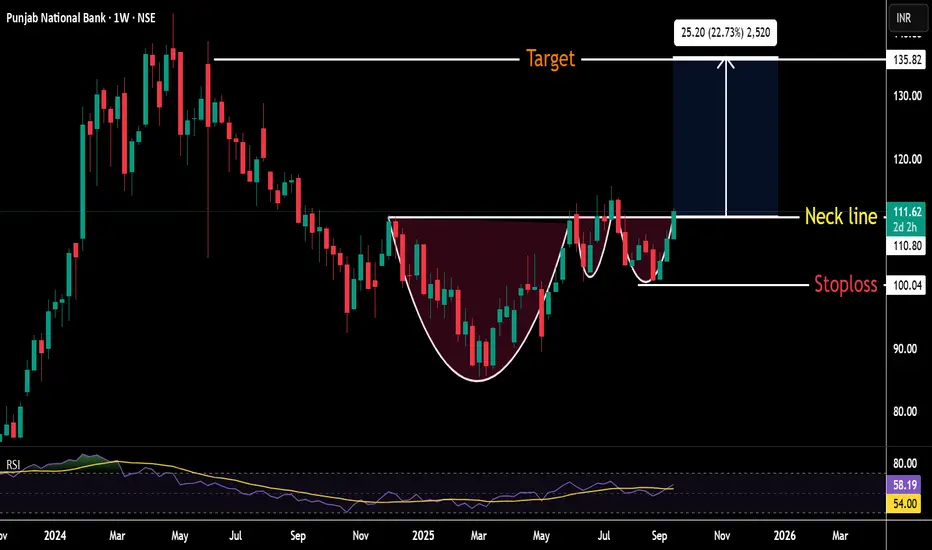
Complex Cup & Handle Pattern in PNBPNB Formed Complex Cup & Handle Pattern on weekly chart & currently trading near Breakout zone .Possible Target of this Breakout will be 135Rs with a stoploss of 100 Rs.
It's not a buy or sell call ..For education only
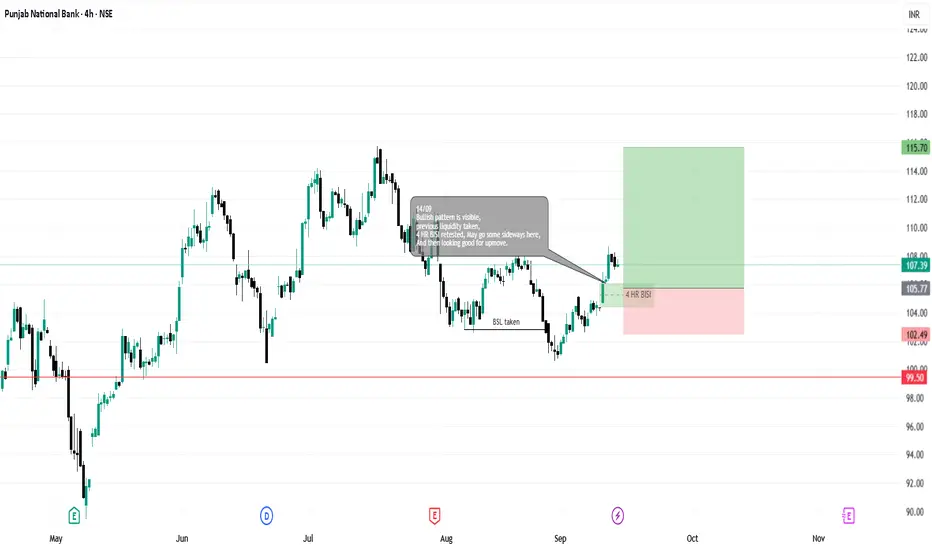
Long can be taken, Looking bullish to me, I can see the bullish patten here, previous BSL was taken and now the 4HR BISI retest is also completed,
Can add more for easy 10%.
PUNJAB NATIONAL BANKHello & welcome to this analysis
In my previous post on the bank I had suggested the likelihood of it declining to 103 where it had double bullish harmonic patterns. (link to that post is given)
Now the bullish harmonic Bat & reciprocal ABCD patterns are indicating the probability of a rally till 106 & 109 as long as it sustains above 100.
Immediate resistance at 104 with strong support near 102.50
All the best

PUNJAB NATIONAL BANKHello & welcome to this analysis
In July 2025 it activated a bearish Harmonic Butterfly pattern at 115 that lead to its current decline at 38 Fibonacci of its rally.
Going forward it could continue to decline till 100 where it would likely form two bullish Harmonic patterns - Shark & ABCD around the 50 Fibonacci retracement.
It has resistance now between 110 - 108 from where it fell with heavy volumes couple of days back.
All the best
Regards

Algo & Quantitative TradingIntroduction: Trading in the Modern World
Trading has evolved dramatically over the years. From the days of shouting orders in crowded stock exchanges to the modern era of laptops, smartphones, and AI-driven strategies, the financial markets have always been a reflection of both human psychology and technological advancement.
In today’s world, two powerful approaches dominate professional and institutional trading:
Algorithmic Trading (Algo Trading) – where computer programs execute trades based on pre-defined rules.
Quantitative Trading (Quant Trading) – where mathematical models, statistics, and data analysis decide when and how to trade.
Though closely related, these two are not the same. Algo trading focuses on execution speed and automation, while quant trading is about designing profitable models using numbers, probabilities, and logic.
This guide will take you step by step through both concepts—explaining them in simple, human terms while keeping all the depth intact.
Part 1: What is Algorithmic Trading?
The Basics
Algorithmic Trading, or Algo Trading, is when a computer follows a set of instructions (an algorithm) to buy or sell assets in the financial markets. Instead of a trader sitting at a desk watching charts, a machine takes over.
Think of it like teaching a robot:
“If stock A rises above price X, buy 100 shares.”
“If the price falls below Y, sell them immediately.”
The robot will follow these rules without fear, greed, or hesitation.
Why It Exists
Markets move fast—sometimes too fast for humans. Algo trading helps in:
Speed: Computers react in microseconds.
Accuracy: No emotional mistakes.
Scalability: Algorithms can track hundreds of stocks simultaneously.
Real-Life Example
Imagine you want to buy Reliance Industries stock only if its price drops by 2% in a single day. Instead of staring at the screen all day, you set up an algorithm. If the condition is met, the trade executes instantly—even if you’re asleep.
This is algo trading at work.
Part 2: What is Quantitative Trading?
The Basics
Quantitative Trading (Quant Trading) is about designing strategies using math, statistics, and data analysis.
A quant trader doesn’t just say, “Buy when the price goes up.” Instead, they might analyze:
Historical data of 10 years.
Probability of returns under different conditions.
Mathematical models predicting future prices.
Based on these calculations, they create a strategy with an edge.
Why It Exists
Quant trading is powerful because financial markets generate massive amounts of data. Human intuition can’t process it all, but mathematical models can find patterns.
For example:
Do stock prices rise after a company posts quarterly earnings?
What’s the probability that Nifty will fall after 5 consecutive green days?
How do global oil prices impact Indian airline stocks?
Quant traders use such questions to create predictive strategies.
Part 3: Algo vs. Quant Trading
It’s important to understand the difference:
Aspect Algo Trading Quant Trading
Definition Using computer programs to execute trades Using math & data to design strategies
Focus Automation & speed Analysis & probability
Skillset Programming, tech setup Math, statistics, data science
User Retail traders, institutions Hedge funds, investment banks
Goal Execute orders efficiently Build profitable models
In short: Quant trading designs the strategy, and algo trading executes it.
Part 4: Building Blocks of Algo & Quant Trading
1. Data
Everything begins with data. Traders use:
Price data (open, high, low, close, volume).
Fundamental data (earnings, revenue, debt).
Alternative data (Twitter trends, news sentiment).
2. Strategy
You need a clear set of rules:
Trend-following: Buy when the price is rising.
Mean reversion: Sell when the price is too high compared to average.
Arbitrage: Profit from small price differences across markets.
3. Backtesting
Before risking real money, traders test strategies on historical data.
If it worked in the past, it might work in the future.
But beware of overfitting (a model that works too well on old data but fails in real time).
4. Execution
The algo takes the quant model and executes trades in real-time with perfect discipline.
5. Risk Management
No system is perfect. Every strategy must have rules for:
Stop-loss (cutting losses).
Position sizing (how much money per trade).
Diversification (not putting all eggs in one basket).
Part 5: Types of Algo & Quant Strategies
Trend Following
“The trend is your friend.”
Example: If Nifty50 crosses its 200-day moving average, buy.
Mean Reversion
Prices always return to average.
Example: If stock falls 5% below its 20-day average, buy.
Arbitrage
Exploiting small price differences.
Example: Buying gold in India and selling in the US if price gap exists.
Statistical Arbitrage
Using correlations between assets.
Example: If Infosys and TCS usually move together but Infosys falls more, buy Infosys.
High-Frequency Trading (HFT)
Ultra-fast trades in microseconds.
Mostly done by big institutions.
Market Making
Providing liquidity by constantly quoting buy/sell prices.
Earns from the spread (difference between buy & sell price).
Part 6: The Human Side of Algo & Quant Trading
Advantages
Emotionless Trading: No fear or greed.
24/7 Monitoring: Algorithms don’t need sleep.
Scalability: Can track hundreds of markets.
Speed: Reaction in microseconds.
Disadvantages
Over-Optimization: Models may look good on paper but fail in real life.
Technical Risk: Server crash, internet issues, coding errors.
Market Risk: Black swan events (like COVID-19 crash) break models.
Competition: Big firms with better technology dominate.
Part 7: Skills Needed for Algo & Quant Trading
Programming: Python, R, C++, SQL.
Math & Statistics: Probability, regression, time series.
Finance Knowledge: Markets, assets, instruments.
Risk Management: Understanding drawdowns and volatility.
Critical Thinking: Testing, improving, adapting strategies.
Part 8: Real-World Applications
Retail Traders: Use algo bots to execute simple strategies.
Hedge Funds: Rely on complex quant models for billions of dollars.
Banks: Use algorithms for forex and bond trading.
Crypto Market: Bots dominate trading on exchanges like Binance.
Part 9: Future of Algo & Quant Trading
The field is evolving rapidly with:
Artificial Intelligence: Machines learning patterns without explicit coding.
Machine Learning: Predicting stock moves using massive data.
Big Data: Using social media, weather, and even satellite images for trading.
Blockchain & Crypto: Automated bots running 24/7 in decentralized markets.
Conclusion
Algo & Quant Trading is not about replacing humans—it’s about augmenting human intelligence with machines. Humans still design strategies, understand risks, and set goals. Machines simply execute with precision.
For small traders, algo trading can bring discipline and automation. For large institutions, quant trading offers data-driven profits.
The future belongs to those who can combine mathematics, programming, and financial insight—because markets are not just numbers, they are reflections of human behavior expressed through data.
PNB 1 Day ViewSupport Levels:
₹128.50 – Immediate support (recent swing low)
₹125.20 – Strong demand zone
₹121.80 – Major support
Resistance Levels:
₹133.40 – Immediate hurdle
₹136.20 – Strong resistance (recent high area)
₹140.00 – Psychological & breakout level
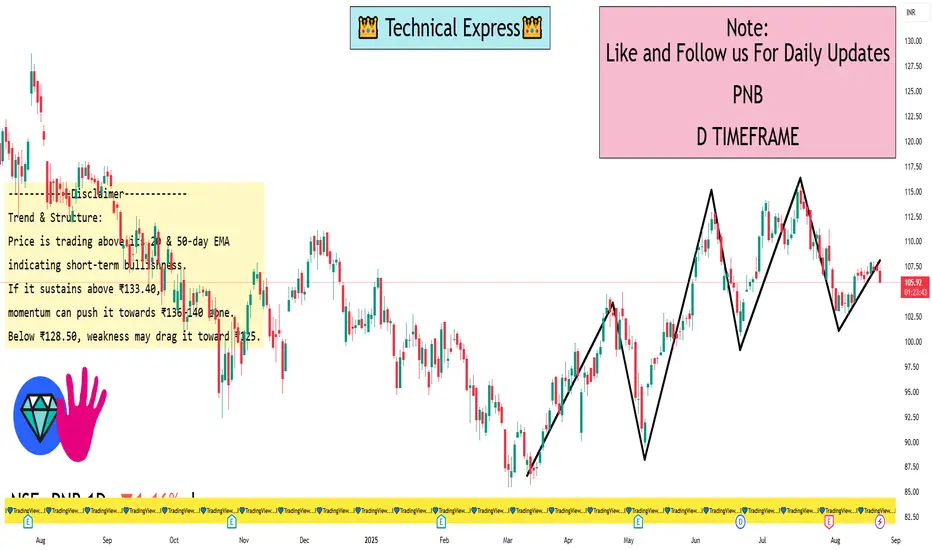
📈 Trend & Structure:
Price is trading above its 20 & 50-day EMA, indicating short-term bullishness.
If it sustains above ₹133.40, momentum can push it towards ₹136–140 zone.
Below ₹128.50, weakness may drag it toward ₹125.
PNB Breakdown Alert: Further Downside Likely📊 TECHNICAL INDICATOR ANALYSIS – PNB BEARISH OUTLOOK
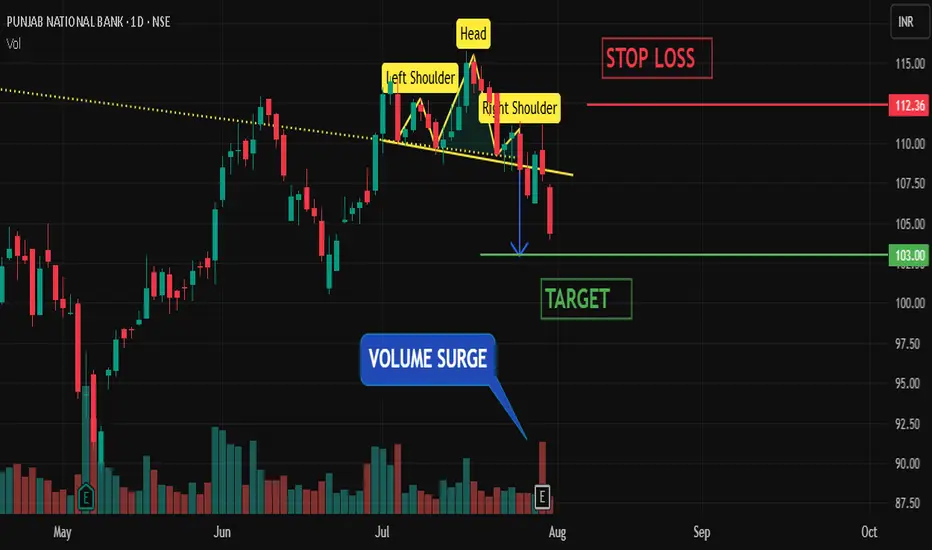
🔻 1. HEAD & SHOULDERS PATTERN FORMATION
PNB has formed a CLASSIC HEAD AND SHOULDERS PATTERN, a strong bearish reversal signal. The breakdown below the neckline confirms the end of the previous uptrend and suggests a shift in sentiment toward the downside.
📉 2. VOLUME SURGE ON BREAKDOWN :
A SIGNIFICANT SPIKE IN VOLUME was observed during the breakdown, reinforcing the bearish pattern. Volume confirmation is crucial, and in this case, it shows that sellers are aggressively stepping in to drive the price lower.
📉 3. BEARISH MACD CROSSOVER :
The MACD LINE HAS CROSSED BELOW THE SIGNAL LINE, a key momentum-based sell signal. This bearish crossover aligns with the breakdown and volume, indicating that downside momentum is likely to accelerate.
🎯 TRADE SETUP :
✅ TARGET: ₹103
❌ STOP LOSS: ₹112.5
Will it work!Earnings Update
I’ve decided to add Punjab National Bank (PNB) to my watchlist for future monitoring. After reviewing their recent performance and the overall financial landscape, I believe it’s important to keep an eye on PNB to assess any potential investment opportunities.

PNB (Punjab National Bank)- AnalysisFor Potential Entry:
PNB stock could present a good buying opportunity if its price falls into the ₹56 to ₹65 range. If you enter at this level, consider setting a stop-loss (SL) at ₹47 or ₹41 to manage potential downside risk.
Bullish Scenario:
If PNB sustains above ₹141, it suggests a strong bullish trend. In this scenario, we could see initial targets of ₹195 to ₹235. Should the stock maintain its position above ₹235, it indicates further bullish momentum, potentially leading to higher targets around of ₹300, ₹400, and even ₹500.
**Consider some Points buffer in above levels
**Disclaimer -
I am not a SEBI registered analyst or advisor. I does not represent or endorse the accuracy or reliability of any information, conversation, or content. Stock trading is inherently risky and the users agree to assume complete and full responsibility for the outcomes of all trading decisions that they make, including but not limited to loss of capital. None of these communications should be construed as an offer to buy or sell securities, nor advice to do so. The users understands and acknowledges that there is a very high risk involved in trading securities. By using this information, the user agrees that use of this information is entirely at their own risk.
Thank you.

Punjab National Bank Flag Breakout Setup📈 Punjab National Bank (PNB) – Flag Breakout Setup
Observed a classic flag pattern on the daily chart after a strong pole move in 2023–24.
✅ Breakout above the channel confirmed with price action near 113.
✅ Entry plan: Watch for daily close >113 with volume.
✅ Stop-loss idea: Below 106.
✅ Target 1: 140 (first swing resistance).
✅ Measured move projection targets up to ~198 possible based on full flag pole.
Volume confirmation and broader market context will guide the actual trade trigger.

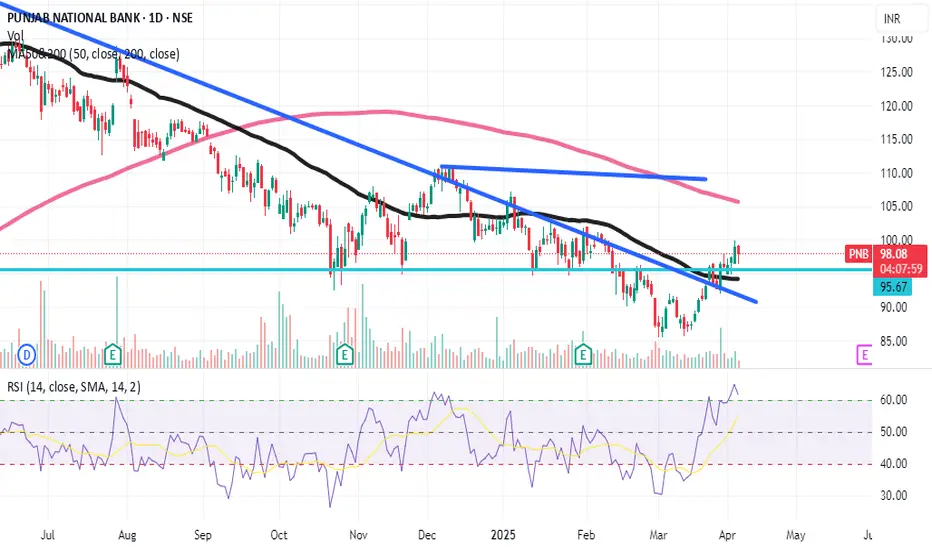
PNB Technical Analysis Simple Breakdown🔍 PNB
✅ Daily Chart:
PNB took support at the 200-day MA, forming a strong bullish candle — clear sign of buyer strength at a key level.
✅ Weekly Chart:
The stock closed above the 50-week MA, indicating momentum building on a higher timeframe.
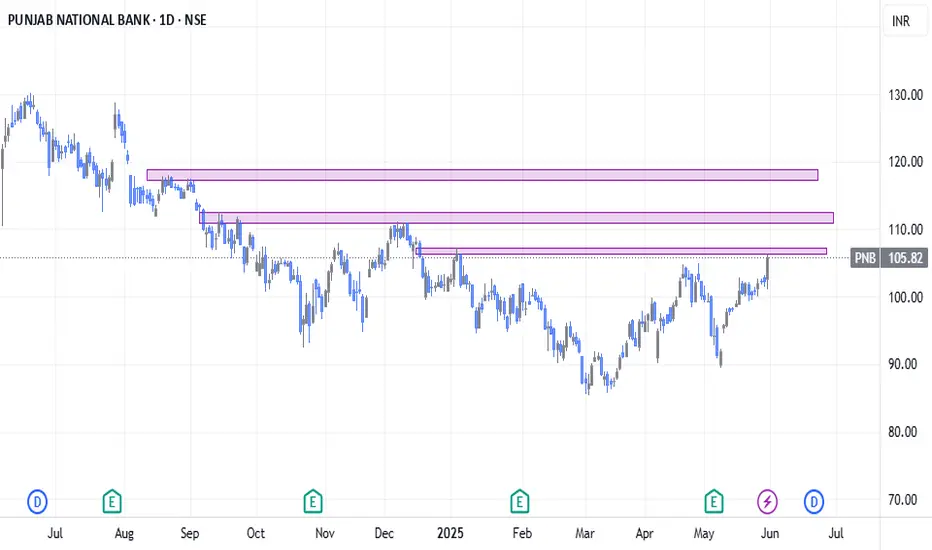
🧱 Resistance Zone Ahead – ₹107.20 to ₹112:
Price is nearing a supply zone. Sustaining above ₹107.40 with volume would indicate strength and continuation.
📌 What to Watch:
🔼 Buy Trigger:
Only consider a potential move if price sustains above ₹107.40 with strong momentum and volume confirmation.
💡 Conclusion:
PNB is showing strength with a bullish structure — holding 200 MA on daily and crossing 50 MA on weekly. Focus remains on price action near ₹107.40 for further movement.
📊 Refer to the zones marked in the above chart for better clarity.
⚠️ Disclaimer: This is purely for educational purposes. Not financial advice. Please consult your advisor before making any trading decisions.
Bullish in PNB CMP-100.80Punjab National Bank (PNB) appears to be entering a strong uptrend, supported by improving fundamentals and increasing momentum within the broader PSU banking space. With sector rotation favoring public sector banks, PNB stands out as a promising candidate poised to benefit from this shift.
Technicals are aligning with broader market sentiment, showing higher highs and strong volume accumulation. As PSU banks gain institutional and retail interest, PNB could be among the key beneficiaries in the upcoming leg of the rally.
Target: ₹112 (10–15% upside)
Stop-loss: Maintain a strict stop-loss at 5% below your entry to manage risk effectively.
This setup offers a favorable risk-reward ratio and aligns well with the ongoing bullish shake-up in the PSU banking sector.
PNB: Buy on Retest Level1. PNB has been an underperformer for a long time.
2. Looking at the strength at the current price, the buying opportunity appears attractive with a very small stop-loss.
3. This is not a very high-conviction setup since there is an overhead trendline resistance.
4. Since the risk is minimal, it is worth taking the opportunity. If it reverses, we accept the stop-loss and move on.
⚠️ Disclaimer: This is NOT a buy/sell recommendation for learning ONLY. Views are personal. Please, do your due diligence before investing. ⚠️
🔥 Happy Trading! 🚀

PNB looks bullish according to chart for long term investmentConfluence
1:retraced till 50% of trend
2:tapped fair value gap on MONTH
3: Showed rejection and sweeped
previous month
4: CHOC on daily
stop loss at 83
target 1 :- 135

PNB is really Trend shifting?High probability that trend shifting can be seen in PNB bank. On daily chart high probability of trend reversing with the support of 50 EMA. Also stock is trading above the resistance area. Can take long entry above 99 for the first target between 112-115. later we can trail the SL .This is for your educational purpose only.
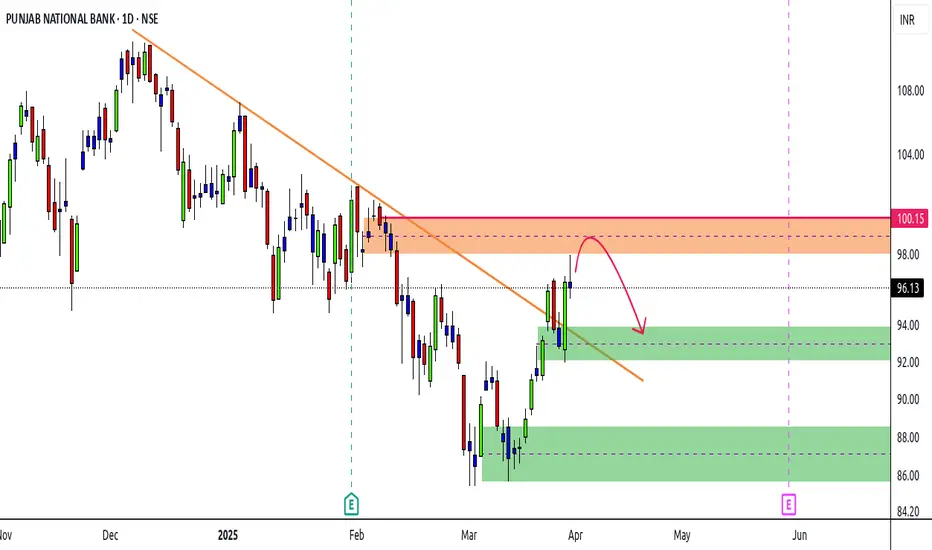
PNB | Possible PullbackStock making Higher Highs / Higher Lows in daily
Currently in DBD supply zone
Supply area from 98 - 100
Opportunity for a bearish move
Confirmation required on a lower TF
Downside 1st Target 93
Upside SL 101
PNB weekly It's took support from weekly time frame and bounce back so it ll go up to 110 and once it's break it next target 130, 145.

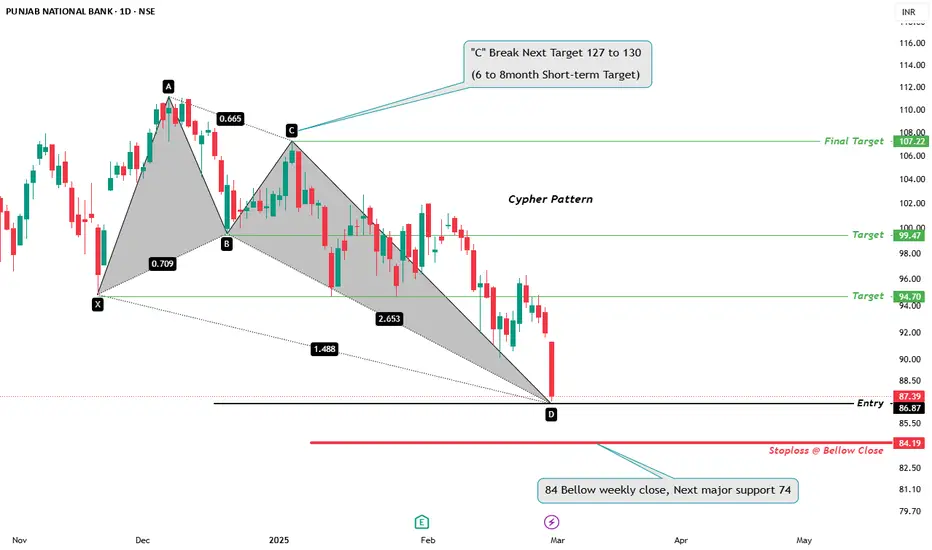
PNB Trade Setup**🚀 PNB Trade Setup - Key Levels to Watch! 📊📉**
📊 **Stock:** PUNJAB NATIONAL BANK (NSE)
🕒 **Timeframe:** 1D Chart
🔹 **Current Price:** **₹87.39**
🔹 **Entry Level: 86 to 87 ⚡
🔹 **Stoploss:** **Below ₹84.19** (If weekly close is below ₹84, next major support is ₹74)
🎯 **Bullish Targets:**
✅ **₹94.70**
✅ **₹99.47**
✅ **Final Target ₹107.22**
✅ **If 'C' Breaks, Next Target ₹127 - ₹130 (6-8 Months)**
🔻 **Bearish Breakdown Levels:**
🚨 **₹84 Breakdown → Next major support at ₹74**
💡 **Key Insights:**
✔️ **Cypher pattern completion at 'D' - Possible Reversal Zone!**
✔️ **Sustaining above ₹87.39 could lead to a strong bullish move** 📈
✔️ **Failure to hold ₹84 may result in further downside towards ₹74** 📉
⚠️ **Disclaimer:** This analysis is for **educational purposes only** and not financial advice. Trade wisely! 📊
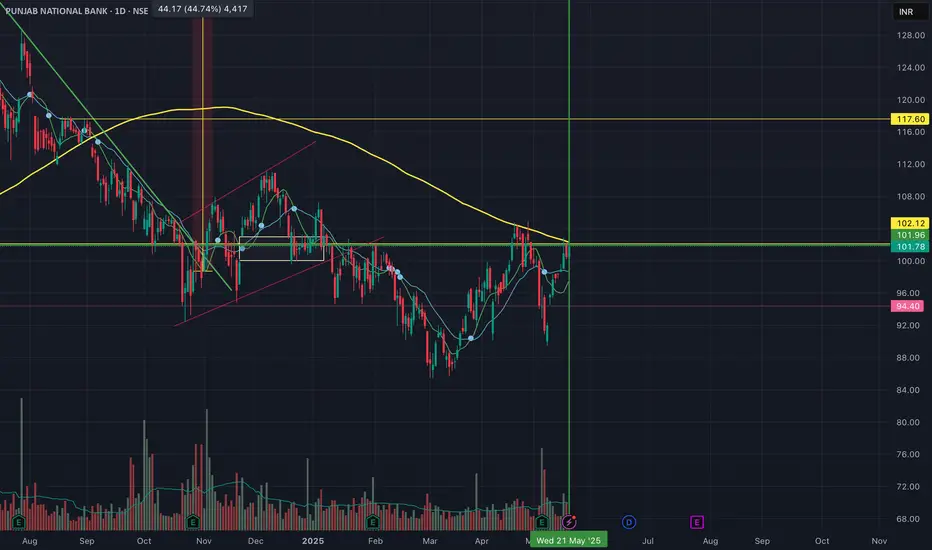
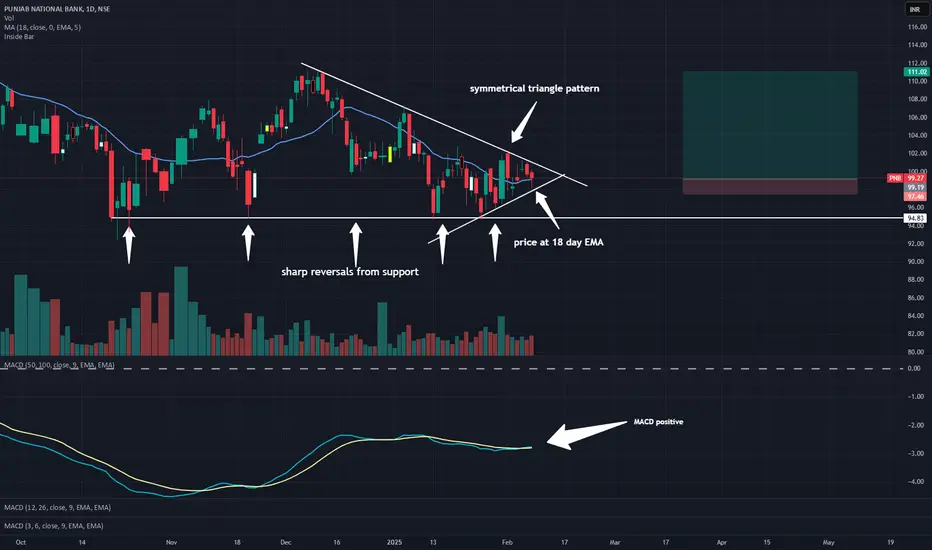
PNB-long for 10 %good valuation
price has a strong support at 95
priCe at 18 day EMA
Price forming a symmetrical triangle pattern
100-50 MACD positive crssover
target and SL marked
PNB weekly timeIt's forming double bottom in weekly time. Once it's break the trend line or above 100 in weekly the next target 110 and 123.
