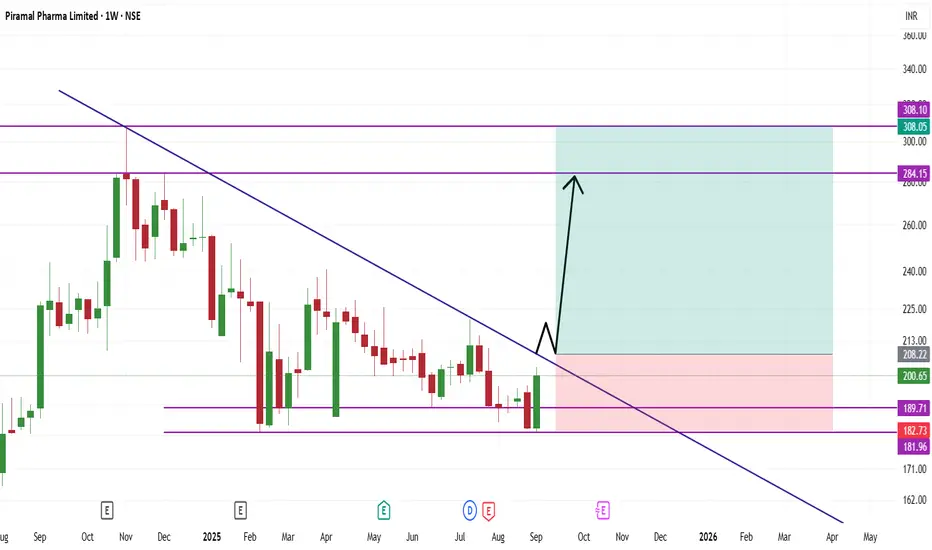
Positional or Long-term Opportunity in Piramal PharmaGo Long @ 203.6 for Targets of 229, 244, 259, and 287.1 with SL 186.9
Reasons to go Long :
1. On Weekly timeframe If we draw Fibonacci retracement from the recent swing low (A) to the swing high (B) then the stock took support from the 0.5 Fibonacci level.
2. In addition to this, the stock formed a Bullish Engulfing Pattern (marked with a orange color) around 0.5 Fibonacci level.
3. Also there is a strong demand zone (marked with a purple color) from which the stock is taking support.
PPLPHARMA trade ideas

Piramal Pharma Limited Trade Information
Traded Volume (Lakhs) 27.39
Traded Value (₹ Cr.) 55.02
Total Market Cap (₹ Cr.) 26,850.81
Free Float Market Cap (₹ Cr.) 12,472.07
Impact cost 0.04
% of Deliverable / Traded
Quantity 36.39 %
Applicable Margin Rate 19.92
Face Value 10.00
Price Information
52 Week High (06-Nov-2024) 307.90
52 Week Low (14-Feb-2025) 181.73
Upper Band 218.87
Lower Band 179.08
Price Band (%) No Band
Tick Size 0.01
Securities Information
Status Listed
Trading Status Active
Date of Listing 19-Oct-2022
Adjusted P/E 27,623.23
Symbol P/E 912.99
Index NIFTY SMALLCAP 250
Basic Industry Pharmaceuticals
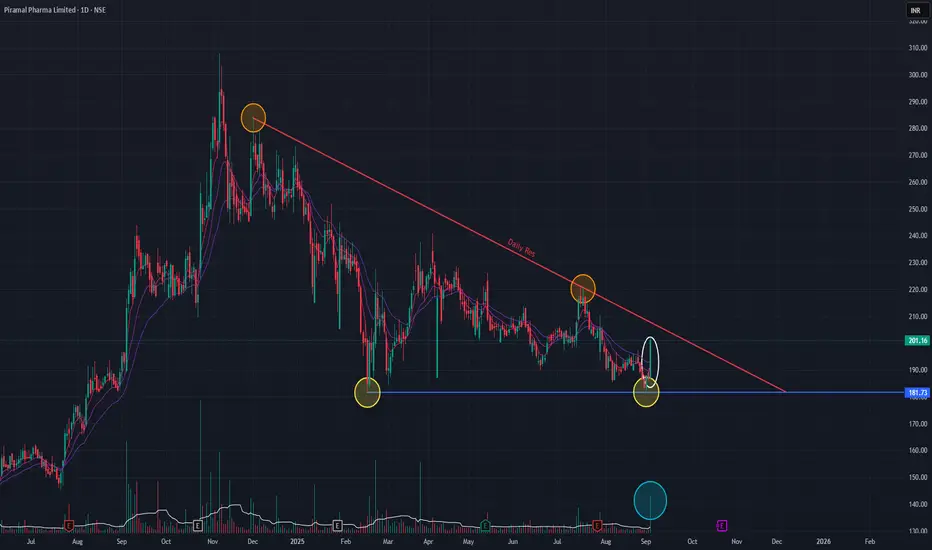
Piramal Pharma (Daily Timeframe) - Potential BreakOutPiramal Pharma, has formed a Double-Bottom chart pattern, indicating Bullish reversal. With today's bullish candle the volume has also spiked. We should watch out for the price action in the coming days. As indicated in the chart, resistance trendline is respected as well as the support trendline. If the stock has to move up, then it has to breach the resistance trendline.
Let's keep a watch on it.
PIRAMAL PHARMAthis attempted a breakout on daily chart and than retraction happened to retest the breakout; with NIFTY nosediving , the stock took a hit but with exact reversal the stock is back to continue with the breakout. on MACD there is a convergence and buying is witnessed on MACD on weekly charts. looks real good for an entry.
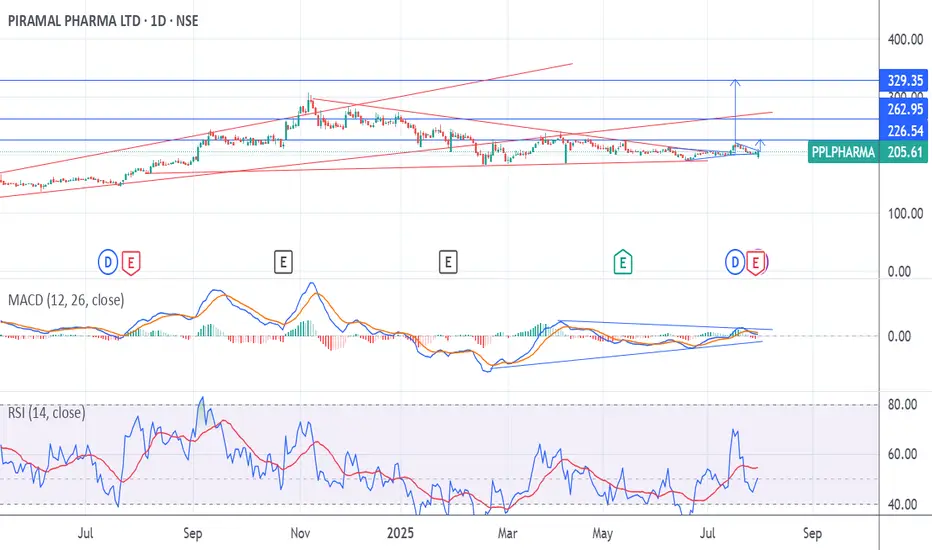
Piramal Pharma LtdPPLPHARMA - The stock shows a bullish bias as it is breaking out of a falling wedge pattern,
with a strong bullish candle surpassing the upper trendline.
The RSI indicates bullish divergence, further supporting the potential reversal.
Buy above 222, with target prices at 246 and 270.
Stop Loss: Set below 198 (the recent swing low).

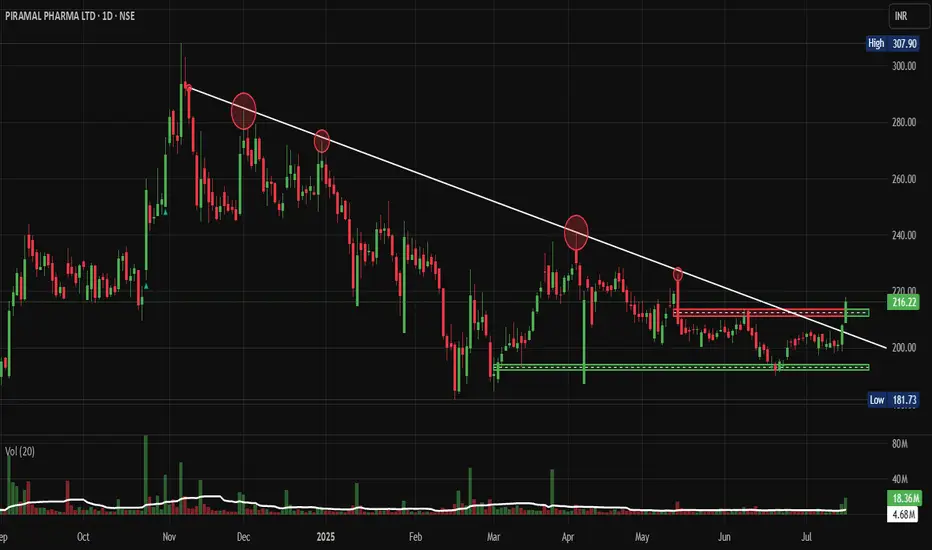
PPLPHARMA: 8 Month Slopping Downwards Trendline BreakoutNSE:PPLPHARMA : This Pharma Stock Broke Out of Its Descending Triangle Prison
Price Action:
- Current Price: ₹216.22 (as of July 15, 2025)
- 52-week Range: ₹181.73 - ₹307.90
- The stock has been in a clear descending triangle pattern since November 2024
- Price has been consistently making lower highs while finding support around the ₹190-200 zone
- Recent price action shows signs of consolidation near the apex of the triangle
Volume Spread Analysis:
- Average daily volume: 4.68M shares
- Volume spikes were observed during significant price movements in November 2024 and March 2025
- Recent volume has been relatively subdued, indicating a lack of conviction in either direction
- Volume pattern suggests an accumulation phase with periodic distribution
Key Technical Levels:
Support Levels:
- Primary Support: ₹190-200 (multiple tests, strong base)
- Secondary Support: ₹181.73 (52-week low)
- Psychological Support: ₹175-180 zone
Resistance Levels:
- Immediate Resistance: ₹230-240 (descending trendline)
- Secondary Resistance: ₹250-260 (previous swing high)
- Major Resistance: ₹280-290 (November 2024 high)
Base Formation:
- The stock has formed a solid base between ₹190-220 over the past 4 months
- This base represents a potential accumulation zone for institutional investors
- The horizontal support at ₹200 has been tested multiple times, showing its significance
Technical Patterns:
- Primary Pattern: Descending Triangle
- Secondary Pattern: Potential Cup and Handle formation if the stock breaks above ₹240
- The descending triangle spans approximately 8 months, making it a significant pattern
Trade Setup:
Entry Strategy:
- Breakout Entry: Buy above ₹240 with volume confirmation
- Support Entry: Buy near ₹200-205 for swing trade
- Conservative Entry: Wait for weekly close above ₹245 for momentum play
Exit Levels:
- Short-term Target: ₹260-270
- Medium-term Target: ₹290-300
- Long-term Target: ₹350-380
Stop-Loss Levels:
- For breakout trades: ₹225 (below breakdown level)
- For support trades: ₹185 (below 52-week low)
- Trailing stop: 8-10% below entry price
Position Sizing:
- Risk per trade: Maximum 2% of portfolio
- For ₹240 entry with ₹225 stop: Position size = (Portfolio × 0.02) / 15
- Suggested allocation: 1-2% of total portfolio for this trade
Risk Management:
- Maximum holding period: 3-6 months
- Review position if stock fails to break ₹240 within 4 weeks
- Partial profit booking at ₹270 (book 50% position)
- Trail stop-loss after first target achievement
Sectoral and Fundamental Backdrop:
Sectoral Analysis:
- The India Pharmaceutical Market size is estimated at USD 66.66 billion in 2025, and is expected to reach USD 88.86 billion by 2030, at a CAGR of 5.92% during the forecast period (2025-2030)
- India's pharmaceutical industry ranks third globally in pharmaceutical production by volume and 14th by value, supported by a well-established domestic sector comprising approximately 3,000 drug companies and over 10,000 custom manufacturing units
- The Indian pharmaceuticals industry is expected to grow 9-11% in the financial year 2024, as per ICRA
- The biosimilars market in India is expected to grow at a CAGR of 22%, reaching USD 12 billion by 2025, representing nearly 20% of the country's pharmaceutical market
Company Fundamentals:
- Market Cap: 28,745 Crore (up 42.2% in 1 year), Revenue: 9,151 Cr, Profit: 91.1 Cr
- Stock is trading at 3.53 times its book value
- The company has a low interest coverage ratio, Promoter Holding: 34.94%
- The P/E ratio of Piramal Pharma Ltd is 324 times as on 15-July-2025, a 651% premium to its peers' median range of 33.45 times
Business Overview:
- The company has a 49% ownership interest in a joint venture with Allergan India Pvt. Ltd (Avvyie, a US pharmaceutical company, holds a 51% ownership interest), which is one of the leading pharmaceutical companies in Ophthalmology formulations in India
- Strong presence in glaucoma and dry eye treatments
- Diversified portfolio across multiple therapeutic areas
Analyst Targets:
- Recent research reports show an average share price target of 253
- The estimated share price target for 2025 can range from ₹198 to ₹350
Investment Thesis:
Bullish Factors:
- Strong sectoral tailwinds with the Indian pharma market growing at 5.92% CAGR
- Solid base formation indicating institutional accumulation
- Reasonable valuation compared to growth prospects
- Strategic partnership with Allergan provides a competitive advantage
Risk Factors:
- A high P/E ratio indicates expensive valuation
- A low interest coverage ratio suggests financial stress
- Regulatory changes in the pharmaceutical sector
My Take:
NSE:PPLPHARMA presents a mixed technical picture with a descending triangle pattern Breakout but strong support base. The stock is at a crucial juncture where a breakout above ₹240 could lead to significant upside, while a breakdown below ₹190 would confirm further weakness. Given the positive sectoral outlook and the company's strategic positioning, a breakout trade above ₹240 with proper risk management offers favorable risk-reward ratio.
Keep in the Watchlist.
NO RECO. For Buy/Sell.
📌Thank you for exploring my idea! I hope you found it valuable.
🙏FOLLOW for more
👍BOOST if you found it useful.
✍️COMMENT below with your views.
Meanwhile, check out my other stock ideas on the right side until this trade is activated. I would love your feedback.
Disclaimer: "I am not a SEBI REGISTERED RESEARCH ANALYST AND INVESTMENT ADVISER."
This analysis is intended solely for informational and educational purposes and should not be interpreted as financial advice. It is advisable to consult a qualified financial advisor or conduct thorough research before making investment decisions.
Piramal Pharma - Cup & Handle - Weekly Time FramePiramal Pharma Ltd #PPL
CMP: 151
SL: 114 (WCB)
Targets: 175/ 196 / 230

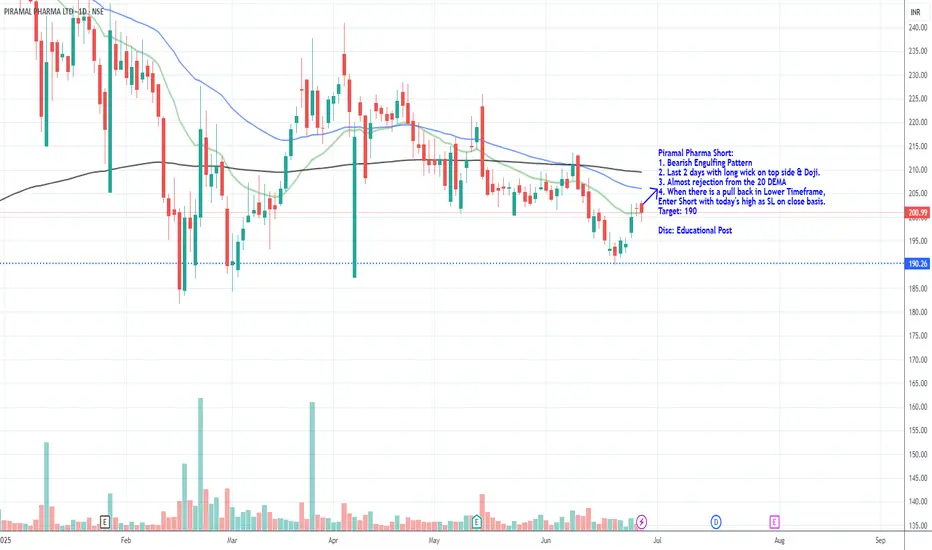
Piramal Pharma Short_Bearish Engulfing CandlePiramal Pharma Short:
1. Bearish Engulfing Pattern
2. Last 2 days with long wick on top side & Doji.
3. Almost rejection from the 20 DEMA
4. When there is a pull back in Lower Timeframe,
Enter Short with today's high as SL on close basis.
Target: 190
Disc: Educational Post
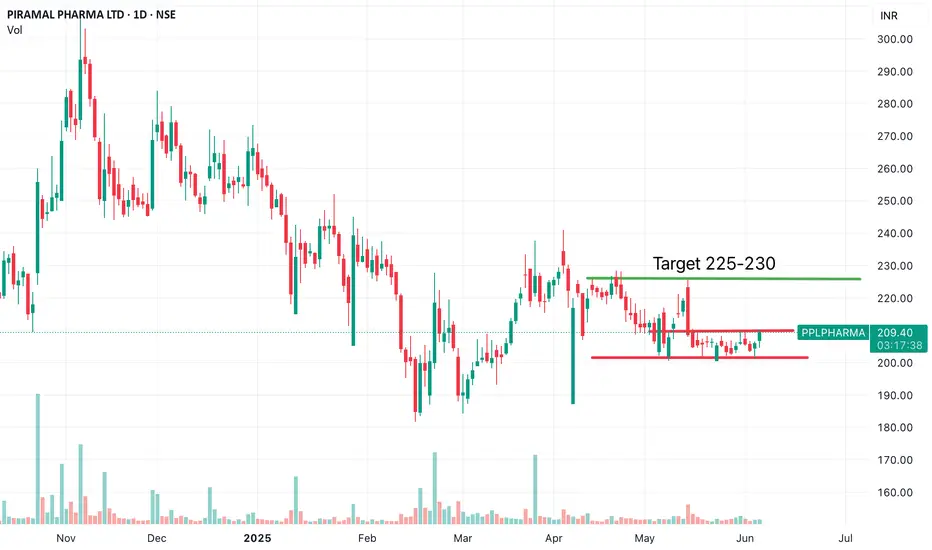
Piramal Pharma bottom fishing Piramal Pharma looks good for bottom fishing on chart. Buy above 210 with stop loss below 200 on closing basis. Target is 225-230 for short term investment. Fundamentally, margin is improving, net profit rising. When business is improving and price is ready to bounce, its perfect recipe for good entry
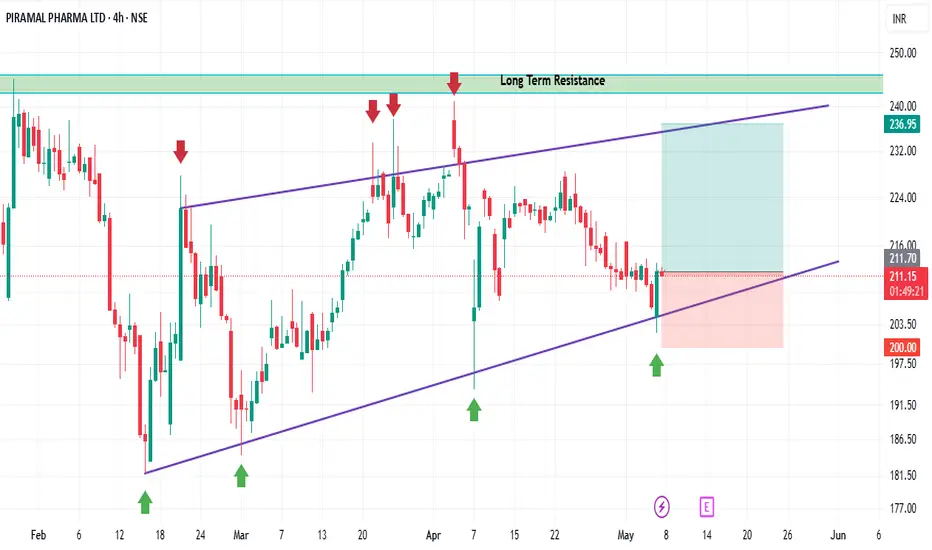
Strong Bullish Reversal at Support – ₹236 Target in Sight!Hello fellow traders! Hope you’re all doing well.
Today, I’d like to share my technical outlook on PIRAMAL PHARMA (PPLPHARMA).
Key Observations:
1. Rising Channel (Ascending Wedge): The price is currently respecting the lower trendline, which is acting as a key support zone.
2. Bullish Engulfing: A bullish engulfing pattern has appeared near the support line, indicating renewed buying interest.
3. Target: I’m anticipating a potential move toward ₹236, which aligns with the upper boundary of the channel.
4. Stop Loss : A strict stop loss is placed at ₹200 (closing basis). The setup remains valid as long as the trendline holds.
5. Risk-Reward Ratio: This trade setup offers a favorable 1:2 risk-to-reward opportunity.
Disclaimer:
This is a personal analysis and not financial advice. Please do your own research and trade responsibly. Risk management is key.
Thanks for reading!
Looking forward to your thoughts and feedback.
Best regards,
Anantesh
Piramal Pharma (PPLPHARMA) Stock Price Analysis**Piramal Pharma (PPLPHARMA) Indian Stock Price Analysis – April 22, 2025**
- **Current Price:** ₹220.70 (as of April 21, 2025)
- **Short-Term Trend:** Sideways to weak. The stock has been volatile, trading mostly between ₹217 and ₹225 in recent sessions
- **Recent Performance:**
- 1 week: +1.86%
- 1 month: +6.36%
- 3 months: –4.46%
- 1 year: +55.38%
- **Moving Averages:** The stock is above its 50-day moving average but below the 5-day, 20-day, 100-day, and 200-day moving averages, indicating mixed momentum and some weakness in the short term
- **Support:** ₹217
- **Resistance:** ₹225–₹231
- **Volatility:** High; the stock is 3.27x as volatile as the Nifty
- **Sector Comparison:** Underperforming its sector in the short term, but strong annual gains
- **Analyst View:** Mixed; some analysts suggest buying for the long term, but caution is warranted in the short term due to recent weakness
**Summary:**
PPLPHARMA has shown strong gains over the past year but is currently consolidating with a slight bearish bias. The price is range-bound, with support at ₹217 and resistance around ₹225–₹231. Watch for a breakout above resistance for renewed bullish momentum, or a drop below support for further downside risk

PIRAMAL PHARMAStock Overview: Piramal Pharma, NSE, current price: ₹226.72. Piramal Pharma is a pharmaceutical company involved in the development, manufacturing, and distribution of pharmaceutical products.
Key Levels:
Support (yellow zone): ₹155.77
Swing zone (green zone): ₹188.29 to ₹229.93
Technical Indicators:
RSI (Relative Strength Index): The RSI is currently at 52.54, indicating a neutral momentum as it is near the midpoint of the scale (50).
Volume: The volume is 55.27M, showing significant trading activity which can indicate investor interest and potential volatility.
MA (Moving Average): The SMA (Simple Moving Average) is at ₹203.91, suggesting that the stock is trading above its long-term average, which can be a bullish signal.
Sector and Market Context: Piramal Pharma's performance should be analyzed in the context of the pharmaceutical sector, which has been experiencing growth due to increased demand for healthcare products. The overall market trends show a mixed sentiment with some sectors performing better than others.
Risk Considerations: Potential risks include regulatory changes, market competition, and global economic conditions that could impact the pharmaceutical industry. Additionally, any adverse events related to drug approvals or recalls could influence the stock's movement.
Analysis Summary: Piramal Pharma shows potential for growth with key target levels identified. The stock is currently trading above its moving average, and the RSI indicates neutral momentum. Investors should consider sector performance and market conditions, along with potential risks, before making any investment decisions.

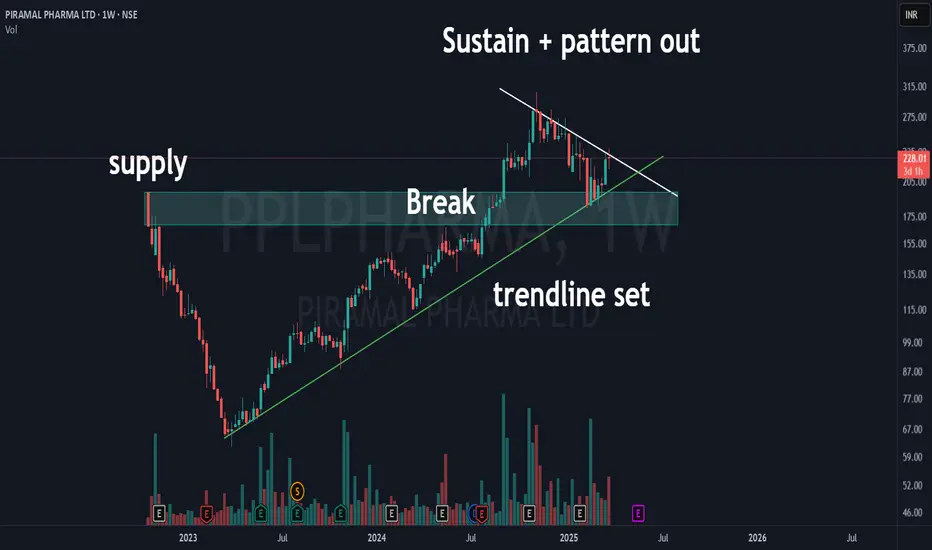
Piramal Pharma Yet to Breakout? | MotherBar + CT + Supply DemandPiramal Pharma Ltd is at a critical juncture! 🚀 The stock is consolidating within a counter trendline (CTL) while respecting the rising trendline support.
Key highlights:
✅ Mother Candle Formation - A large weekly candle acting as a range.
✅ Counter Trendline Breakout Watch - Price is still testing resistance, a breakout could trigger momentum.
✅ Demand Zone Support - The highlighted zone could act as a buying area.
✅ Volume Analysis - Increasing volumes hint at potential accumulation.
Will this breakout or get rejected? Let’s watch price action carefully! 📊🔥
PIRAMAL PHARMA: Relatively strong for long!1. Expecting trendline breakout.
2. Expecting to form the lower high to go for a higher high.
3. High probability setup in WTF.
4. Took dynamic support from EMA.
WTF:

UPCOMING SET UP SERIES SCRIPT - 18SHARED ANALYSIS based on purely price action only for a technical aspect. Described level does not need to necessarily be observed….
KEEP ADDING to your watchlist and wait patiently.
LONG TERM INVESTORS can use described levels to accumulate OR hold….
PPLPHARMA#PPLPHARMA
Adding this to the watch list. Trading in a tight range around 10 EMA. I will enter the stock once it breaks out from the range.

Evening Star - A Typical ExampleEvening Star
Evening star patterns are associated with the top of a price uptrend, signifying that the uptrend is nearing its end
The evening star pattern is considered to be a very strong indicator of future price declines. Its pattern forms over three days:
The first day consists of a large white candle signifying a continued rise in prices.
The second day consists of a smaller candle that shows a more modest increase in price.
The third day shows a large red candle that opens at a price below the previous day and then closes near the middle of the first day

Bullish Momentum for Piramal Pharma Above 235, Targeting 285+Details:
Asset: Piramal Pharma Limited (PIRAMALPHARMA)
Breakout Level: 235
Potential Target: 285+ with potential for further gains
Stop Loss: Below 235 or as per risk tolerance
Timeframe: Short to medium-term
Rationale: Piramal Pharma has shown strong bullish momentum above the 235 level, and it is now targeting 285. The stock's technical indicators suggest continued strength, positioning it for a further upward move if it sustains this breakout.
Market Analysis:
Technical Setup: Breaking and sustaining above 235 suggests an ongoing bullish trend, with 285 as the immediate target.
Bullish Indicators: Price action above 235 with significant buying volume implies a bullish sentiment that could drive the stock even higher.
Price Target:
The initial target is 285, with room for further gains if momentum continues.
Risk Management:
A stop loss below 235 is recommended to manage risk in case of reversal.
Timeframe:
The move towards 285+ is expected in the short to medium-term, subject to sustained buying pressure and market support.
Risk-Reward Ratio: Favorable, with limited downside below 235 and strong upside potential, making it a bullish setup for near-term gains.
Monitor market trends and volume to confirm sustained bullish momentum and consider the broader market sentiment as you track Piramal Pharma’s movement.

PPL PHARMA#Pirmal group Pharma company given good
#Volume #Breakout in
#Daily chart. They are into #Pharmaceuticals - Indian - Bulk
#Drugs & Formin business for over a decade.
#PPLPHARMA CMP 268 TGT 300 SL 250 (Weekly Clbs)
#Profit #Growth witnessed in last two years with good ROCE
Good FII+DII Holding #Formulation #Pharma
Follow us for more such suggestions.

Breakout From Tight Consolidation Range With VolumesNSE:PPLPHARMA today broke from the Narrow Consolidation Phase. After the previous Breakout in the consolidation phase, letting the 50 EMA Catch up, There Was continuous accumulation, as you can see from the volume intensity in the range. Today, on the back of magnificent Q2 FY 24-25 results, The Stock has blasted to a new All-Time High.
View:
Although the Stock is Overvalued at 588 P/E. Investors Should do Stock SIP or Buy on DIPS and Traders Should Wait for a Retracement to 50 EMA or a Good Consolidation Going Forward.
NSE:PPLPHARMA is part of the Piramal group of companies. The company operates through 3 major segments.
1) Contract development and manufacturing organisations (CDMO)
2) Complex hospital generics (critical care)
3) Consumer Healthcare, Over-the-Counter (OTC)
NSE:PPLPHARMA entered the Pharma space in 1988 with the acquisition of Nicholas Laboratories and grew through a series of Mergers & Acquisitions and various organic initiatives. In 2010 the Domestic formulations business was sold to About $3.7 billion and Diagnostic Services were sold to Super Religare Laboratories (SRL).
🙋♀️🙋♂️If you have any questions about this stock, feel free to reach out to me.
📌Thank you for exploring my idea! I hope you found it valuable.
🙏FLLOW for more
👍BOOST if useful
✍️COMMENT Below your views.
Meanwhile, check out my other stock ideas below until this trade is activated. I would love your feedback.
Disclaimer: This analysis is intended solely for informational and educational purposes and should not be interpreted as financial advice. It is advisable to consult a qualified financial advisor or conduct thorough research before making investment decisions.

PIRAMAL PHARMA LTDStock broke out with 150 m volume and then tightening at right side with low volume. But stock again broke out with flag pattern with 130 million volumes. Even though market in down trend stock holding with strong trend.

VIEW ON PIRAMAL PHARMAStock at all time high
Good volume addition in the stock
More up move possible in the stock
Target 270/300
Stop loss 225
I am just representing my views
For educational purpose only.

PPLPHARMA STRONG BULLISH CANDLEPiramal Pharma Ltd
Strong Bulish candle formation after QTR Result of company
good QTR result
and breakout found on chart good levels for entry after a pullback
or INTRADAY continuation trade with strict Stop Loss
**Disclaimer:** This information is for educational purposes only and does not constitute financial advice or a recommendation to buy or sell any securities. Always do your own research and consult with a financial advisor before making investment decisions.
