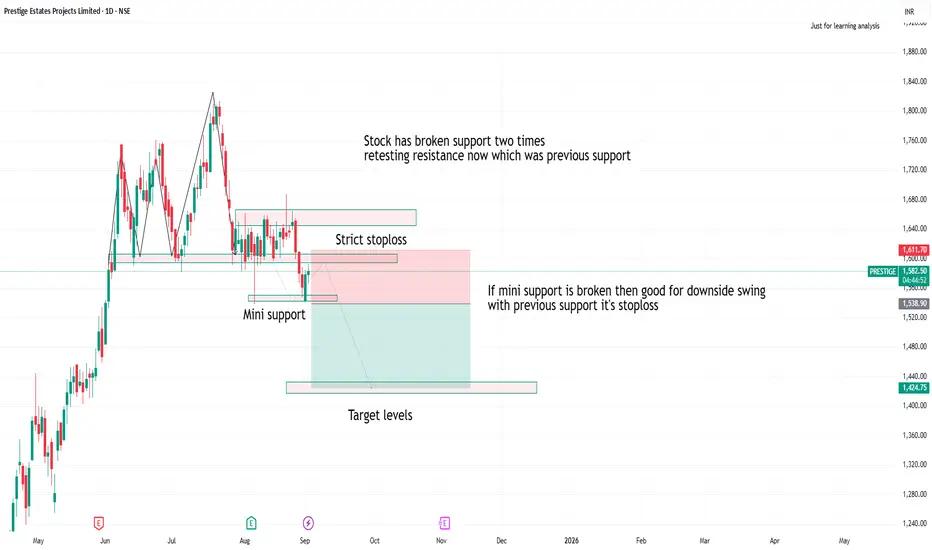
Prestige testing resitanceprestige has broken support second time
if breaks mini support levels good for downside with strict stoploss and targets
PRESTIGE trade ideas
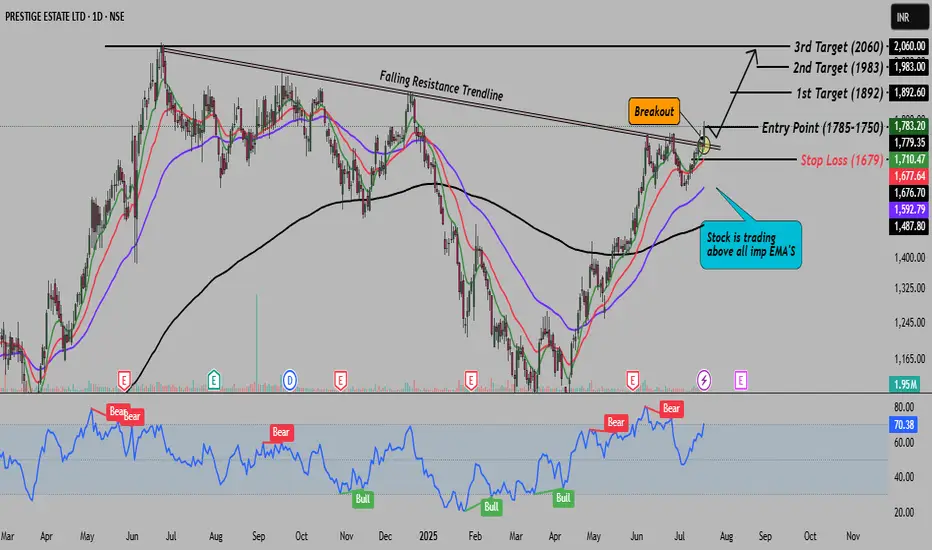
Prestige on breakout, this is ready to fly in blue sky!Hey Traders! Today, I’m sharing a stock that has broken out from a falling resistance trendline. This breakout sets the stage for a potential move towards its all-time high zone. It looks promising for both short-term and long-term trades. In my opinion, this could be a solid trade for the next few days.
Here’s what you need to know:
The stock has broken above a key falling resistance trendline.
This sets up a potential move towards the all-time high zone.
For better risk-reward, I suggest trading with smaller quantities.
Don’t forget to use the stop loss marked on the chart for risk management.
Please trade wisely and according to your own risk tolerance.
Disclaimer: This analysis is for educational purposes only. Always consult a financial advisor before making any investment decisions.
PRESTIGE – Bullish Continuation with Aggressive Call Build-Up________________________________________________________________________________📈 PRESTIGE – Bullish Continuation with Aggressive Call Build-Up
📅 Setup Date: 18.07.2025 | ⏱ Timeframe: Daily
📍 Strategy: Options Trade Setup
________________________________________________________________________________
Overall Bias: Bullish
Spot Price: ₹1,783.2
Trend: Uptrend resumption with aggressive Call OI build-up
Volatility: IV slightly falling in puts, rising in calls → good for defined risk bullish setups
Ideal Strategy Mix: Bullish with defined reward → Bull Call Spread or Naked CE
________________________________________________________________________________
1. 🔼 Bullish Trade (Naked options as per trend)
Best CE: Buy 1800 CE @ ₹49.10
Why:
• Strong Long Build Up with OI up 225%
• Massive volume (1.78L contracts) and ₹33.2 Cr TTV → clear interest
• Decent delta (approx. 0.5–0.55) → good sensitivity to price movement
• Strike closest to spot + high liquidity = ideal for directional trade
________________________________________________________________________________
2. 🔽 Bearish Trade (Naked options as per trend)
Best PE: Sell 1740 PE @ ₹28.6
Why:
• Price down 46% with high volume (4.2L) = put writing
• OI dropped 6.94% → likely unwinding from short bias
• Deep OTM with stable delta (-0.25 approx)
• Favorable if bullish view sustains and price stays above ₹1,740
________________________________________________________________________________
3. ⚙️ Strategy Trade (As per trend + OI data)
Strategy: Call Debit Spread → Buy 1780 CE + Sell 1820 CE
Net Debit: ₹57.3 - ₹41.1 = ₹16.2
Max Profit: ₹40 (spread) - ₹16.2 = ₹23.8
Max Loss: ₹16.2
Risk:Reward ≈ 1 : 1.47
Lot Size: 450
Total Risk: ₹7,290
Max Profit: ₹10,710
Why:
• 1780 CE shows explosive Long Build Up (OI ↑1031%) → active strike for bulls
• 1820 CE also shows strong Long Build Up (OI ↑1000%) → defined bullish target
• Much better R:R than 1800–1840 while staying aligned with trend
• Defined risk with improved capital efficiency and lower theta burn
________________________________________________________________________________
📘 My Trading Setup Rules
Avoid Gap Plays
→ Check pre-open price action to avoid trades influenced by gap-ups/gap-downs.
Breakout Entry Only
→ Enter trades only if price breaks previous day’s High (for bullish trades) or Low (for bearish trades).
Watch Volume for Confirmation
→ Monitor volume closely. No volume = No trade.
Enter on Strong Candle + Volume
→ Execute the trade only if a strong candle appears with increasing volume in the direction of the trade.
Defined Risk:Reward Only
→ Take trades only if R:R is favorable (ideally ≥ 1:2).(Safe R:R – 1:1)
Premium Disclaimer
→ Option premiums shown are based on EOD prices — real-time premiums may vary during execution.
Time Frame Preference
→ Trade with your preferred time frame — this strategy works across intraday or positional setups.
________________________________________________________________________________
⚠ Disclaimer (Please Read):
• These Trades are shared for educational purposes only and is not investment advice.
• I am not a SEBI-registered advisor.
• The information provided here is based on personal market observation.
• No buy/sell recommendations are being made.
• Please do your own research or consult a registered financial advisor before making any trading decisions.
• Trading involves risk. Always use proper risk management.
I am not responsible for trading decisions based on this post.
________________________________________________________________________________
💬 Found this helpful?
Drop your thoughts or questions in the comments below ⬇️
🔁 Share this post with your trading community – let them benefit from clean charts, structured setups, and zone-based learning.
✅ Follow simpletradewithpatience for charts, clean setups, and educational content based on price action, zones, and risk-managed trades.
🚀 Trade with patience, trust your charts, and stay clear-headed!
Be Self-Reliant | Trade with Patience | Learn with Charts & Zones 📊________________________________________________________________________________
Buy Prestige Estate target 1773/1831
After completion of sub-wave 3 of wave (iii) on 9 June, Prestige Estate has been undergoing correction in the form of a flat (3-3-5) (sub-wave 4) and in all probability has completed the same.
All the wave markings are given in the chart.
It is expected that stock may complete sub-wave 5 (i.e. wave iii) at fibo level of 0.382 / 0.5 / 0.618 of the length of sub-wave 3 measured as a fibo extension and thus providing a target of 1773 / 1831. Maintain stoploss of 1753 (below the swing low).
Will update change in target if any as wave unfolds.
Happy Trading !!

Prestige Peaking, Sellers Sneaking?
Technical Setup:
• Multiple Supply Zones:
Price failed to hold above ₹1,720, which was a critical resistance from a previous top (June 11). Current rejection confirms supply at the top.
• False Breakout & Bearish Rejection:
Attempt to break the upper range failed, followed by a sharp red candle engulfing prior green candles. This suggests sellers have stepped in strongly.
• Volume Spikes:
Volume on the rejection candle is higher than average, reinforcing strong institutional selling.
• Exhaustion After a Sharp Rally:
The recent steep uptrend now shows signs of exhaustion, especially near known resistance zones. A retracement is likely.
⸻
Trade Details:
• Sell Below: ₹1,708
• Stop Loss: ₹1,726
• Target 1: ₹1,670
• Target 2: ₹1,640
• Target 3: ₹1,620
• Risk-Reward: ~1:2.5+
⸻
Narrative Summary:
Prestige saw a vertical rally but hit a brick wall near ₹1,720, the same zone that caused a fall earlier. It’s showing signs of a classic lower high formation. The structure looks ripe for a breakdown, especially as volume spikes during red candles.

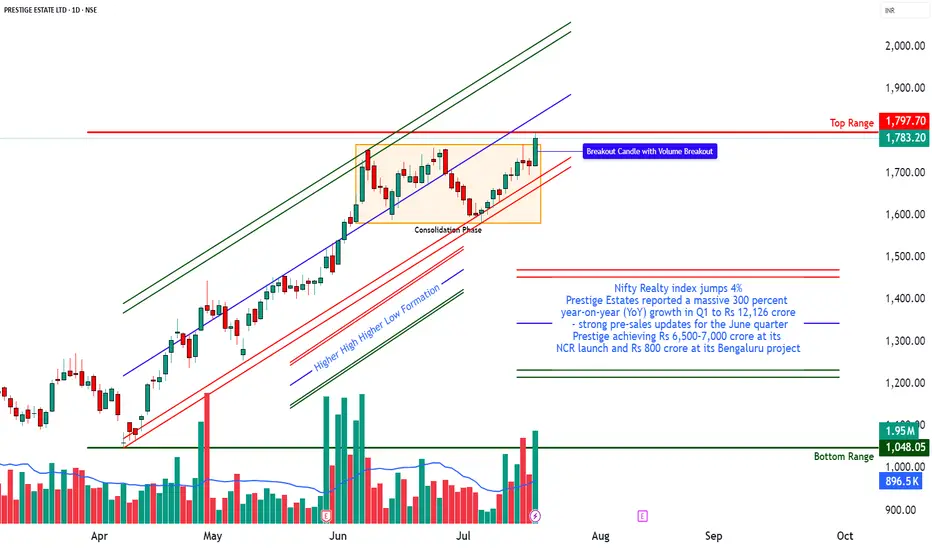
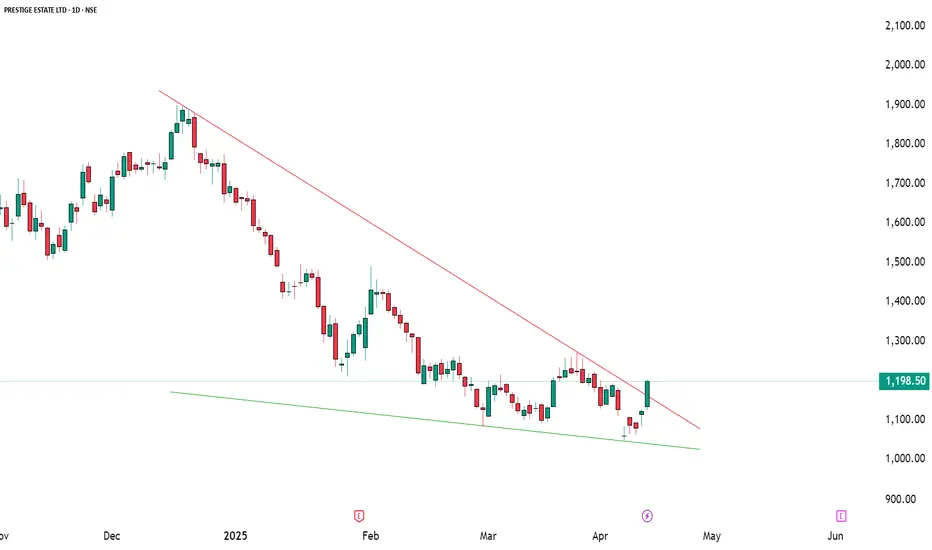
Prestige Estate: Trading strategy For both buy/sell:
Buying strategy on breakout of the resistance trendline:
Target is T1 and T2, i.e., 1900 and 2075, respectively.
On rejection of this trendline, prices will fall to 1561.50 and 1442 as T1 and T2 as part of a selling strategy.

Prestige: High-rise… or nosedive?
Bearish Thesis
Prestige Estate has approached a critical supply zone (~₹1688–₹1692), where multiple prior attempts to break higher have failed. The current price action shows signs of exhaustion and supply absorption, making this a strong candidate for a short-term mean reversion play.
⸻
Technical Reasons to Sell
1. Bearish Rejection from Resistance
The price has formed an upper wick near resistance, suggesting seller dominance and lack of conviction above ₹1690.
2. Low Volume on Breakout Attempt
The attempted breakout into the resistance zone lacks strong volume confirmation, weakening the bullish continuation narrative.
3. Sharp Rally Preceding Resistance Test
The move into resistance is almost vertical, making it vulnerable to a pullback or profit booking, especially after ~₹100 rally from ₹1580s.
4. Historical Supply Zone
The zone between ₹1688–₹1692 has repeatedly acted as a supply area, as seen on the left side of the chart, where price previously turned down.
5. Bearish Divergence Setup Potential (if confirmed)
Any momentum indicators (not shown here, but likely RSI/MACD) may start showing divergence with price nearing overbought territory.
⸻
Trade Setup
• Sell Entry: ₹1682–₹1688
• Stop Loss: Above ₹1695 (room for a false breakout)
• Target 1: ₹1640
• Target 2: ₹1625
• Holding Period: 3–5 sessions
Reward-to-Risk Ratio: ~2.5:1
Suitable for tactical short with tight risk control.
⸻
Caveats
• If the price closes above ₹1695 with volume, abort the trade—it would indicate a strong breakout from the range.
• This is a counter-trend play in a strong intraday uptrend, so expect some volatility.

PRESTIGE - Bearish on Short term?Primary Analysis:
Internal counts are marked within the chart in smaller TF. For counts on Larger TF, read through the post to get complete overview.
Price seem to have completed first leg of impulse move (1048 to 1445) and was in the corrective mode since the start of May Series. The first leg of the correction (A wave down) was also attributed to the harmonic Shark pattern completion PRZ and retraced to 50% of the CD leg.
The B leg moved up from 1255 to 1535 and is getting rejected at the resistance zone.
I am terming it as B wave because it is resisting exactly at the 1.382 fib extension (maximum allowed for B waves in IRREGULAR FLAT corrections)
If the price closes above 1520, then, this view becomes invalid and recount needed. For now, this is my primary view.
If (as per my view) we have completed B at 1535, then C leg down should be sharp and impulsive in nature (similar to 3rd wave); and it should go below A at 1255
I see a FVG at 1160 levels, and I think the C wave could potentially test that (if this view plays out)
Other Observations:
In the simple price action chart, price is at the resistance (confluence of previous support turning resistance) zone and is expected to fall a bit. But the price managed to consolidate around the resistance zone for over 2 weeks, and formed pocket pivot for strong breakout, targeting the falling trendline at 1600-1700 zones; However, the breakout didn't hold (one can attribute the results not being good as a reason though) and started falling.
Long Term View:
Here is the count on Weekly TF
We are now at the final 5th, of which, 1st wave is done and 2nd is halfway. One can patiently wait for the 3rd wave to commence, as it would be highly rewarding.
Disclaimer: I am not a SEBI registered Analyst and this is not a trading advise. Views are personal and for educational purpose only. Please consult your Financial Advisor for any investment decisions. Please consider my views only to get a different perspective (FOR or AGAINST your views). Please don't trade FNO based on my views. If you like my analysis and learnt something from it, please give a BOOST. Feel free to express your thoughts and questions in the comments section.

Prestige Falling? Time to Sell the Dream House!
Trade Setup: Sell Prestige Below ₹1590 – Intraday Idea
Technical Rationale:
• Prestige is trading along a steep rising trendline, and a break below ₹1590 would signal a trendline breach, opening the door to a potential pullback.
• Price has retested a resistance zone near ₹1600 multiple times and failed to sustain above it, forming a possible short-term double top.
• The volume spike on the red candle near resistance hints at profit booking or distribution at higher levels.
Trade Plan
• Sell Trigger: Below ₹1590 (confirmation with a 15-min close below the trendline)
• Targets:
• T1: ₹1572 – minor support
• T2: ₹1555 – previous consolidation base
• T3: ₹1530 – deeper support (if weakness sustains)
• Stop-Loss: Above ₹1605 (just above recent resistance and invalidation point)
Bias & Context
• Bias: Bearish (on trendline breakdown)
• Timeframe: Intraday to 1–2 days
• Market Structure: Midcap Overbought short-term, near key supply zone

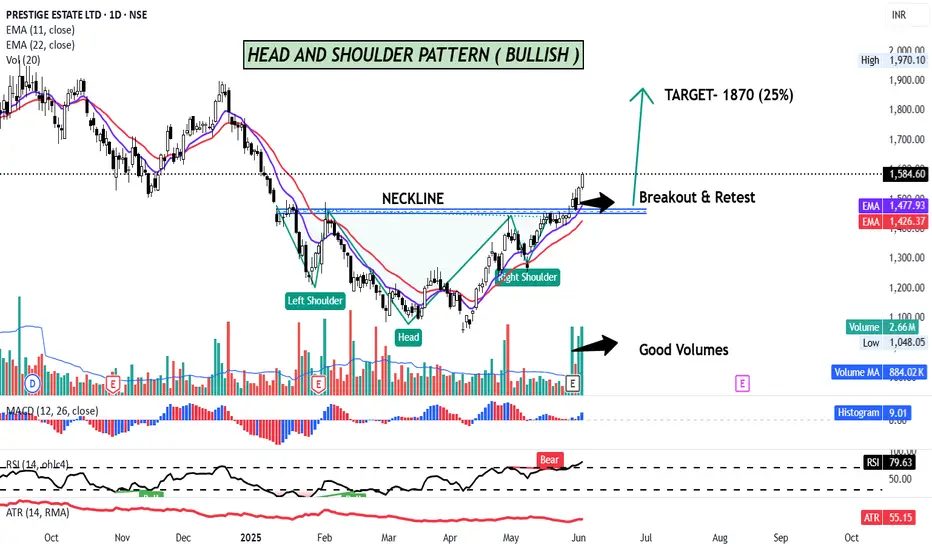
Inverse Head & Shoulder Pattern Breakout ( Bullish )Prestige Estate broke the neckline of the Inverted Head and Shoulder on the daily chart with decent volumes and it is looking good for an upside run. To confirm the validity of the neckline it has retested the neckline, took support and moving higher.
An inverse head and shoulders pattern is a bullish reversal chart pattern that indicates a potential end of a downtrend and the start of an uptrend. This pattern suggests weakening bearish sentiment and a potential shift in market dynamics towards buyers.
There is a sectoral tailwind also as all the realty stocks are outperforming in anticipation of the rate cut from RBI.
On the Daily timeframe, the stock is trading above its 11 day EMA and 22 day EMA, RSI is at 80 and MACD is above zero line, suggesting positive bias.
CMP - 1584
TARGET- 1870(25%)
SL- 1400
Disclaimer: This is not a Buy/Sell recommendation. For educational purpose only. Kindly consult your financial advisor before entering a trade.
PRESTIGE ESTATES LTDPRESTIGE Estate Ltd view for Intraday 2nd May #PRESTIGE
Resistance 1385 Watching above 1387 for upside movement...
Support area 1360 Below 1360 ignoring upside momentum for intraday
Watching below 1358 for downside movement...
Above 1385 ignoring downside move for intraday
Charts for Educational purposes only.
Please follow strict stop loss and risk reward if you follow the level.

Prestige Estate – Bullish Structure DevelopingPrestige Estate – Bullish Structure Developing After Prolonged Correction
📅 Date: April 16, 2025
📈 Chart Type: Daily | Exchange: NSE
💡 Purpose: Educational Analysis
🔍 Price Action Overview
After an extended downtrend, Prestige Estate appears to be forming a potential trend reversal structure. A strong bullish candle has emerged from a key support zone, accompanied by multiple technical confirmations that indicate renewed buying interest.
📌 Key Technical Highlights
📉 Downtrend Line Break: The stock has convincingly broken above a descending trendline, indicating a potential shift in trend dynamics.
📊 Indicators Triggered:
✅ RSI Breakout: Momentum is turning positive.
✅ MACD Crossover: Bullish signal crossover observed.
✅ Bollinger Band Squeeze Off: Suggests upcoming volatility with a directional move.
📍 Volume Surge: A notable spike in volume supports the strength of the breakout candle.
🧱 Support and Resistance Zones
🟢 Support Levels:
S1: ₹1148
S2: ₹1098
S3: ₹1071
Broad Support Zone: ₹1000–1050 (marked as Weak Support)
🔴 Resistance Levels:
R1: ₹1272 (Pattern Entry Level)
R2: ₹1252
R3: ₹1302
Major Resistance: ₹1900–2000 (Long-term supply zone)
🔄 Entry Reference Levels (For Educational Illustration Only)
✳️ Early Entry Reference: Above ₹1203
A close above ₹1203 indicates sustained strength and potential continuation.
🧩 Pattern Breakout Entry Reference: Above ₹1272
A breakout above ₹1272 could confirm a larger reversal pattern with room to test higher resistance levels.
⚠️ Important Disclaimer
This analysis is strictly for educational purposes and aims to help readers understand price structure, support/resistance zones, and indicator alignment. It does not constitute investment advice or a buy/sell recommendation. Always consult a registered financial advisor before making any investment decisions. Market participation involves risk and capital protection should be a priority.
📘 Conclusion
Prestige Estate is currently at a critical juncture where momentum indicators, volume, and price action are aligning for a potential upside continuation. Close monitoring of key breakout levels and market conditions will be crucial for informed decision making.
🔔 Let us know your thoughts in the comments – Do you see strength sustaining above ₹1203?
📊 Poll: Will Prestige Estate reclaim ₹1300 in the coming weeks?
A rally to make money and exitPrestige Estate CMP 1144
So my bet will be on this counter. the rally from here can go all the way to 1530. This is a good 30 odd percent from the current levels.

view on prestige estates ltdPrestige estates projects ltd
Current price: 1437 as on 1/02/2025
The stock is trying to get back into its channel in daily chart. It should cross and sustain above 1504 for target of 1640. Failed to get back in channel will pull it back to 1260 and 1200.

Buying opportunity in PRESTIGE ESTATE LTDPRESTIGE ESTATE LTD is in Double Correction.
The maximum target for wave (Y) of double correction is 161.8% extension.
We can see that price is near 161.8% so here we can buy this stock with stoploss below 1185.
The target will be minimum 38.2% retracement of entire move i.e. 1528
This analysis is based on Elliott Wave theory and Fibonacci.
This analysis is for educational purpose only.

Prestige - Trading below Demand zoneCMP: 1594
1616 was the low of the wide range bar formed on 2nd Dec. Price closed below that yesterday and the attempt to regain has failed in the first hour today.
On EW counts, looks like WXY is in play for now. And the Y wave will have to go below 1500 to complete the pattern.
On Indicators :-
Price is Trading below Cloud
Price is Trading below 200 DEMA
Daily RSI below 40
With an SL of 1616 (DCB), this stock is giving a good LRHR set up to short.
I am not a SEBI registered Analyst. Views are personal and for educational purpose only. Please consult your Financial Advisor for any investment decisions. Please consider my views only to get a different perspective (FOR or AGAINST your views). Please don't trade FNO based on my views.

PRESTIGE LONGGGPRESTIGE ESTATE LTD is looking strong upside.
Entry for swing trade
You can go for it after doing your own analysis.
entry price, target and stop loss has been updated in the chart.
ONLY FOR EDUCATIONAL PURPOSE..!

Prestige looks interesting confirmation above 1900Stock above key EMA and gave a pivot breakout with good volumes can be added here and then more above 1900 which will mark trendline breakout, volume profile poc and range of high volume bar

21 + 200SMA PULLBACK - PRESTIGEVery good setup is forming now.
first consolidation near 200SMA and wentup.
now surpass 21SMA.
only concern is volume not much during price up.
Two important overhead resistance to be break.

PRESTIGE -Symmetrical triangle - Breakout - DailyName - PRESTIGE
Pattern - Symmetrical triangle Breakout
Timeframe - Daily
Volume - Avg volume
Cmp - 1884
Target - 2491
SL - 1873 or low of the Breakout candle - 1775
Always welcome for any comments with your feedback or give it a like if you find it useful.

#PRESTIGE Poised for a Bull Run!🚀 Stock Alert: #PRESTIGE Poised for a Bull Run! 🚀
📈 Momentum in Play: The recent session saw a huge volume build-up, and #PRESTIGE is now trading above the 50-day moving average. It's nearing its all-time high again, with momentum suggesting a bullish run ahead. This makes it a strong candidate for a swing trade. 🔥
💡 Keep #PRESTIGE on your watchlist for potential opportunities! 👀
📢 Disclaimer: This post is for educational purposes only. Always do your own research before making any investment decisions. 💼
#StockMarket #Trading #InvestSmart
Target: 2160-2250
Stop Loss: 1775

Encouraging Setup in PrestigeChannel based movement evident in last few months for PRestige Estate. SEtup is quite interesting, but volume still lower. I would have one eye on volumes to give some signs of brekaout. ideal sl 499

Prestige estates Cup and Handle formationStock Name : Prestige Estates
Pattern: Cup and Handle Formation
Target 1: length og handle 1500
Target 2: cup base to Breakout level 1880
