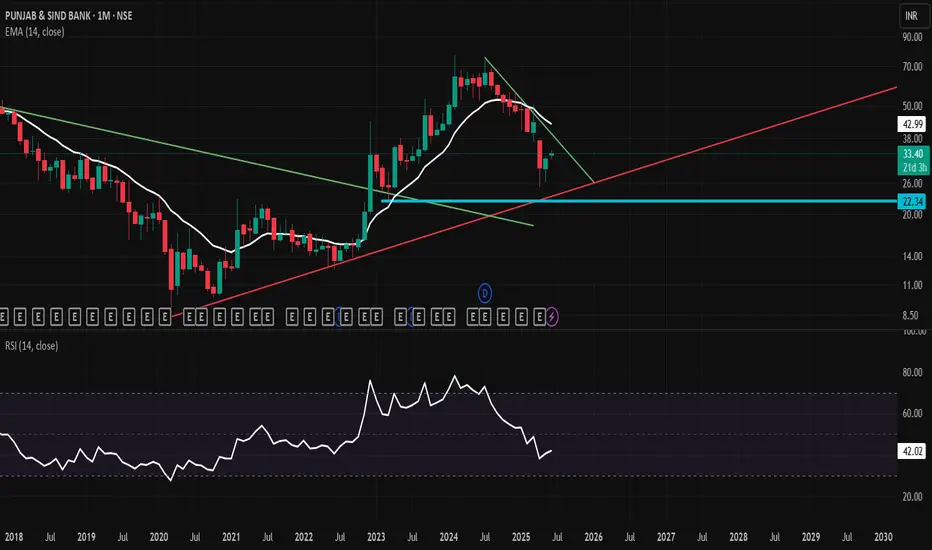
Is PSB The Right Bank To Invest Into?During the first half of 2024, NSE:PSB hit its peak levels near Rs. 80 and afterwards, it started falling down. However, when seen on the weekly chart, it was an expected down move and can be classified as a clean retracement. On April 1, 2025, marking the start of this financial year, the bank re
Punjab & Sind Bank Ltd.
No trades
1.73 INR
10.16 B INR
129.72 B INR
436.53 M
About Punjab & Sind Bank Ltd.
Sector
Industry
CEO
Swarup Kumar Saha
Website
Headquarters
New Delhi
Founded
1908
IPO date
Dec 30, 2010
Identifiers
2
ISIN INE608A01012
Punjab & Sind Bank Ltd. engages in the provision of banking products and services. It operates through the following segments: Treasury, Corporate and Wholesale Banking, Retail Banking, and Other Banking Operations.. The company was founded by Vir Singh, Sunder Singh Majitha, and Tarlochan Singh on June 24, 1908 and is headquartered in New Delhi, India.
Related stocks
PSB reversing from supportPSB reversing from support.
today price reversed from good support with good green strong close and volume
swing trade

Punjab & Sind Bank Ltd.Punjab & Sind Bank Ltd. engages in the provision of banking products and services.


Punjab & Sind BankPunjab & Sind Bank
Cmp 63 Sl 55 Tar 84
Time Frame 2 Months
Daily Chart Trendline Breakout Seen
Rsi Breakout in Daily Chart


PSB looks goodI have a FD in this bank for long time around 35/-
its almost double but i keep it till 80-90 range

PSB Breakout Long Buy predictionPunjab & Sind Bank is engaged in the Business of Deposits, Loans & Advances, and Remittances & Collections.
If we look at the chart:
The market has broken multiple bullish pattern confirmations. It has a broken flag & pole, and descending triangle while having a very strong volume at the brea

Good to longLooking good in monthly, weekly TF.
Justing waiting for Breakout in Daily TF. Good to go long around 65 with a tgt around 89
Nice volume in recent months.

PUNJAB & SINDH BANK for 75% (approx.) GainPSB Weekly and Monthly Breakout...
LTP : 37
TG 1 : 57
TG 2 : 61
TG 3 : 72
SL : 33 or trailing it

See all ideas
Summarizing what the indicators are suggesting.
Oscillators
Neutral
SellBuy
Strong sellStrong buy
Strong sellSellNeutralBuyStrong buy
Oscillators
Neutral
SellBuy
Strong sellStrong buy
Strong sellSellNeutralBuyStrong buy
Summary
Neutral
SellBuy
Strong sellStrong buy
Strong sellSellNeutralBuyStrong buy
Summary
Neutral
SellBuy
Strong sellStrong buy
Strong sellSellNeutralBuyStrong buy
Summary
Neutral
SellBuy
Strong sellStrong buy
Strong sellSellNeutralBuyStrong buy
Moving Averages
Neutral
SellBuy
Strong sellStrong buy
Strong sellSellNeutralBuyStrong buy
Moving Averages
Neutral
SellBuy
Strong sellStrong buy
Strong sellSellNeutralBuyStrong buy
Displays a symbol's price movements over previous years to identify recurring trends.
PSUBNKIETF
ICICI Prudential Nifty PSU Bank ETF Exchange Traded Fund UnitsWeight
0.31%
Market value
41.08 K
USD
Explore more ETFs
Frequently Asked Questions
The current price of PSB is 27.64 INR — it has decreased by −0.36% in the past 24 hours. Watch Punjab & Sind Bank Ltd. stock price performance more closely on the chart.
Depending on the exchange, the stock ticker may vary. For instance, on NSE exchange Punjab & Sind Bank Ltd. stocks are traded under the ticker PSB.
PSB stock has risen by 1.62% compared to the previous week, the month change is a 2.37% rise, over the last year Punjab & Sind Bank Ltd. has showed a −40.30% decrease.
PSB stock is 2.56% volatile and has beta coefficient of 2.64. Track Punjab & Sind Bank Ltd. stock price on the chart and check out the list of the most volatile stocks — is Punjab & Sind Bank Ltd. there?
Today Punjab & Sind Bank Ltd. has the market capitalization of 196.90 B, it has decreased by −0.57% over the last week.
Yes, you can track Punjab & Sind Bank Ltd. financials in yearly and quarterly reports right on TradingView.
PSB net income for the last quarter is 3.36 B INR, while the quarter before that showed 2.95 B INR of net income which accounts for 14.23% change. Track more Punjab & Sind Bank Ltd. financial stats to get the full picture.
Yes, PSB dividends are paid annually. The last dividend per share was 0.07 INR. As of today, Dividend Yield (TTM)% is 0.25%. Tracking Punjab & Sind Bank Ltd. dividends might help you take more informed decisions.
Punjab & Sind Bank Ltd. dividend yield was 0.16% in 2024, and payout ratio reached 4.67%. The year before the numbers were 0.33% and 22.77% correspondingly. See high-dividend stocks and find more opportunities for your portfolio.
Like other stocks, PSB shares are traded on stock exchanges, e.g. Nasdaq, Nyse, Euronext, and the easiest way to buy them is through an online stock broker. To do this, you need to open an account and follow a broker's procedures, then start trading. You can trade Punjab & Sind Bank Ltd. stock right from TradingView charts — choose your broker and connect to your account.
Investing in stocks requires a comprehensive research: you should carefully study all the available data, e.g. company's financials, related news, and its technical analysis. So Punjab & Sind Bank Ltd. technincal analysis shows the neutral today, and its 1 week rating is sell. Since market conditions are prone to changes, it's worth looking a bit further into the future — according to the 1 month rating Punjab & Sind Bank Ltd. stock shows the sell signal. See more of Punjab & Sind Bank Ltd. technicals for a more comprehensive analysis.
If you're still not sure, try looking for inspiration in our curated watchlists.
If you're still not sure, try looking for inspiration in our curated watchlists.