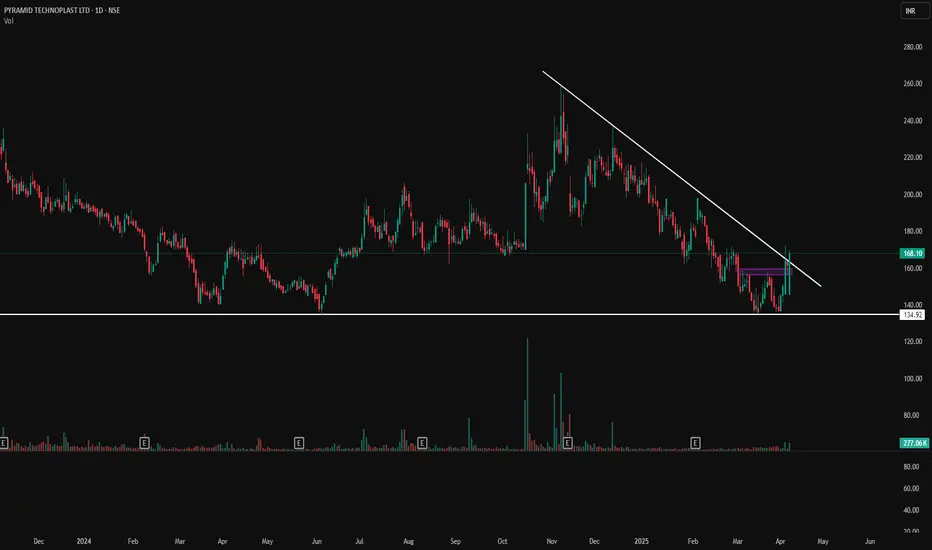
Pyramid Technoplast Ltd - Falling Trendline Breakout!Pyramid Technoplast Ltd – Falling Trendline Breakout! 💥
📅 Date: April 8, 2025
📊 Chart Analysis:
The stock has successfully broken out of a long-term falling trendline, indicating a potential reversal of the previous downtrend. This move is backed by strong bullish candles and an increase in volume.
Pyramid Technoplast Ltd.
No trades
7.47 INR
266.73 M INR
5.91 B INR
9.22 M
About Pyramid Technoplast Ltd.
Sector
Industry
CEO
Bijaykumar Agarwal
Website
Headquarters
Mumbai
Founded
1996
IPO date
Aug 29, 2023
Identifiers
2
ISIN INE0MIS01010
Pyramid Technoplast Ltd. operates as a packaging company. It is engaged in the business of manufacturing bulk industrial containers which include IBC containers, plastic barrels and MS barrels. The firm serves to chemical, agrochemical, specialty chemical and pharmaceutical companies. The company was founded in April 1996 and is headquartered in Mumbai, India.
Related stocks
Bullish tradeTrade Analysis
Trade Setup 1
Entry Price: ₹157.05
Target: ₹230.00
Stop Loss: ₹147.00
Risk-Reward Ratio: 7.26:1
Trade Setup 2
Entry Price: ₹141.95
Target: ₹230.00
Stop Loss: ₹133.75
Risk-Reward Ratio: 10.74:1
Technical Context
The chart shows a W-pattern formation (W_SS) with multiple support levels.

Pyramid Technoplast LtdIncorporated in 1997, Pyramid Technoplast Ltd manufacturers of HM-HDPE plastic containers, IBC containers, drums, barrels and cans in India
Market Cap ₹ 910 Cr.
Current Price ₹ 248
High / Low ₹ 251 / 134
Stock P/E 31.2
Book Value ₹ 60.4
Dividend Yield 0.00 %
ROCE 21.0 %

Pyramid Technoplast Ltdncorporated in 1997, Pyramid Technoplast Ltd manufacturers of HM-HDPE plastic containers, IBC containers, drums, barrels and cans in India

PYRAMID Hold 1 to 3MonthSL day candle close only, Target Trigger Price
All detail for chat. good entry at mark price only. and must stoploss minimum risk and good profit. risk ratio 1:1 to manage modified SL. This is not call, Just my idea. Please understand your risk and take full responsibility of your actions

100% - 1:3 returns Weekly Timeframe : MACD - RSI - Stosch = Strong buy
Daily - RSI & Stosch = Strong Buy
Candle - Bullish Candle
Volume - Above Average
EMA - Positive Crossover
Chart Pattern - Flag & Pole BO
FIB Retracement - 60%
Divergence - N/A
Notes
Major Resistance (Bull ka Target) 251
Stop Loss Price (SL) 195

PYRAMID𝐓𝐨𝐩 𝐁𝐫𝐞𝐚𝐤𝐨𝐮𝐭 𝐒𝐭𝐨𝐜𝐤𝐬 𝐅𝐨𝐫 𝐓𝐡𝐢𝐬 𝐖𝐞𝐞𝐤 ⬇️
🔸𝗣𝗬𝗥𝗔𝗠𝗜𝗗
-capex is up while borrowings are down
-highest ever sales
-margins would improve once full operations begin

pyramid daily longcan use the fall for add, simple break of structure.
Probable start of HH and HL. Target and SL as per ur risk apetitte

Pyramind Technoplast: Forming morning star near support zonePyramind Technoplast is looking good on daily time frame. Stock is showing buying strength with morning star pattern. Keep on radar for closing.

Pyramid Technoplast: Offering low risk set upPyramid Technoplast is trading support range on daily time frame. Can be a good low risk set up. Keep on radar.

See all ideas
Summarizing what the indicators are suggesting.
Oscillators
Neutral
SellBuy
Strong sellStrong buy
Strong sellSellNeutralBuyStrong buy
Oscillators
Neutral
SellBuy
Strong sellStrong buy
Strong sellSellNeutralBuyStrong buy
Summary
Neutral
SellBuy
Strong sellStrong buy
Strong sellSellNeutralBuyStrong buy
Summary
Neutral
SellBuy
Strong sellStrong buy
Strong sellSellNeutralBuyStrong buy
Summary
Neutral
SellBuy
Strong sellStrong buy
Strong sellSellNeutralBuyStrong buy
Moving Averages
Neutral
SellBuy
Strong sellStrong buy
Strong sellSellNeutralBuyStrong buy
Moving Averages
Neutral
SellBuy
Strong sellStrong buy
Strong sellSellNeutralBuyStrong buy
Displays a symbol's price movements over previous years to identify recurring trends.
Frequently Asked Questions
The current price of PYRAMID is 153.66 INR — it has increased by 1.43% in the past 24 hours. Watch Pyramid Technoplast Ltd. stock price performance more closely on the chart.
Depending on the exchange, the stock ticker may vary. For instance, on NSE exchange Pyramid Technoplast Ltd. stocks are traded under the ticker PYRAMID.
PYRAMID stock has risen by 8.92% compared to the previous week, the month change is a −1.06% fall, over the last year Pyramid Technoplast Ltd. has showed a −16.18% decrease.
PYRAMID reached its all-time high on Nov 7, 2024 with the price of 258.99 INR, and its all-time low was 134.40 INR and was reached on Jun 5, 2024. View more price dynamics on PYRAMID chart.
See other stocks reaching their highest and lowest prices.
See other stocks reaching their highest and lowest prices.
PYRAMID stock is 7.82% volatile and has beta coefficient of 0.48. Track Pyramid Technoplast Ltd. stock price on the chart and check out the list of the most volatile stocks — is Pyramid Technoplast Ltd. there?
Today Pyramid Technoplast Ltd. has the market capitalization of 5.94 B, it has increased by 3.66% over the last week.
Yes, you can track Pyramid Technoplast Ltd. financials in yearly and quarterly reports right on TradingView.
PYRAMID net income for the last quarter is 61.53 M INR, while the quarter before that showed 79.08 M INR of net income which accounts for −22.19% change. Track more Pyramid Technoplast Ltd. financial stats to get the full picture.
Yes, PYRAMID dividends are paid annually. The last dividend per share was 0.50 INR. As of today, Dividend Yield (TTM)% is 0.31%. Tracking Pyramid Technoplast Ltd. dividends might help you take more informed decisions.
Pyramid Technoplast Ltd. dividend yield was 0.36% in 2024, and payout ratio reached 6.90%. The year before the numbers were 0.00% and 0.00% correspondingly. See high-dividend stocks and find more opportunities for your portfolio.
As of Feb 10, 2026, the company has 519 employees. See our rating of the largest employees — is Pyramid Technoplast Ltd. on this list?
EBITDA measures a company's operating performance, its growth signifies an improvement in the efficiency of a company. Pyramid Technoplast Ltd. EBITDA is 474.87 M INR, and current EBITDA margin is 7.44%. See more stats in Pyramid Technoplast Ltd. financial statements.
Like other stocks, PYRAMID shares are traded on stock exchanges, e.g. Nasdaq, Nyse, Euronext, and the easiest way to buy them is through an online stock broker. To do this, you need to open an account and follow a broker's procedures, then start trading. You can trade Pyramid Technoplast Ltd. stock right from TradingView charts — choose your broker and connect to your account.
Investing in stocks requires a comprehensive research: you should carefully study all the available data, e.g. company's financials, related news, and its technical analysis. So Pyramid Technoplast Ltd. technincal analysis shows the sell today, and its 1 week rating is sell. Since market conditions are prone to changes, it's worth looking a bit further into the future — according to the 1 month rating Pyramid Technoplast Ltd. stock shows the strong sell signal. See more of Pyramid Technoplast Ltd. technicals for a more comprehensive analysis.
If you're still not sure, try looking for inspiration in our curated watchlists.
If you're still not sure, try looking for inspiration in our curated watchlists.