Radico Khaitan Buy @ when PE = 67Radico Khaitan Buy @ when PE between 67 and 73.
The Price has followed weekly breakout pattern multiple times, but no clear signal coming from that.
Also, we can see Price falling while Volume rising.
Radico Khaitan Limited
No trades
What traders are saying

Does History Repeat Itself Every Time(RADICO)My Dear Friends, Radico Khaitan Limited is a leading company in the alcoholic beverage industry, known for brands like 'Magic Moments' vodka and '8 PM' whisky. According to astrology, this company is entirely under the influence of Venus and Rahu .
Rahu : Rahu is the lord of excitement and intoxication. In the alcoholic beverage industry, Rahu is the planet that makes a brand trendy and popular among young people.
This is a very serious astrological warning for the history and future of Radico Khaitan . A very precise correlation is observed between Rahu's transit in the Shatabhisha Nakshatra and the decline in the stock price.
Here is a detailed analysis of the chart and cautionary signals for 2026:
The historic crash of 2007-2008 (78% decline)
According to the chart, when Rahu entered Aquarius under the Shatabhisha Nakshatra (October 2007), the stock reached its peak, and subsequently:
Decline : A massive drop of approximately -78.36% occurred.
Duration: This lasted for about 399 days.
Reason: Rahu is the ruling planet of the Shatabhisha Nakshatra, and Aquarius is also ruled by Rahu. This creates "irrational exuberance," followed by the bursting of the BUBBLE ".
2025-2026 की वर्तमान स्थिति (The Second Cycle) ( Astro Cycle)
The chart shows that from November 3, 2025, Rahu has once again come under the influence of Aquarius and the Shatabhisha nakshatra.
Similarity: The stock is currently at the ₹2,900+ level, and the chart shows an almost "triple top" or "exhaustion" pattern, similar to what was observed in 2007.
Warning: If history repeats itself (as often happens in Rahu's 18-year cycle), the stock is at risk of another major decline. The projected -78.36% drop shown in the chart is very concerning and could send the stock plummeting.
Will history repeat itself in 2026? (Analysis)
Although the Rahu's nakshatra & zodic is the same in 2007 and 2025(after 18 years), there is a significant astrological difference that might prevent a 78% decline this time:
Difference in Jupiter's position : In 2007-08, Jupiter was struggling in a water sign (Scorpio). In 2026, Jupiter will be exalted in a water sign (Cancer). An exalted Jupiter often transforms a major "crash" into a "correction."
Nature of Shatabhisha : The Shatabhisha Nakshatra is associated with "mystery" and "sudden changes." The stock market might not experience a crash like in 2007, but instead move sideways (within a range), tiring out investors.
And as you all know, time is more important than price, so let's see what time tells us.

Liquor industry influenced by Rahu (RADICO)Astrological reasons why Rahu is strong in the liquor industry:
Rahu is the primary significator of intoxicants (alcohol, drugs, tobacco). Liquors like vodka and whiskey are associated with Rahu's energy – illusion, allure, sudden fame, and addiction.
Many other liquor companies (such as United Spirits, McDowell, etc.) have also been observed to boom during favorable transits of Rahu.
Rahu also helps with foreign/imported styles (IMFL – Indian Made Foreign Liquor) and luxury branding. Brands like Radico's Magic Moments Vodka and 8PM Whisky became hits in this category.
Key observations from the chart:
Rapid surge from 2022 to 2025: The share price increased very rapidly (from approximately 1700-1800 to over 3300, more than double).
This period coincides with Rahu in Taurus (Rahu was in Taurus from March 2022 to October 2023, and its effects are long-lasting).
Taurus is considered an exalted sign for Rahu – here, Rahu grants immense success in material comforts, luxury, wealth, and luxury products like liquor.
Earlier period: Some growth is also visible around 2007-2010, when Rahu was in Aquarius (Aquarius is also considered favorable for Rahu, especially in innovation and mass production).
Let's learn a little about where Rahu gives good results.
In Vedic astrology, Rahu is a shadow planet considered to be the significator of material pleasures, ambition, innovation, foreign affairs, and sudden changes. Rahu is not always inauspicious – in the right position, it can bestow immense success, wealth, fame, and unexpected gains.
Auspicious Positions of Rahu in the Zodiac Signs:
Rahu does not have any classical exalted/debilitated signs, but based on modern and various astrological opinions, these signs are considered auspicious:
Taurus → The most widely accepted sign of exaltation. Here, Rahu bestows stability, wealth, material comforts, and luxury.
Gemini → Being the sign of Mercury, it brings success in intelligence, communication, business, and technology.
Virgo → Considered a Moolatrikona sign by many astrologers. It grants analytical abilities, success in service sectors, research, and foreign gains.
Aquarius → A sign ruled by Saturn, it brings innovation, technology, social work, and unexpected gains.
Libra and Capricorn → Friendly signs, good for business, politics, and social prestige.
In some opinions, Scorpio is also considered auspicious, as it is strong in occult knowledge and transformation (Best for astrologer).
In the constellations ruled by Rahu: Ardra, Swati, Shatabhisha → very auspicious results.
Friends, I will be sharing more charts of sectors influenced by Rahu with all of you. Thank you all for reading this article. If you liked it, please like it and share it with your friends.

#Radico ready for 9% #Radico ready for 9% in short term coming for new high
sl 3150. i usually dont use sl...its awesome stock in sin stocks sector
cathch me on youtube

Radico Khaitan – Long from Previous Demand Zone Toward Fresh HigRadico Khaitan has pulled back into a well‑defined previous demand zone after a strong impulsive rally, with price holding above the 3,140–3,200 support band and respecting the rising moving averages. The current consolidation just above this demand area offers a low‑risk continuation long, with invalidation below the SL line and upside potential toward the trail‑target region near 3,490 and the higher blue projection zone around 3,600+.
As long as price sustains above the demand band and converts it into a base, the bias remains bullish for another leg higher in line with the prevailing uptrend. A decisive close back below demand and SL would negate the setup and suggest waiting for a deeper correction before re‑entering.
#RadicoKhaitan #RADICO #NSEStocks #IndianStockMarket #SwingTrading #LongSetup #DemandZone #PreviousDemand #TrendContinuation #BreakoutRetest #TechnicalAnalysis #PriceAction #StockMarketIndia

RADICO Price ActionRADICO (Radico Khaitan Ltd) has recently shown a moderate recovery after a corrective phase, supported by buying interest near major moving average support zones. Price action indicates consolidation with a slight bullish bias, as the stock is forming higher lows and attempting to break key resistance levels. RSI momentum is gradually improving from oversold territory, while MACD and Stochastics reflect early signs of upside momentum, though not yet confirmed by strong volume.
Short-term trend remains cautious but positive as long as the stock holds above its 20-day moving average. Immediate resistance levels are observed at previous swing highs, with successful breakout likely to trigger a fresh upward move. Conversely, a sustained drop below recent support could restart the corrective trend. Price action near channel boundaries and reaction to news/events may create short-lived volatility, but the overall bias is shifting towards accumulation and gradual recovery unless a sharp downside reversal occurs.
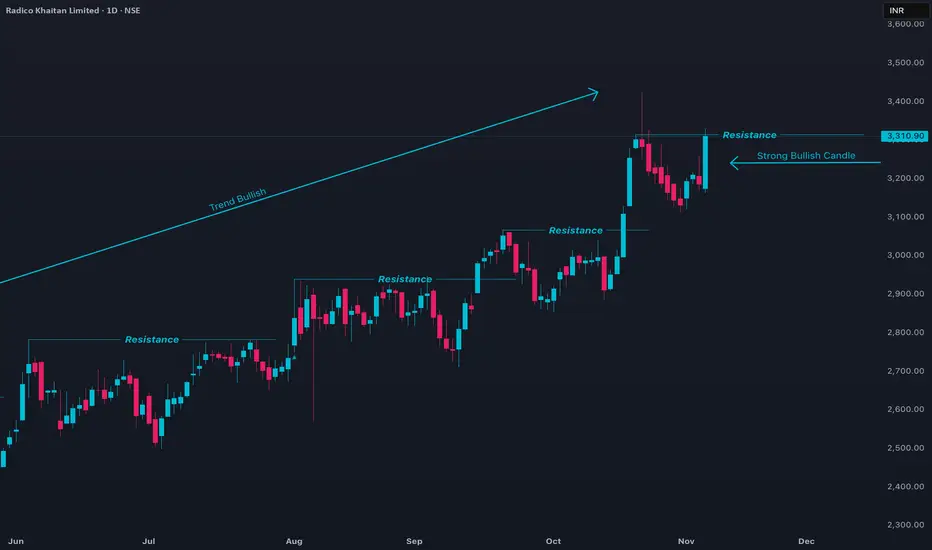
RADICO 1 Month Time Frame 📌 Current data snapshot
Latest price ~ ₹ 3,220.
52-week range: ~ ₹ 1,845.50 – ₹ 3,423.00.
Technical rating (1-month) on platforms shows “Buy” / “Strong Buy”.
🔍 Key support & resistance for ~1-month horizon
Support zone: ~ ₹ 3,050-3,100 — around current price minus some buffer.
Stronger support: ~ ₹ 2,900-3,000 — if the above zone fails.
Resistance zone: ~ ₹ 3,300-3,350 — near recent highs.
Possible breakout target: > ~ ₹ 3,400 — if it breaks resistance convincingly.
These levels are derived from recent chart data and pivot-analysis (for example, support ~₹3,052.5 seen on one chart).

RADICO 1 Day Time Frame 🔍 Current price snapshot
Recent price: ~ ₹3,220 on the NSE.
The stock has its 52-week high around ~ ₹3,423 and 52-week low around ~ ₹1,845.
📈 Key technical levels (1-day frame)
Based on available pivot / support/resistance data:
Pivot (daily): ~ ₹2,831.17.
Immediate supports: ~ ₹2,777.77 (S2) and ~ ₹2,800.93 (S1).
Immediate resistances: ~ ₹2,884.57 (R2) and ~ ₹2,907.73 (R3).
Using another source: Support ~ ₹3,143.31 and ~ ₹3,125.26; Resistance ~ ~₹3,219.81 & ~₹3,249.03.
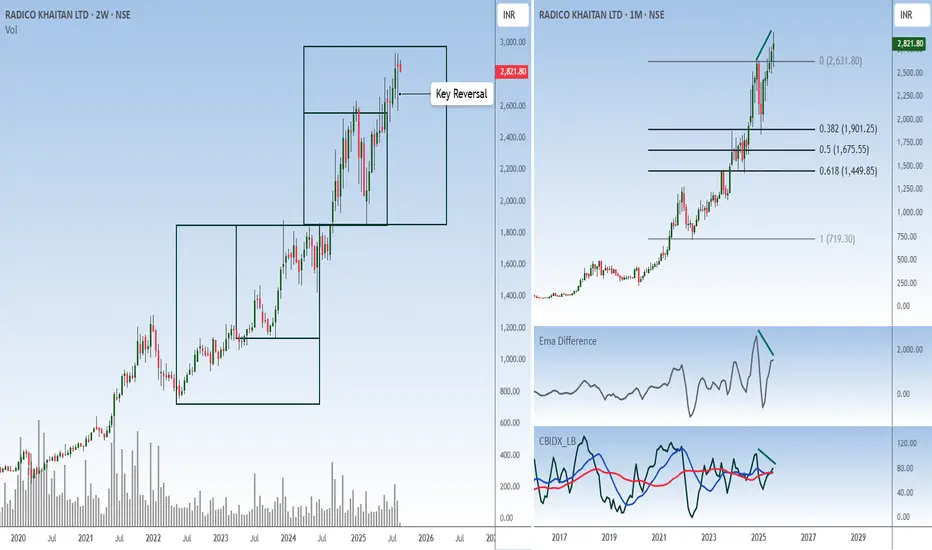
Book some profitsRadico Khaitan CMP 2822
Fibs - the box method is telling me this rally is done. Since the box has been made from the swing lows a bigger correction is on the horizon.
Candlestick - the key reversal on the highs is a reversal signal.
Oscillators - divergence on the detrend and the composite is confirming the reversal.
Conclusion - booking some profits will be prudent.
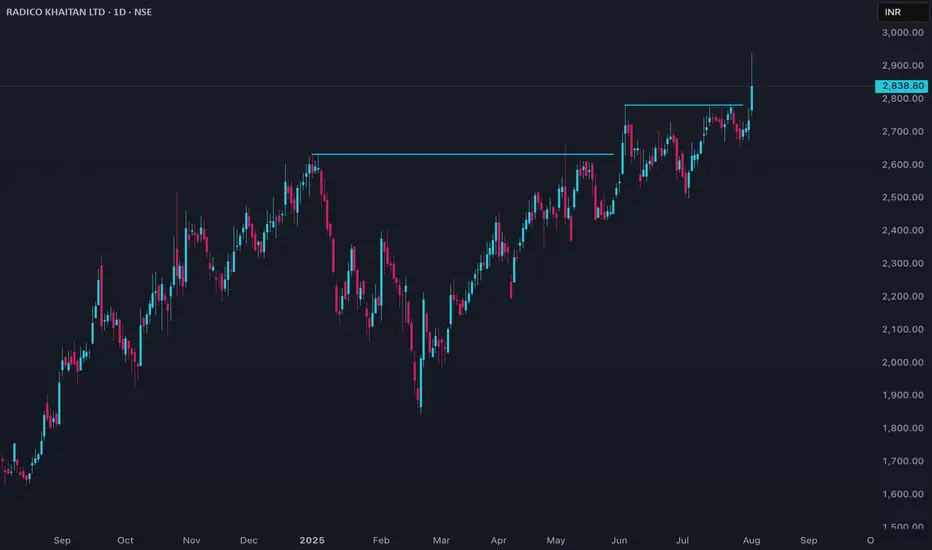
Radico Price ActionRadico Khaitan’s stock is trading around ₹2,840 as of early August 2025, having climbed sharply from about ₹2,700 in July and near ₹2,050 back in February. The share price hit an all-time high at the start of August and has more than doubled over the past 12 months, outperforming its peers in the spirit and beverages sector.
Recent price momentum has been driven by strong financial results: for the quarter ending June 2025, Radico reported net sales of over ₹1,500 crore, a year-on-year increase of more than 32%. Market capitalization is robust and the stock is actively traded, with volumes surging during rally periods. However, valuation is elevated: the price-to-book ratio is around 14 and price-to-earnings is at the high end for its segment, reflecting rich investor expectations.
Operationally, Radico maintains steady margins and has shown above-average revenue growth, consistently launching new premium products and expanding distribution. The company’s return on equity averages about 11–12% over three years, slightly below top FMCG performers but stable.
Technically, the stock is in a strong uptrend, trading well above major moving averages, but may be considered overbought in the very short term after recent rapid gains. Liquidity remains healthy, supporting continued volatility and trading opportunities.
In summary, Radico Khaitan is a high-growth, well-established spirits company with strong recent sales and a share price at historic highs. While fundamentals support continued strength, caution is warranted given expensive valuations and the potential for short-term corrections following such a swift rally.
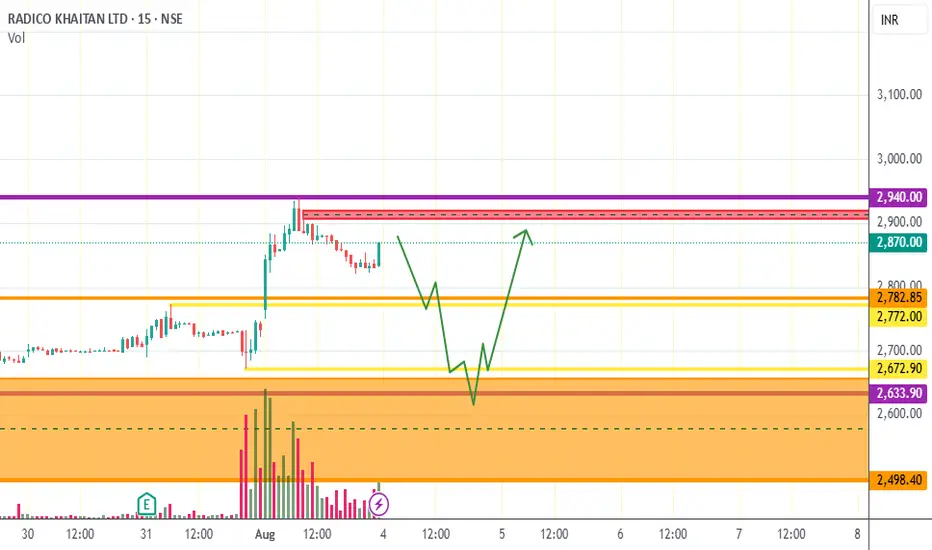
radico khaitan will move like this RADICO KHAITAN will move as per the chart drawings according to my analysis, lets see what happens
Radico Khaitan Ltd. (RADICO)## 📊 TradingView – Radico Khaitan Ltd. (RADICO)
**1. Fundamental Snapshot**
* **Q1 FY26 Performance (YoY growth):**
* Sales: ₹1,506 Cr (+33%)
* EBITDA: ₹232 Cr (+56%)
* Net Profit: ₹133 Cr (+82%)
* EPS: ₹9.96 vs ₹5.71 last year (+74%)
* **Valuation:**
Market Cap \~₹36,578 Cr, trading at a high P/E of \~89.8, which reflects premium valuations often given to consumer staples and brand‑driven liquor companies.
* **Takeaway:** The company delivered strong double‑digit top‑line and bottom‑line growth, highlighting demand resilience and margin expansion despite a competitive environment.
---
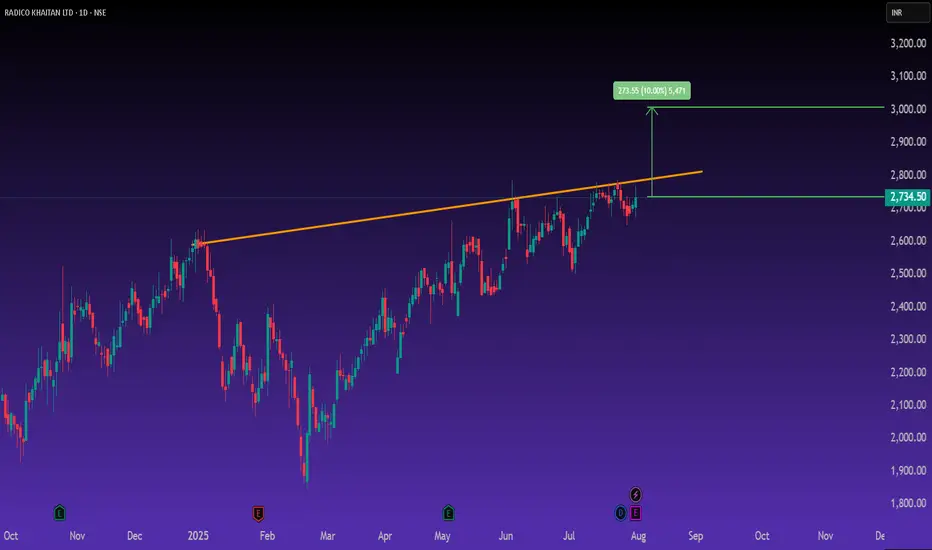
**2. Technical View**
* **Trend:** The stock has been consolidating within a rising channel for months, now testing the breakout zone near ₹2,730–2,750.
* **Breakout Signal:** A sustained move above this level could trigger a fresh leg up towards ₹3,000 (approx. 10% upside).
* **Support Zones:** ₹2,600 remains key support; below that, momentum may weaken.
* **Resistance Zones:** Immediate resistance \~₹2,900–3,000.
**Chart Tone:** The ascending trendline breakout attempt shows buyers accumulating at higher levels. If volume confirms, a clear bullish continuation pattern emerges.
---
**3. Trading Plan (Momentum View)**
* **Entry:** On breakout above ₹2,750–2,770
* **Target:** ₹3,000+
* **Stop Loss:** ₹2,600
---
### ✅ Disclaimer
*This analysis is for educational purposes only. It is not investment advice. Please DYOR and consult a SEBI‑registered advisor before making any trading or investment decision. I am not SEBI registered.*
Radico Khaitan Ltd. at Buy Support. CMP 2425Radico Khaitan Ltd. at Buy Support. CMP 2425. Breakout at 2464 closing basis. SL 2320. Momentum is gaining strength with volumes.

Why RADICO KHAITAN’S Moves Against the Industry TrendStrong Financial Performance and Premiumization Strategy:
Q4 FY25 Results: Radico reported a robust 70.78% increase in net profit to ₹92.07 crore and a 20.90% rise in sales to ₹1,304.08 crore for the quarter ended March 2025, compared to the previous year. For the full year, net profit grew 31.83% to ₹345.61 crore, and sales rose 17.79% to ₹4,851.15 crore. This strong financial performance, particularly in the Prestige & Above (P&A) category (14% volume growth and 19% value growth in Q1 FY25), indicates successful premiumization, setting Radico apart from competitors facing slower growth.
Luxury Brand Focus: Radico’s strategic pivot toward luxury and premium segments, with launches like Ankahi Zaffran Spiced Liqueur at ProWein 2025 and brands like Rampur Asava and Jaisalmer Gold Edition, positions it to capture the growing demand for high-end spirits in India and globally. This focus on premiumization contrasts with regional players focusing on lower-margin segments, giving Radico a competitive edge.
Global Ambitions: The company’s efforts to establish Indian Single Malts as a global standard and its partnership with Saregama for innovative marketing (e.g., Magic Moments Music Studio) enhance brand visibility, potentially driving market share gains despite industry challenges.
Stock Price Volatility and Market Trends:
Short-Term Declines: Despite strong fundamentals, Radico experienced stock price declines in February 2025, with losses ranging from 3.03% to 3.52% on specific days, underperforming the sector on occasions (e.g., -0.81% vs. sector on Feb 28). These declines align with broader market volatility and sector-specific challenges, such as rising input costs (food grain inflation) and delayed excise policies during elections, which impacted industry volumes by 3-4%.
Rebounds and Outperformance: Radico also showed resilience, with notable rebounds like a 3.3% gain on Feb 27 and a 3.02% gain on Feb 19, outperforming the sector by 4.91% and 0.78%, respectively. These recoveries suggest market recognition of Radico’s strong fundamentals, even amidst sector downturns.
Moving Averages: The stock’s position below short-term moving averages (5-day, 20-day) but above longer-term ones (100-day, 200-day) during parts of 2025 indicates mixed sentiment—short-term bearish trends due to market volatility but longer-term bullishness driven by fundamentals.
Analyst Optimism and Market Sentiment:
Analyst Ratings: Analysts remain bullish, with 14 analysts rating RADICO as a “buy” and a 1-year price target of ₹2,733.64 (max ₹3,000, min ₹2,483) as of June 2025. Motilal Oswal initiated coverage with a “Buy” call and a ₹3,000 target, reflecting confidence in Radico’s growth trajectory.
Stock Price Targets: Forecasts suggest significant upside, with a potential increase to ₹2,920.34 in one year (+15.21%) and ₹4,787.14 by 2030 (+88.86%), driven by Radico’s strong brand portfolio and market positioning. This contrasts with the sector’s mixed performance, where competitors may not have similar growth prospects.
Industry-Specific Challenges:
Sector Volatility: The Breweries & Distilleries sector faced challenges in 2025, including a 3.61% sector decline on Feb 12 and broader market fluctuations. Radico’s underperformance on certain days (e.g., -3.11% on Feb 11) reflects these industry headwinds, but its ability to outperform on others (e.g., +0.65% vs. sector on Jan 1) highlights its relative strength.
Input Cost Pressures: Food grain inflation and volatile commodity prices slightly reduced gross margins (41.5% in Q1 FY25 vs. 43.6% prior year). However, Radico’s leadership expects stabilization, supported by government management of rice stocks, which may mitigate sector-wide cost pressures more effectively for Radico due to its backward integration efforts.
Competitive Landscape:
Regional vs. National Players: Radico faces competition in the P&A and luxury segments from organized players, but its leadership believes it is ahead due to innovative marketing and product quality. Regional players are more active in lower segments, not directly competing with Radico’s premium focus.
Market Positioning: Radico’s extensive distribution network and brands like Magic Moments Vodka (1.9 million cases sold in Q1 FY25, sixth largest vodka brand globally) provide a competitive moat, allowing it to navigate industry challenges better than smaller or less diversified peers.
Why RADICO Moves Against the Industry Trend:
Outperformance: Radico’s focus on premium and luxury segments, strong financial growth (e.g., 31.83% net profit increase in FY25), and global brand-building efforts drive periods of outperformance, as seen in its 55.57% stock price increase over the past year (vs. Sensex’s 8.14%) and all-time high of ₹2,665 on May 7, 2025.
Underperformance: Short-term declines (e.g., -15.21% in Feb 2025 vs. Sensex’s -0.74%) reflect broader market volatility, sector-specific challenges like input cost inflation, and election-related excise policy delays, which temporarily align Radico with or exaggerate industry downturns.
Resilience: Radico’s ability to rebound (e.g., +3.3% on Feb 27) and maintain analyst confidence (strong buy ratings) suggests that its strategic focus on premiumization and operational efficiencies (e.g., near debt-free target by FY26) allows it to recover faster than the sector average.
Conclusion:
Radico Khaitan’s movement against the industry trend in 2025 stems from its strategic focus on premium and luxury segments, robust financial performance, and strong analyst backing, which drive outperformance during bullish periods. However, short-term declines reflect sector-wide challenges like market volatility, input cost pressures, and regulatory hurdles, where Radico occasionally underperforms due to its high valuation (noted as an “Expensive Performer”). Its long-term outlook remains positive, with analysts forecasting significant growth, supported by premiumization and global expansion efforts.

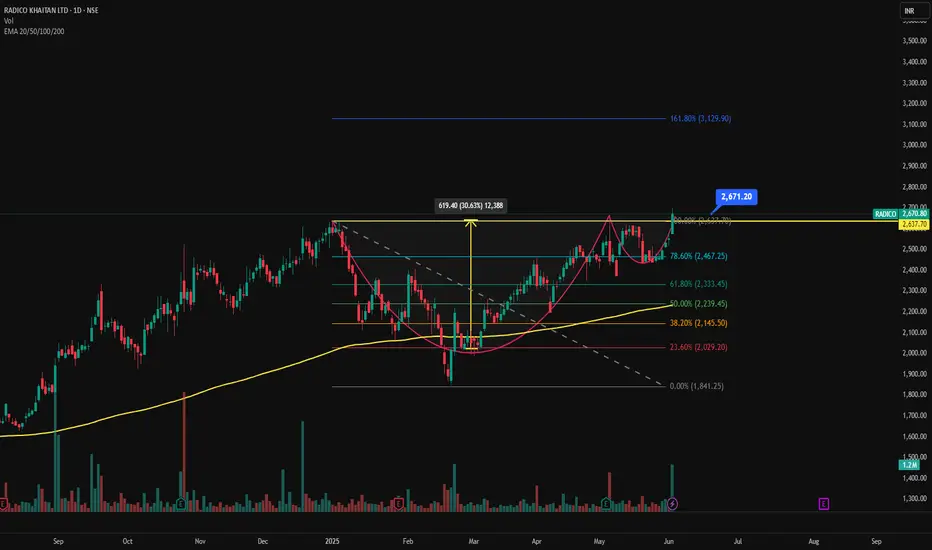
RADICO - Cup & Handle Breakout | Daily Chart📊 RADICO KHAITAN LTD (RADICO) – Cup & Handle Breakout | Daily Chart
📅 Chart Date: June 4, 2025
📈 CMP: ₹2,670.80 (+4.78%)
📍 Ticker: NSE:RADICO
🔍 Technical Breakdown
☕ Cup & Handle Breakout Confirmed
A classic Cup & Handle formation has played out with a bullish breakout above the neckline near ₹2,640–₹2,670. The pattern is well-structured, showing clear accumulation followed by a rounded bottom and brief consolidation.
📏 Measured Target:
The height of the cup (~₹620) projects an initial target near ₹3,129, aligning closely with the 161.80% Fibonacci Extension level.
⚙️ Indicators Used
🔹 Chart Pattern: Cup & Handle
📐 Fibonacci Retracement & Extension
📊 Volume Spike: Strong breakout volume
📈 EMA Cluster: 20/50/100/200-day — bullish alignment
🟢 EMA Support: Price sustaining well above EMAs; 200 EMA ~₹2,000
📍 Key Price Levels
✅ Breakout Zone: ₹2,640–₹2,670
🚀 Upside Targets:
📈 127.20% – ₹2,853
📈 161.80% – ₹3,129
📈 200% – ₹3,352 (extended swing target)
🛡️ Support Levels:
₹2,467 – 78.6% Fibo
₹2,333 – 61.8%
₹2,145 – 38.2%
₹2,029 – 23.6%
🔻 Invalidation/Stop: Closing below ₹2,467 (strong Fibo + EMA support zone)
💼 Trading Strategy
Entry: On breakout retest or strong close above ₹2,670
Stop Loss: ₹2,467
Target Range: ₹2,853 – ₹3,129 – ₹3,350+
Timeframe: Short to medium term swing
⚠️ Disclaimer
This analysis is for educational purposes only. Please do your own research or consult a financial advisor before making trading/investment decisions.
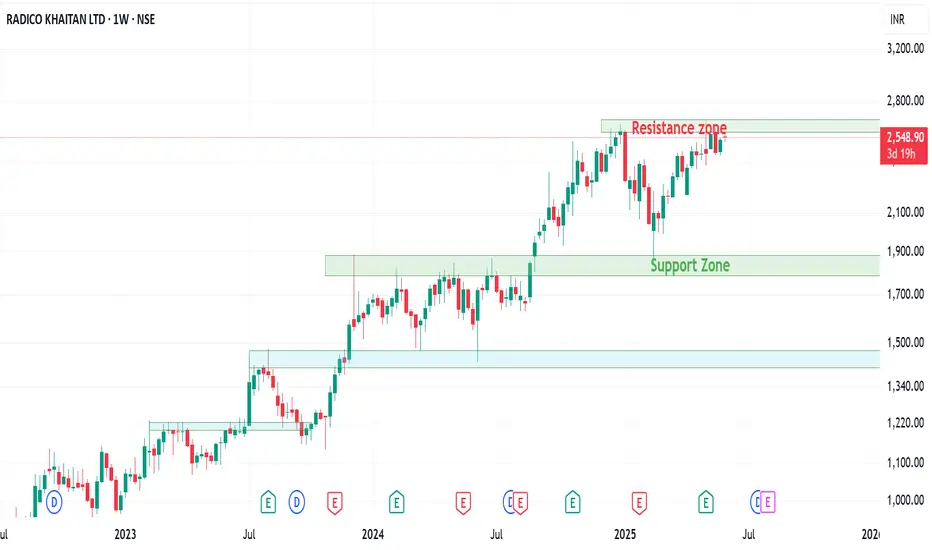
Radico Khaitan at a Crossroads: Support, Resistance & MomentumThe stock is in a bullish trend and is forming a box consolidation and break outs.
On the weekly charts the stock is trading around the resistance zone and there are chance of either breaking out or retesting to the lower levels.
Stock seems strong bullish on the charts but indicators are suggesting a bearish move as the stock is around the resistance zone.
Short sell can be initiated in the stock with a strict SL.
On the bullish side the stock is respecting the monthly 20 EMA and has retested it thrice. Radico if turns bearish can be entered around the moving average as Good R:R in the trade can be seen.
Even on the weekly charts, the stock is trading above the moving averages chance of a retest are there but short sell the stock once the support zone in taken out.
Watch the stock a good ROI can be generated in the stock after the break out the stock will be forming new ATHs.
Wait for a pattern near the resistance either for a bearish or bullish move as it is trading around the crucial recent high levels of 2600-2680.
Stochastic indicator on the Monthly TF is trading in overbought zone while on the weekly TF its showing some bearish divergence. Even the monthly RSI is showing a bearish divergence.
Wait for the price action and trade accordingly.
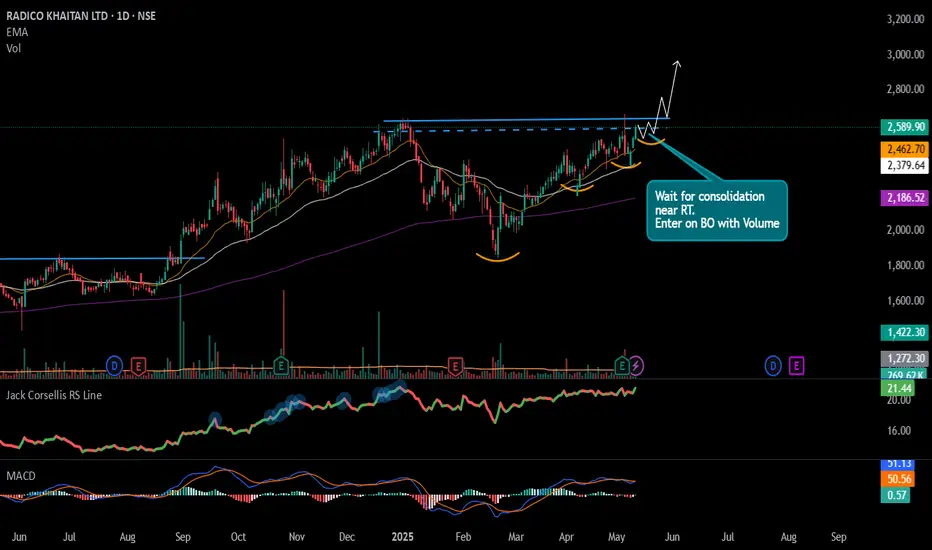
#RADICO - Potential Breakout Keep in WL📊 Script: RADICO
Key highlights: 💡⚡
📈 Roiunding Bottom Pattern / VCP Set up in Daily Time Frame.
📈 Wait for price consolidating near Resistance.
📈 Can Enter on BO with Volume spike or Wait for Pullback
📈 MACD Nutral
📈 One can go for Swing Trade.
BUY ONLY ABOVE NA DCB
⏱️ C.M.P 📑💰- 2589
🟢 Target 🎯🏆 – NA%
⚠️ Stoploss ☠️🚫 – NA%
️⚠️ Important: Market conditions are Okish, Position size 50% per Trade. Protect Capital Always
⚠️ Important: Always Exit the trade before any Event.
⚠️ Important: Always maintain your Risk:Reward Ratio as 1:2, with this RR, you only need a 33% win rate to Breakeven.
✅Like and follow to never miss a new idea!✅
Disclaimer: I am not SEBI Registered Advisor. My posts are purely for training and educational purposes.
Eat🍜 Sleep😴 TradingView📈 Repeat 🔁
Happy learning with MMT. Cheers!🥂
Radico Looking Great NSE:RADICO Made Beautiful Chart Structure today before Results tomorrow.
Keep in the Watchlist.
NO RECO. For Buy/Sell.
Disclaimer: "I am not SEBI REGISTERED RESEARCH ANALYST AND INVESTMENT ADVISER."
This analysis is intended solely for informational and educational purposes and should not be interpreted as financial advice. It is advisable to consult a qualified financial advisor or conduct thorough research before making investment decisions.

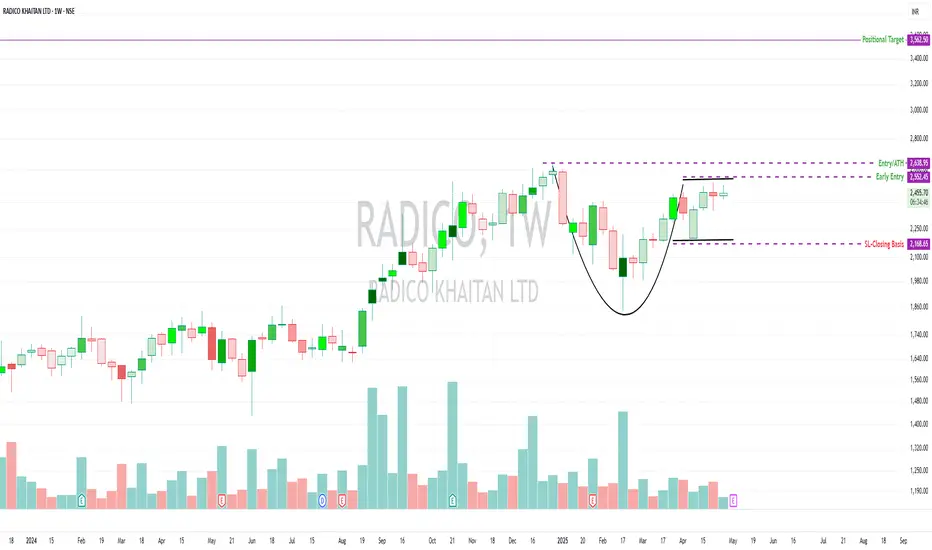
RADICO – Cup Base Forming | Testing Waters, No Diving Yet📈 RADICO – Cup Base Forming | Testing Waters, No Diving Yet
RADICO is forming a classic cup base on the weekly chart, trading above key DMAS with improving structure and RSI strength. A pilot entry to test the strength of the setup — not a full position.
🔍 Technical Overview
🟢 Structure: Well-formed cup attempting a neckline test
⚠️ Volume: Currently drying up — wait for breakout + volume spike
📍 Entry: Early Pilot Entry t at ₹2,552.45
✅ Add only if ATH breaks (₹2,638.95) with a clean weekly candle and volume confirmation
⚖️ Risk Management
❌ SL is deep (~15%) — manage position sizing carefully
💡 Expect shakeouts — volatility remains elevated
🧠 This is a positional pick, not a short-term play
🔄 Risk: Reward planned near 1:2, but no hard target in the current market volatility
⚠️ Macro Context
Nifty 500 is still below its 200 DMA
The market is not fully out of danger
Be nimble, not aggressive
🧠 Final Thoughts
Test the setup, don’t commit fully yet
Let volume confirm — breakout without power = trap risk
Trade as per your style
Risk management isn’t optional — it’s survival
📉 Disclaimer:
This is not investment advice. For educational purposes only. Do your own research and manage capital based on your strategy.
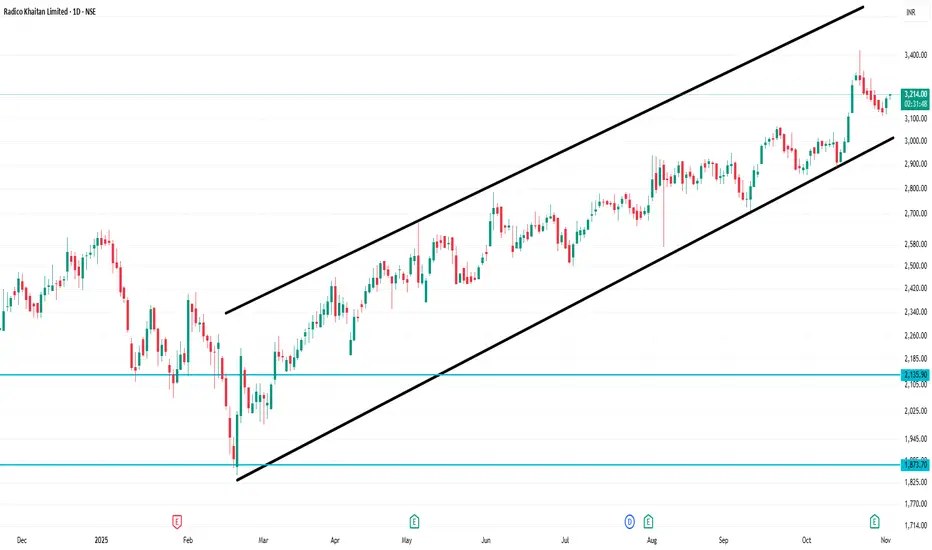
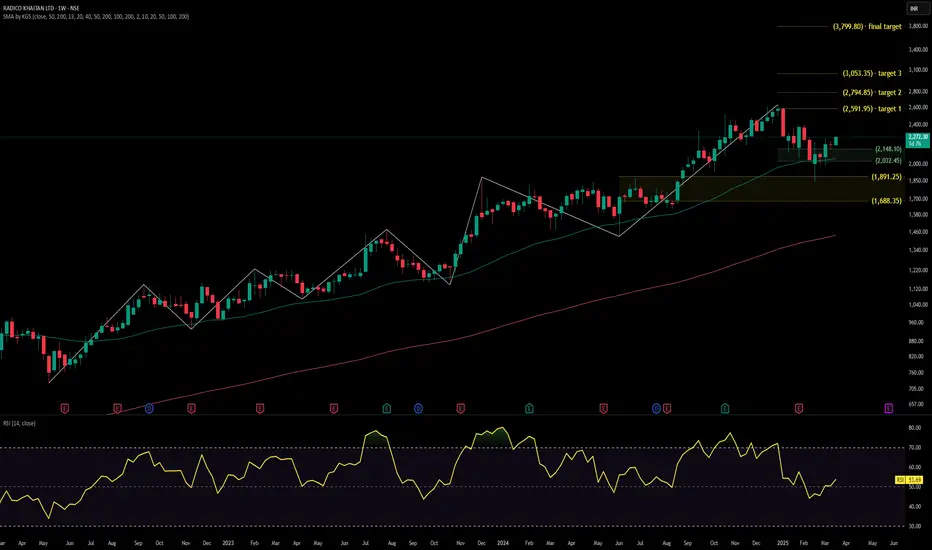
ready for cheers RADICO KHAITANStock Overview:
Stock Name: Radico Khaitan Ltd, Exchange: NSE
Company Business Profile: Radico Khaitan Ltd is a leading Indian company specializing in the manufacturing and distribution of alcoholic beverages, including spirits and liquors.
Key Levels:
Support (Yellow Zone): ₹1,688.35 - ₹1,891.25
Swing Zone (Green Zone): ₹2,032.45 - ₹2,148.10
Technical Indicators:
RSI (Relative Strength Index): Currently at 53.69, indicating neutral momentum. RSI values above 70 suggest overbought conditions, while below 30 indicate oversold conditions.
Volume: 410.85K shares traded, reflecting moderate activity. Higher volume often signals increased interest in the stock.
MA (Moving Averages): The stock price is above the 200-day moving average (₹1,437.52), suggesting a long-term uptrend.
Sector and Market Context: Radico Khaitan Ltd operates within the alcoholic beverages sector, which is influenced by regulatory changes, consumer trends, and economic conditions. The sector shows resilience, and the stock's position above its long-term moving average aligns with the broader bullish market sentiment.
Risk Considerations: Potential risks include regulatory changes impacting the alcoholic beverages industry, fluctuations in raw material costs, and shifts in consumer preferences. Broader market conditions, such as economic downturns or geopolitical events, could also affect the stock's performance.
Analysis Summary: Radico Khaitan Ltd demonstrates a strong upward trend, supported by key technical levels and indicators. While the long-term outlook appears positive, investors should remain cautious of potential risks and market conditions. This analysis is for informational purposes only and does not constitute investment advice.
Radico KhaitanIncorporated in the year 1943, Radico Khaitan is one of the most recognised IMFL (Indian Made Foreign Liquor) brands in India.
The company was initially known as Rampur Distillery Company and was focussed on distillation and bottling for branded players and canteen stores of armed forces.
Later on in the year 1997, Radico Khaitan ventured into its own branded IMFL products and launched its first brand 8PM whisky which became its millionarie brand within a year of its launch.
The company is one of the oldest and largest manufacturers of Indian Made Foreign Liquor (IMFL), a leading supplier of branded IMFL to the Canteen Stores Department (CSD) in India, and the country's oldest and largest malt distiller. It is also one of the largest exporters of Alcoholic beverages from India to 102+ countries.

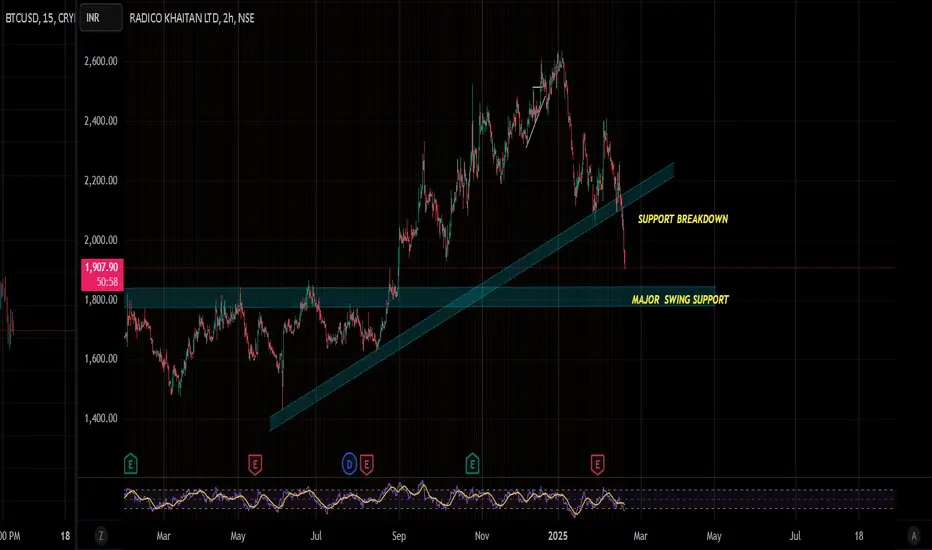
SWING (KEEP WATCH) - RADICO KHAITAN
Script broke support trendline- and in down move heading towards major support area around 1840 . If holds on to support can give a good bounce
Long Trade Idea: NSE:RADICO🚀 Long Trade Idea: NSE:RADICO (Radico Khaitan Ltd) 🚀
📌 Current Price: ₹2,111.20
📌 Analyst Target Range (1-Year Forecast): ₹2,380 - ₹2,996
📌 Analyst Consensus: Strong Buy
📊 Technical Analysis Highlights:
1️⃣ Liquidity Sweep:
- Today's daily candle has swept the liquidity from 22nd October 2024, signaling a possible bottom formation and potential reversal.
2️⃣ Nen Star Harmonic Pattern (27.01.2025):
- This harmonic pattern is a strong reversal signal, suggesting the end of the ongoing downtrend and a shift towards bullish momentum.
3️⃣ Relative Strength vs. NSE:NIFTY:
- The 123-period Relative Strength (RS) of RADICO compared to NSE:NIFTY is positive, indicating outperformance and potential upside in the coming sessions.
4️⃣ Chart Pattern - Falling Wedge:
- The stock is forming a falling wedge, which is a bullish breakout pattern. A breakout above resistance could trigger a strong upside move.
5️⃣ Discounted Price Opportunity:
- The stock is trading at a heavy discount relative to analyst price forecasts and fundamental valuation, making it an attractive buy for traders and investors.
- Revenue Growth: Consistent increase in revenue driven by premiumization of products.
- Profit Margins: Healthy margins indicate strong pricing power.
- Industry Outlook: Alcoholic beverages sector remains resilient with growing demand in India.
⚠️ Disclaimer:
*This analysis is for educational and informational purposes only and should not be considered as financial advice. Stock market investments involve risk. Please do your own research or consult a certified financial advisor before making any investment decisions. I am not a certified financial analyst.*
