Reading Price action and Candlesticks like a PROI make educational content videos for Trading
In this video I have used charts older than 3 months to share my experience in the markets by sharing my thinking and chart skills - I hope you will learn something out of it
Rallis India Limited
No trades
Market insights

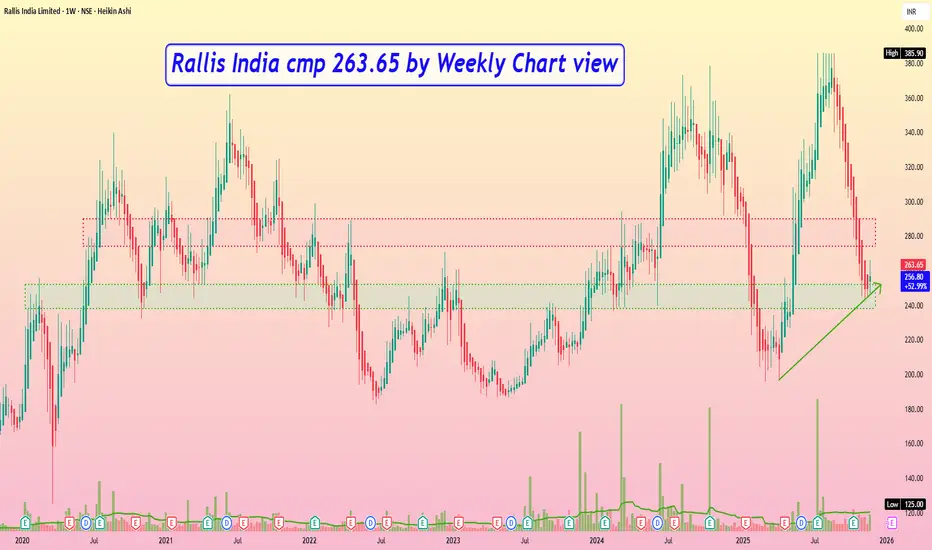
Rallis India cmp 263.65 by Weekly Chart viewRallis India cmp 263.65 by Weekly Chart view
- Support Zone 238 to 252 price Band
- Resistance Zone 274 to 290 price Band
- Stock fell from ATH 385.90 by Bearish Top formation
- Support Zone (since Sept 2014) tested retested for fresh up move
- Volumes below avg traded qty need to increase for upward price movement
RALLISRALLIS
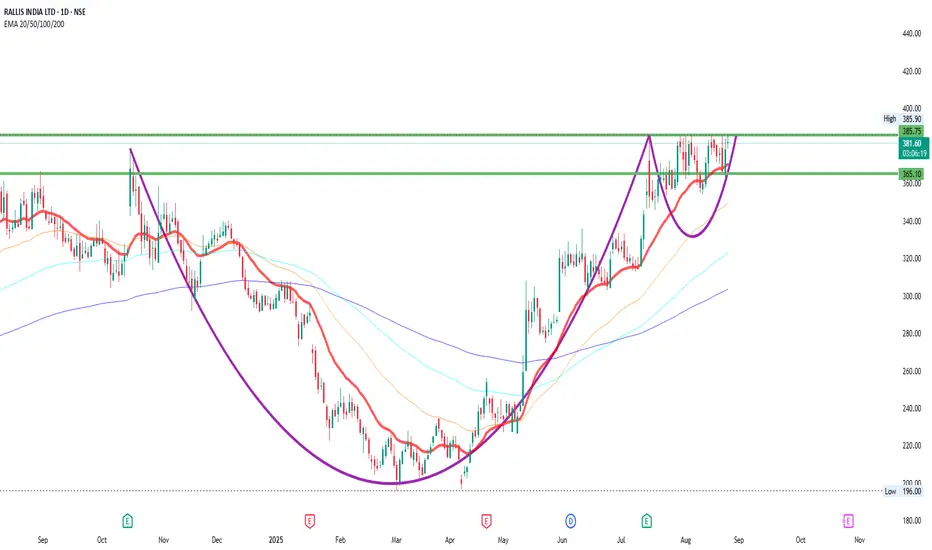
bullish trend is Showing on the chart.
buy signals in
technical indicators and
cup with handle chart pattern.
Watch for a breakout above 385-400 to sustain the bullish trend. If the resistance holds, there could be a retest towards 350-360 and an uptrend from here.

RALLIS AT BREAKOUTrallis making a per charts making perfect rounding bottom breakout ready to blast high

RALLIS - Ready for Momentum BurstNSE:RALLIS
Technical Analysis
⦿ Its moving in a good uptrend with stair pattern in a Wide channel.
⦿ On 15th of July company posted good results but since than - the stock is just consolidating now its been 1 month, Now it will be time to capitalize on that good earning.
⦿ The current base is clean and a static resistance is formed @386
⦿ Price is Approaching for 3rd time and from last 3 days upmove volume has surged.
⦿ Planning a trade above resistance and keeping a simple 2% stoploss to capture 10% Move.
🟢Entry - 386
♦️Stop - 375
🎯Tgt - 400,425+
The above information is for educational purposes only.
Before acting on any investment idea please do your own analysis and follow proper risk-to-reward, position sizing rules
⦿ If you found this idea Useful, please like and comment 👍💬
Keep Learning,
Happy Trading 🤞**

Rallis BULLISH Ahead ?Rallis India, a Tata Group company and a key player in the agrochemicals space, is showing signs of a potential turnaround. With India focusing on agricultural productivity and global supply chain realignments favoring domestic players, Rallis seems well-positioned to capitalize on this wave.
🔍 Why Rallis Looks Interesting:
Strong Parentage: Backed by the TATA Group, known for long-term stability and strategic management.
Sectoral Tailwinds: Agriculture and crop protection are seeing renewed focus from both the government and private sector, especially with monsoon progress being favorable this year.
Fundamental Improvements: The company has been working on margin improvements, product innovation, and expanding its export base.
Technical Setup: After a prolonged consolidation, the stock is showing signs of accumulation around the ₹370–₹385 zone, with improving volumes and RSI strength.
📌 Personal View:
At ₹380, I am personally bullish on Rallis India. I believe this stock could deliver a strong upside move in the coming weeks or months. However, strict stop loss discipline is crucial, and no trade should risk more than 5% of total capital.
⚠️ Disclaimer:
This is not a buy or sell recommendation—it’s purely a personal idea intended for educational and tracking purposes. Please do your own research and consult a financial advisor before making any investment decisions.↳

Rallis - 1. After reaching the pink channel top during the year 2010, it started moving sideways with very little inclination only to touch the other side of the parallel channel.
2. While going sideways,it formed the blue parallel channel. Whenever it touched the blue parallel channel bottom, it climbed higher to its top. Now it touched the bottom of the pink parallel channel + blue parallel channel+ support line of 254+ fib 0.618 retracement.
3. All the above led the strong foundation for its bullish rally and already gave 50% in 3 months.
4. Trade setup:
a. After reaching the blue channel top, it it comes to 254, its good to enter as a aggressive entry.
b. As a conservative entry, entry should be done only after the successful strong breakout above the blue channel and 362 resistance and it should sustain above it for 3 months.
c. Once the above is done, target will be minimum 5x in very long term.
Note: This is for educational purpose and not a stock recommendation.

Rallis India Short Term TradeAfter consolidating for around three months, the stock has shown a visible uptrend in the last month, the move backed by a considerable increase in volume ,
Currently , an inverted head and shoulder like pattern is visible in the stock,
The resistance level of 308 has been broken, confirmed with a sharp rise in volume, and atr
Thus, for a short term trade,
tgt 330.5, sl 305

BUY TODAY SELL TOMORROW for 5%DON’T HAVE TIME TO MANAGE YOUR TRADES?
- Take BTST trades at 3:25 pm every day
- Try to exit by taking 4-7% profit of each trade
- SL can also be maintained as closing below the low of the breakout candle
Now, why do I prefer BTST over swing trades? The primary reason is that I have observed that 90% of the stocks give most of the movement in just 1-2 days and the rest of the time they either consolidate or fall
Round Bottom Breakout in RALLIS
BUY TODAY SELL TOMORROW for 5%

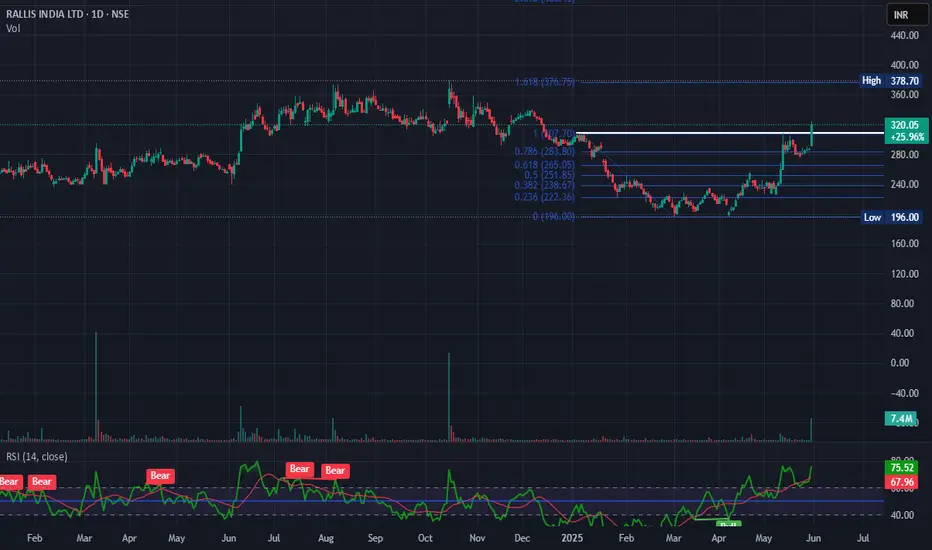
20 Return with minimal Risk.Fundamental:
This Tata Chemical subsidiary has been posting poor sales growth for the past few quarters but it is expected that on April 23 2025 the trend will change to positive. Also with a healthy Dividend payout ratio of around 40% and debt free status it worth taking a bet.
Technical:
On 17 April the price surged upwards with volumes and RSI confirmation. So one can expect a target of around 280 giving a return of around 20%.

Rallis - Advance viewRallis : Advance view
Nice breakout and now bounced from support
Looks good above 380 with support at 363


monthly+weekly breakout in RALLIS INDIARallis India, a Tata Group company Group Co., has a history of over 150 years. The company is into manufacturing of Agrochemicals and is present across the value chain of agriculture inputs - from seeds to organic plant growth nutrients. Rallis is also in the business of contract manufacturing for global corporations

#RALLISNSE:RALLIS
Base formation completed.
350-360 is supply zone
280-290 is Demand zone.
Can make Cup and Handle pattern and then breakout above 360.

Rallis: Potential Long
Trying to continue the momentum formed by inverted head & shoulder.
Important selling zone present at 260, candle needs to close above this level for confirming long positions.
If it correct from current positions 249 can be a good position to initiate long with SL around 238 .
Note: This is just for analysis purpose, please do your own research before punching any orders.
🔍 For more technical analysis and trade setups, make sure to follow me on TradingView

All Time High + Volume Huge SpikesKey Highlights : 🔰
🔷 Script Name : Rallis India
🔷 Script Symbol : NSE:RALLIS
🔶 Resistance Level : Need Weekly Close Above Resistance Line🔥
🔶 Volume : Huge Volume Spikes 💚
🔷 Tata Group Stock 🔥
🔷 Great Stock For Long Run 🔥
👉🏻 Rule No.1 : When You Get 100% , Exit 50% !!
👉🏻 Rule No.2 : Always Remember Rule No. #1
👉🏻 Rule No.3 : Always Do Basket Of 9 - 10 Stocks, Never Buy Solo Stock. 😊
Disclaimer : This is NOT Investment Advice. This Post is Meant for Learning Purposes Only. Invest Your Capital at Your Own Risk.
Happy Learning. Cheers!!
Shyorawat Arun Singh ❤️
(@Shyorawat_ArunSingh)
Founder : Shyorawat Investing School

RALLIS - Rounding bottom break out and retest setupRallis India has given a break out of a rounding bottom on Daily time frame and is currently retesting. Taking support from 20 DEMA. The setup looks good for a possible 40% upside from current level.
*** For educational purpose only. No buy / sell recommendations.

RALLISH INDIA Rallish India
rsi above 55
agrochemical sector bullish now
short term swing trade
breakout with volume


Rallis IndiaThe double bottom pattern is considered complete when the price surpasses the resistance line. This breakout is a bullish signal, suggesting that the downtrend may be reversing, and an uptrend could be underway

Rallis India - At Strong ResistanceRallis India :
Currently at strong resistance
Sustaining 290 is crucial for upward move
