RAMCOCEM - Breakout in Weekly Timeframe and Monthly TimeframeThe price has been forming a pennant pattern since 2020, and it broke out last week. This setup could be considered for swing trading.
RAMCOCEM trade ideas

RAMCOCEM - Waves or Price Action?CMP: 1014
TF: Weekly
I tried my level best to mark all the possible internal counts for better understanding.. I have marked ONLY the IMPULSE counts and not the corrective ones.. It will be clumsy and difficult to read if I add everything to the chart.
Wave count suggests that the stock is in the Third of it's final 5th wave up. Usually, 3rd waves are great buying opportunities as there will be good movement in price with great momentum.
But Price Action suggest that it hasnt gone past the triangle or the previous supply zone yet.
What would you do? Comment below, that would describe your nature as a trader/investor
I am not a SEBI registered Analyst. Views are personal and for educational purpose only. Please consult your Financial Advisor for any investment decisions.

ramco cementbreat out happen at ramco cement.
buy - 910
sl - 880
target - 10%
follow risk reward
Disclaimer -
videos, presentations, and writing are only for educational purposes and are not intended for investment advice. I can't promise the accuracy of any information provided. please consult with your financial advisor.

Ramco Cements - Resistance Breakout ViewRamco Cements :
Resistance breakout possibility
Close above 900 is crucial for strong breakout

"Ramco Cements: Long Swing Trade Setup Hi All
Ramco looking good for swing and also if the stock falls below 880 good chance to buy dip
Target - 970
- 990
stoploss 855

RAMCOM CEMENTS long idea Hi All
Ramco Cements (RAMCOCEM) is currently trading around the 800 level, which presents a favorable buying opportunity. The stock is expected to find strong support at this level, indicating a potential upward movement. With a target price of around 950 in the short to medium term, investors can anticipate a significant upside potential. Additionally, a second target of 1050 provides an even higher potential return on investment. To manage risk, a stop-loss order can be set at 710, ensuring downside protection in case the trade moves against expectations. Overall, Ramco Cements presents an attractive trading opportunity with favorable risk-reward dynamics.
Target 1: 950
Target 2: 1050
Stop-loss: 710
Thank you

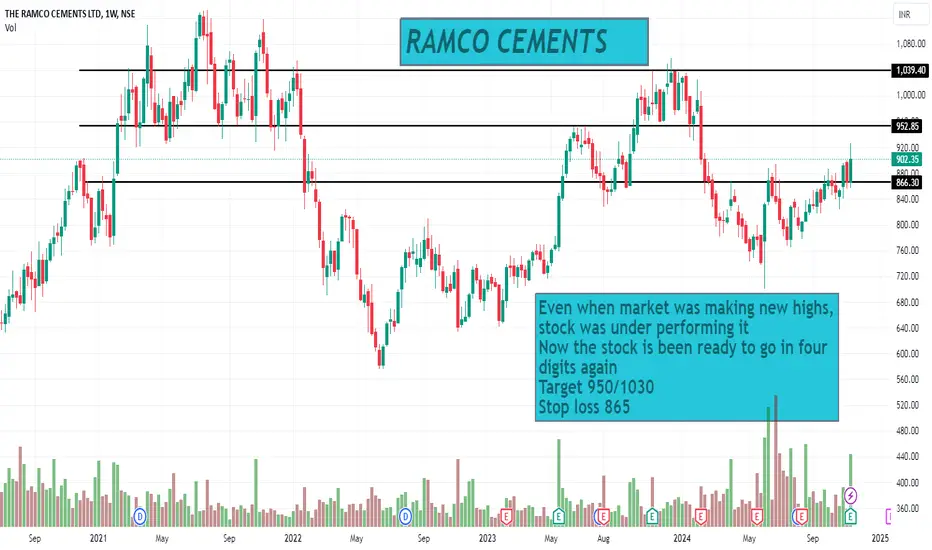
VIEW ON RAMCO CEMENTSEven when market was making new highs, stock was under performing it
Now the stock is been ready to go in four digits again
Target 950/1030
Stop loss 865
I am just representing my views
For educational purpose only.

RAMCOCEM:18% upmove possible🟢Picture perfect #VCP
🟢undertaking capex and increased cash from operations
🟢highest ever sales
🔴22% promoter holding pledged
🔴higher PE than some peers

The Ramco Cements Ltd.The Ramco Cements Ltd.
1. Price Action and Trendline Support
• The stock has been showing a gradual upward trend after a downtrend in the previous year. An ascending trendline (green line) is visible, acting as a support level, which is a positive sign for continuation of the uptrend.
• The price currently trades above both short-term (9-day) and long-term (50-day) moving averages, indicating strength and bullish sentiment in the stock.
2. Support and Resistance Levels
• R1, R2, and R3: These levels represent the resistance points.
• S1 and S2: These are the support levels. The fact that the stock is trading well above these support zones adds to the bullish sentiment, as it indicates that buyers are supporting the stock at higher levels.
3. Volume Analysis
• There has been a recent increase in volume, as shown in the volume bars at the bottom. Volume spikes during price rallies typically signal strong buying interest and can reinforce the uptrend, as it shows that buyers are actively pushing the price higher.
4. Indicators Supporting Bullish Momentum
• RSI (Relative Strength Index): The RSI is in bullish territory. An RSI above 50 usually indicates strength, and the upward movement of the RSI suggests growing buying momentum.
• MACD (Moving Average Convergence Divergence): The MACD line is above the signal line, with a positive histogram, indicating a bullish crossover. This further supports the bullish momentum, as it suggests that the stock may continue to see upward movement.
Summary
The Ramco Cements Ltd. is exhibiting bullish momentum due to strong support from technical indicators, a rising trendline, and increased volume. The stock’s position above both short-term and long-term moving averages, coupled with a positive RSI and MACD, supports the bullish outlook.

Ramco Cements on sell side Technical Pattern:
There is a descending triangle pattern forming, suggesting a potential bearish breakout.
The price is consolidating, and the blue line indicates a possible downward trend continuation.
Market Sentiment: The slight increase in price with moderate volume suggests cautious optimism, but the technical pattern indicates potential for a downward move.

VIEW ON RAMCO CEMENTSStock is under performing the market
It can show a good move potentially also
Target 880/950/1000
Stop loss 840/810
I am just representing my views
For educational purpose only.

Ramco cements ltd., Looking going; short term investmet; Add this to watchlist and wait for entry.👁️🗨️
For short term investment ;
Leave a " Like If you agree ".👍
.
Wait for small retracement & daily candle to close above - "840".
Trade carefully untill ENTRY level.
.
Entry: 840 / 780
Target: 870-915-1040-1100
sl: 815 (840) / 780 (765)
major stoploss / support: 780.
.
Enter only if market Breaks
"Yellow box" mentioned.
.
.
Don't make complicated trade set-up.📈📉
Keep it " simple, focus on consistency "💹
Refer our old ideas for accuracy rate🧑💻
Follow for daily updates👍
.
Refer old posted idea attached below.

This stock will break free.Ramco Cem CMP- 835.35
Elliott- A new series has started in this counter. Hence to me this is extremely bullish.
Volume- that's slow accumulation by the bulls.
Patterns- the 3 day chart on the left is loaded. It has a V shaped recovery a directional signals. It also has an inverted head and shoulders pattern, which is a bullish reversal pattern. That neckline is also considered very bullish.
Candlestick- the Key reversal at the bottom is again a directional signal.
Fibs- the first good resistance is at 862. We have a falling trendline too at the same zone. So a 3day candle close above 862 is where my buy is triggered.
Conclusion - this stock hasnt done much since 2018. Now all the bullish signals are flashing again. Keep and eye on this one and buy and hold above 862.

Ramco CementPossible Scenarios:
Bearish: If the price continues under the downtrend resistance and breaks below support levels (700 or 670.55), further downside could be expected.
Bullish: A breakout above the downtrend line could signal the end of the correction and potential start of a new impulse wave.
Wave Count: The Elliott Wave structure seems to be in a corrective phase.
Downtrend Line: A resistance trend line is drawn connecting recent highs, showing a bearish sentiment. Price has been moving within this corrective structure under this resistance.

Ramco Cement Swing Long Setup - Ramco Cement looks all set for an expansion
- Ramco is currently trading at 831
- Accumulation Zone - 815-825
- SL - 3%
- Chase - 8%

Ramco cem had made a double top pattern.Ramco cem make double bottom pattern and it is near to breakout. I think it gives a bullish moment when it cross 200ma at 1d time frame. After breakout it may reach the target of 880-895.

Ramco Cements Date 23.08.2024
Ramco Cements
Timeframe : Day chart
Remarks : Bullish on mid term = 20% upside
Tools used
1 Harmonics : AB = CD pattern
2 Exponential Moving Average : 200 ema
3 Chart pattern : Diamond Pattern
4 Ichimoku Cloud
5 RSI : Overbought/oversold & upthrust/downthrust
6 Fibonacci : Sequence
7 Elliot wave : 5-3-5-3-5 waves
Regards,
Ankur

RAMCOCEM PERFECT BAT UNDER FORMATION WEEKLY CHARTRAMCO CEMENT
1. Weekly Bat Pattern under formation
2. Price Taking Support at 20 SMA (Daily and Weekly) 804-807 levels respectively
3. Narrowing Bollinger Bands on daily and weekly charts with Price constantly sustaining above middle band
4. Double Bottom visible on Weekly charts
5. Can be a low risk bet to buy on dips and dips with stop loss below 20 Week SMA
Lets See How It evolves
Disclaimer: NOT A BUY / SELL RECOMMENDATION I am not an expert I just share interesting charts here for educational purpose and not to be taken as buy/sell recommendation. Please seek expert opinion before investing and trading as trading/ investing in market is subject to market risks. I do not hold any position in the stock as on date but I may look to buy on dips with my own Risk Reward matrix.

Ramco Cements looking to rocketAs usual, Good uprun.
Price coming back into an orderblock and showing some strength.
Wait for a good long opportunity.

Value Buy SetupMonthly
RSI 40 support Jun Volume good
Weekly
RSI 40 support
Daily
RSI Perfect Range Shift , 40 support
Fib 50%
Trendline Role Reversal
Cloud Support
SL- daily RSI below 40
Educational Purpose

RAMCO CEM -long for 20 %price is at 50 day EMA and hoizontal trendline support
decent valuation at current levels
Target and SL marked
very low risk entry

THE RAMCO CEMENTS - SEIZING THE LONG SWING OPPORTUNITYSymbol - RAMCOCEM
Ramco Cements is currently trading at 772
730 - 770 is a good support area for The Ramco Cements.
I'm seeing a trading opportunity on buy side.
Buying Ramco Cement Futures at CMP 772
I will be adding more if 745 comes & hold with SL of 730
Targets I'm expecting are 812 - 845 - 930 & beyond.
Disclaimer - Do not consider this as a buy/sell recommendation. I'm sharing my analysis & my trading position. You can track it for educational purposes. Thanks!
