The Ramco Cements Ltd - 05.12.2021The Ramco Cements Ltd - 05.12.2021
The stock is trading @ 950 levels
The prices are below ema
The stock is trading under a Channel Range
There is a Doji in weekly chart
Stochastic Bullish Divergence in Weekly Chart
let the prices go above 981 levels
watch out for the price action
RAMCOCEM trade ideas


RAMCOCEM LONG VIEWHello Everyone :)
As per Technical view i see RAMCOCEM has a potential of 10-12% upside in a very short span of time.
RAMCOCEM is fundamentally good and can also be taken as long term bet.
This stock has been consolidating and we can see it is on the demand zone and that makes the sense to go Long.
PS: This is my view and i can be Wrong, This data is Shared for Educational purpose only.
Please consult your Financial Advisor before making an Investment
#Long
#Bulls #Reality #Sector

Ramco Cement Trade Setup For TomorrowAs you can see in the chart, 924 is strong support many times stock tested this level.
.
If tomorrow, stock break the support level & goes below 924, we can buy this trade for the target of 900.
.
What's your view on this comment below in the box.
.
Note: we will only buy this trade once it goes below 924.


looking goodDISCLOSURE
This is only for educational purpose
This is not a recommendation
I am not SEBI registered
Do not TRADE/INVEST basis what I publish here
I am not responsible for your loss or gain
It is prudent to assume that I have ulterior motives in publish this
I and my clients might or might not have a position, I and my clients might or might not have a opposite position


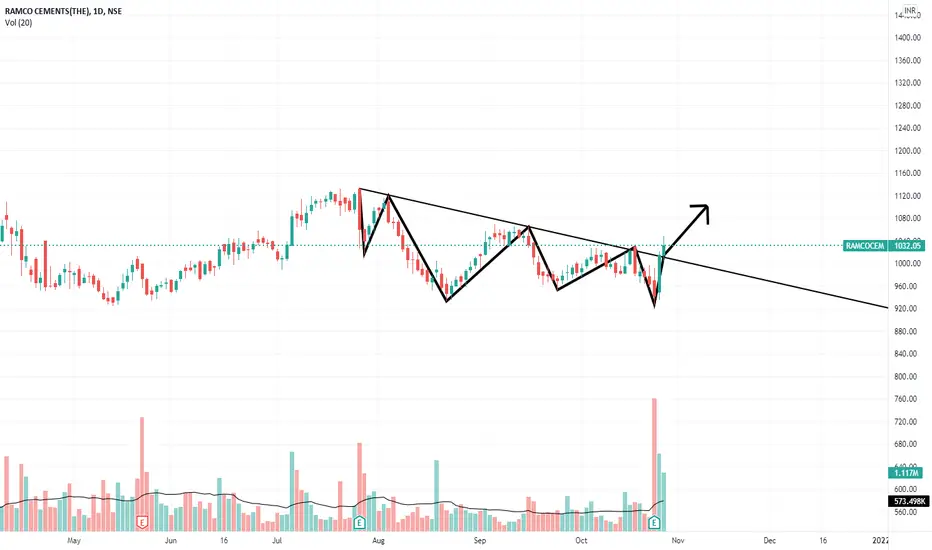
POSSIBLE UP MOVE| RAMCO CEMENTSThe stock breaks the upper trend line then retested and breaks the previous resistance ( target 1). And repeated the same retest which it done previously. Now the restest is done we can expect a possible upside move.
.
(THIS IS NOT A CALL JUST FOR EDUCATIONAL PURPOSE DO YOUR OWN ANALYSIS BEFORE INVESTING)
buy above given levelMoving average in support
MACD crossed
Breakbout to triangle about to happen
breakout of past resistance level about to happen
SL TP as mentioned on chart


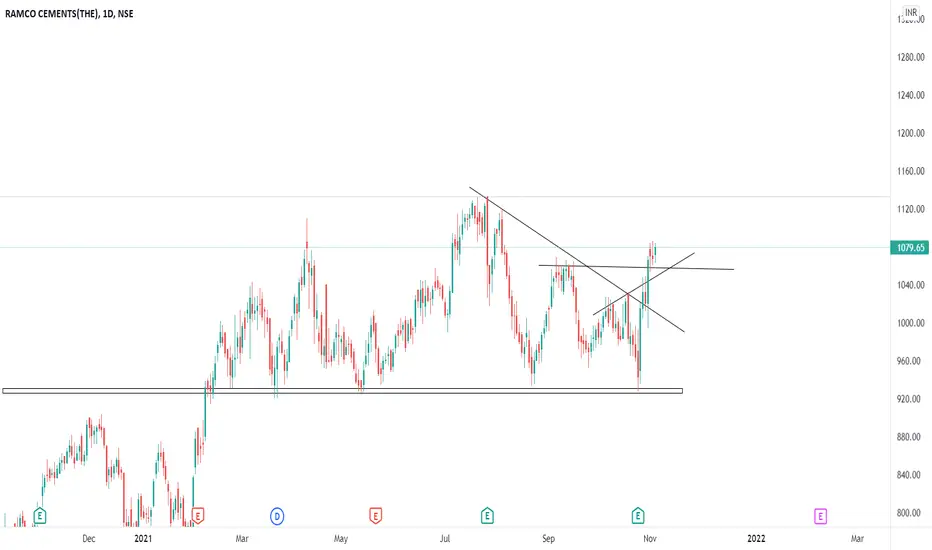
RAMCOCEM - short term Bearish-- The script has a strong support level in the range of 933 and resistance at the range of 1110.
-- In the daily time frame, price starts to form a wedge pattern.
-- The target level for the wedge pattern is decided by the width of the broadest part of the triangle.
* The content provided in this blog is purely only for educational purposes. I am not a registered investment advisor or research analyst. So consult your financial advisor before making a decision

RAMCOCEMENTRamco cement Opportunity for long term investment weekly price movement attractive for investment before investment guide your finance adviser


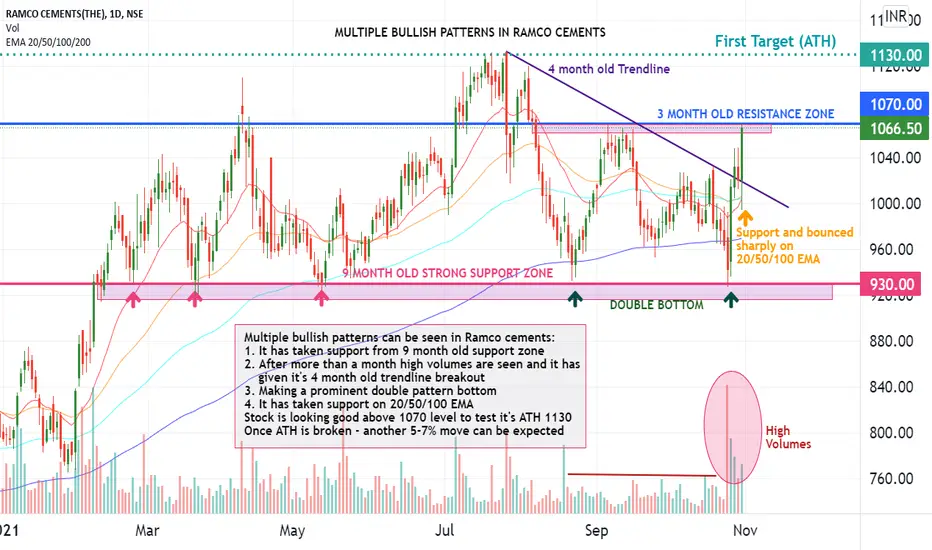
MULTIPLE BULLISH PATTERNS IN RAMCO CEMENTSMultiple bullish patterns can be seen in Ramco cements:
1. It has taken support from 9 month old support zone
2. After more than a month high volumes are seen and it has given it's 4 month old trendline breakout
3. Making a prominent double pattern bottom
4. It has taken support on 20/50/100 EMA
Stock is looking good above 1070 level to test it's ATH 1130
Once ATH is broken - another 5-7% move can be expected
Learn & earn,
Dr. Tanya Kumar

Simple Trade Setup | RAMCOCEMENT | 01-11-2021 [ INTRADAY]NSE:RAMCOCEM
I am posting this from one of the follower's request on Twitter.
Observations:
1) On daily time frame, we can see it took Good support from 50DMA and gave breakout of 1050 level.
If it gives dip till 1040/1050 level and takes support from it then it will be buying opportunity.
Target will be 1140.
Please refer below chart : 1day Time Frame.
2) On 15min time frame we can see it gave breakout of cup and handle pattern.
Please refer below chart : 15min Time Frame.
-------------------------------------
Trade Setup for Date 01-11-2021:
1) Don't Jump in to trade at the beginning of the market. Let it get settle for 15-20min first and judge the price action.
2) Everything is mentioned on the chart. I hope it is easy to understand.
3) All the levels will work as support, resistance, entry and exit w.r.t price action near that level.
4) Avoid gap up or gap down chase. Wait and trade between levels.
Please refer below chart for levels.
Hope I made it easy to understand it.
Do comment your doubt or suggestion.
Note: Trade with Strict SL. It may or may not hit all the levels. So one can book profit / loss at respective level considering how price action works near that level.

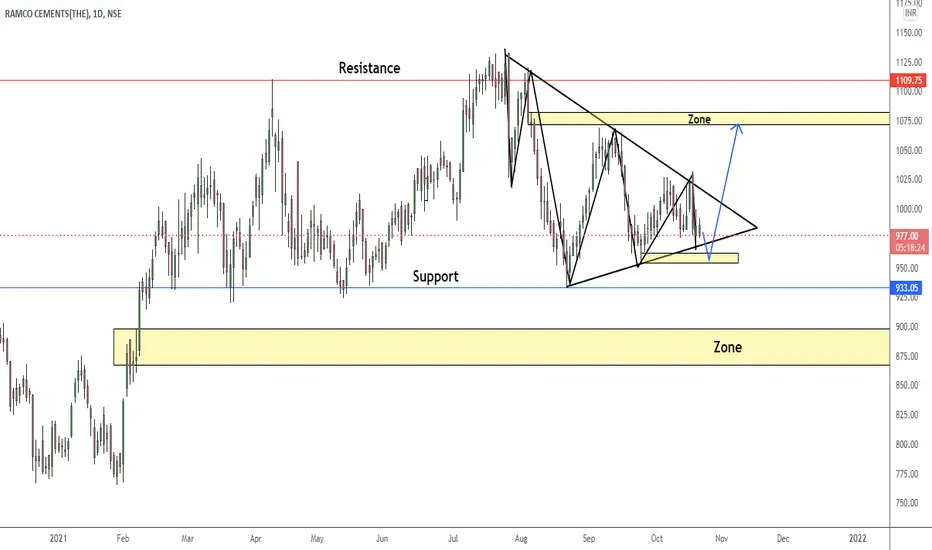
Swing Opportunity in Ramco CementsGo Long above 1027.1 for Targets of 1077.95 and 1128.8 with SL 976.25
Reasons to go Long :
1. On a daily timeframe if we draw the Fibonacci retracement tool from recent swing low (point A) to recent swing high (point B) then we see stock took support from 0.382 Fibonacci level.
2. A bullish chart pattern, Double Bottom (W pattern) is formed around 0.382 Fibonacci level.
3. Also a bullish candlestick pattern Inverted Hammer (marked with orange color) is formed around 0.382 Fibonacci level.
4. In addition to this the stock is forming a triangle pattern and is about to give a breakout.

RAMCOCEM | RSI + Trendline breakout - Looks good for 20%RAMCOCEM | RSI + Trendline breakout - Looks good for 20%
CMP : 1040
SL : 985
Target : 1250
1:4+ risk reward setup
(Target calculated based on Fib)

Ramco cement taking support at crucial support zoneThe Ramco cement is in an up trend , Bullish sentiment are still there but it is on chart making a crucial support zone between 930 to 920 , keep an alert on this level as reversal setups on these zones are potential trades.

Ramco cement 1d DISCLAIMER : This for education and knowledge purpose Before taking any decision once consult with your financial advisor or do your own research. The channel would not be responsible for any financial gain as well as for losses. I am not SEBI registered.

