Ye Chart Kuch Kehta Hai - Ramco Industries Limited (For Study)Based on the latest available fundamental and technical analysis, here is a rationale for considering a position in Ramco Industries Limited:
Fundamental Analysis
Ramco Industries has shown steady revenue growth, with a 10.5% YoY increase in Q1 FY2025-26 and a net profit growth of 28.3% in the same quarter, signaling improving operating performance and profitability.
The company’s trailing twelve months (TTM) financial ratios show a P/E of 28.55, P/B of 0.7, and P/S of 1.79, indicating that the stock may be reasonably valued with potential upside given its book value and sales metrics.
Ramco has a low debt-to-equity ratio (~0.03), indicating strong solvency and low financial risk, which supports financial stability and sustainable growth.
Recent quarters show positive trends in operating cash flow, reaching the highest in three years, suggesting good cash generation capacity.
The company is making consistent efforts to improve profitability and efficiency despite a moderate Return on Equity (ROE) around 2-4% range, indicating room for operational improvement.
Technical Analysis
The stock has been showing a positive trend with quarterly revenue and earnings growth supporting bullish momentum.
Recent trading activity shows strong volume spikes and price support near 310–345 INR levels, indicating good buyer interest at current valuation zones.
Momentum indicators and technical signals (such as MACD) reflect positive momentum and suggest a likelihood of continued upward movement in the near term.
Technical resistance levels have been tested, and breakout potential exists if these levels are decisively breached, providing a possible upside trigger.
Summary
Ramco Industries Limited presents a compelling case for investment based on solid fundamental performance improvements, positive cash flows, low leverage, and favorable technical indicators. While some fundamental metrics like ROE could improve, the company’s earnings growth and prudent financial management reduce downside risk. The stock’s current technical setup supports a potential upward price movement, making it an attractive position for investors seeking growth with moderate risk exposure.
RAMCOIND trade ideas

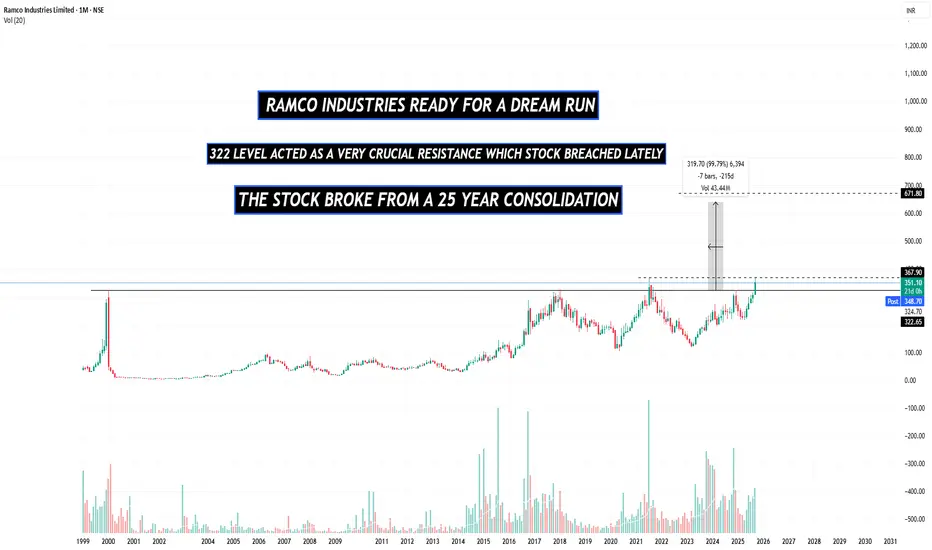
RAMCO INDUSTRIES NEAR MULTIYEAR BREAKOUTThe stock has not been able to breach the crucial resistance of 322 since 1999, pretty strange.
but now the the stock ha rallied past that level with good momentum enforcing further trust in the stock
The stock is also trading below it's book value of 488 again a pretty strange yet interesting opportunity.
It is Part of the Chennai-based Ramco Group;
Ramco Industries Ltd. is engaged in the manufacture of Fiber Cement (FC) sheets and Calcium Silicate Boards (CSBs). Company is also engaged in the spinning of cotton yarn; sale of surplus electricity generated from its windmills and computer software.
The company operates through 10 manufacturing plants for Building Products with a combined production capacity of 10,00,000 TPA
The company's profits and sales have also skyrocketed
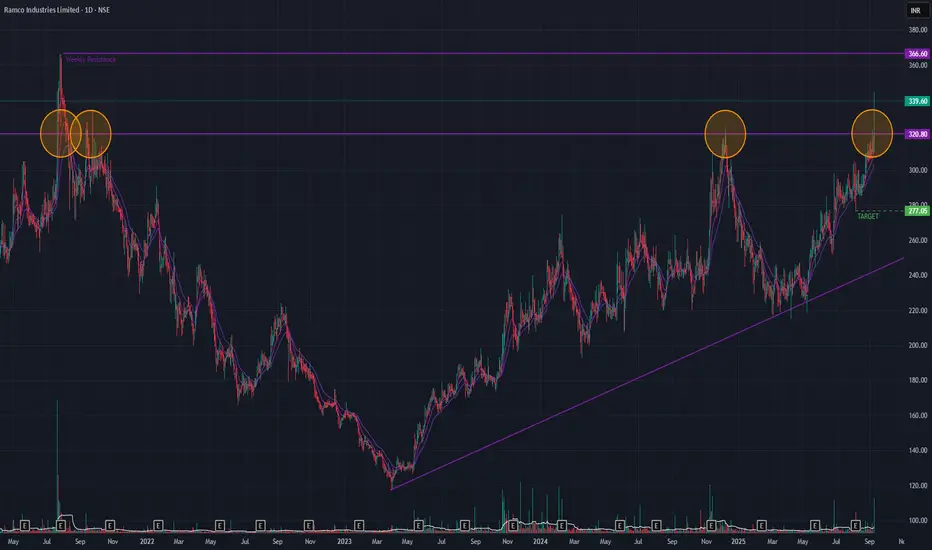
Ramco Ind (Daily Timeframe) - Is this a false BreakOut??Ramco BrokeOut of a multi-year resistance trendline (since 2000) today with huge volume and stock price zooming by 8.03%. The last time it BrokeOut of this trendline was in 2021 which did not sustain but the stock made a new ATH then. Short-term EMAs are in PCO state as well as EMAs & DMAs are in Golden Cross-over state.
On the upside the stock may reach 366 levels & on the downside the stock may reach 277 levels.
The price-action in the coming days will dictate how the stock moves. Keep monitoring.
Ramco Industries - Monthly LongBeautiful Double Top Formation on monthly charts.
Stock might go for a Triple top Formation in the coming months.
Good Point to Buy Between 129-113. With SL of 101
Stock has good support at 113.
Fundamentals also look above average.
Holding time 6-8 months for targets 181/228/280

RAMCO INDUSTRIES Weekly Chart - Cup N Handle pattern Ramco Industries Weekly Chart.
Cup N Handle Chart pattern formation.

BUY TODAY SELL TOMORROW for 5%DON’T HAVE TIME TO MANAGE YOUR TRADES?
- Take BTST trades at 3:25 pm every day
- Try to exit by taking 4-7% profit of each trade
- SL can also be maintained as closing below the low of the breakout candle
Now, why do I prefer BTST over swing trades? The primary reason is that I have observed that 90% of the stocks give most of the movement in just 1-2 days and the rest of the time they either consolidate or fall
Cup and Handle Breakout in RAMCOIND
BUY TODAY SELL TOMORROW for 5%

RAMCOINDSwing Trader ! Price Action Follower!
07.11.2024 High potential break out chart updates.
Disclaimer-I am not SEBI registered or authorized analysts. The charts and level posted will be my personal view only.
# MARK MY TRADE

RAMCOIND LONGAccording to the Elliott Wave Theory, the Elliott Wave Structure describes the pattern and arrangement of price movements in financial markets.
Based on extensive analysis, it appears that the stock has completed wave 5 on the daily chart. A corrective wave (a-b-c) has begun in black circle. Currently, it appears that the first wave (a) of correction is over and the in the second wave (b) in black colour. There is a chance that the second wave could extend up to 61.8% (Rs 290) of the length of the fifth wave from the lowest point of the first wave (a).
Wave (b) is anticipated to be comprised of approximately three subdivisions (a-b-c) in blue colour.
Wave a and b in blue colour is finished and wave c is going on.
Wave c in blue colour is unfolding in five sub waves in red colour.
Wave levels shown on chart.
Level of Invalidation
The Wave (ii) has been identified as the invalidation level at 213.10. If the price falls below this level, it can indicate that the expected Elliott Wave pattern is not as it seems.
I am not a registered Sebi analyst. My research is being done only for academic interests.
Please speak with your financial advisor before trading or making any investments. I take no responsibility whatsoever for your gains or losses.
Regards
VJ

Inverse Head and Shoulder PatternA clear inverse head and shoulder pattern and today (5 sept) given a breakout.


#RAMCOIND VCP BO in DTFStock was in Stage 4, the formed Stage 1
Stage 1 formed a C&H BO
Stock in Stage 2 formed VCP
Volume dry up before BO, BO with Volume
RS line made 52wh during VCP formation
EMA Rule in place

Ramco Industries: Inverse head & Shoulder formationRamco Industries is forming inverse head & shoulder on weekly time frame. Keep on radar for breakout.

Ramco Industries: Breaking out on weekly time frameRamco Industries is looking good on weekly time frame. Seems stock is attempting breakout after good accumulation. Keep on radar.

Ramco Industries: Forming Pole & Flag pattern on WTFRamco Industries is consolidating near breakout level and forming flag pattern on weekly time frame. Keep on radar.

Ramco Industries: Consolidating near breakout zoneRamco Industries is looking good on weekly time frame. Stock is consolidating in a range since last 4-5 weeks. Keep on radar for breakout.

Ramco Industries: Forming C&H pattern on WTFRamco Industries is looking good on weekly time frame. Stock is forming cup & handle pattern on Weekly time frame. Keep on radar for breakout.

Ramco Industries: Trading near breakout levels on weekly TFRamco Industries is looking good on weekly time frame. Stock is trading near breakout level. Keep on radar.

Ramco Industries: Looking good on weekly time frameRamco Industries is attempting breakout on weekly time frame from 2 weeks. Keep on radar.

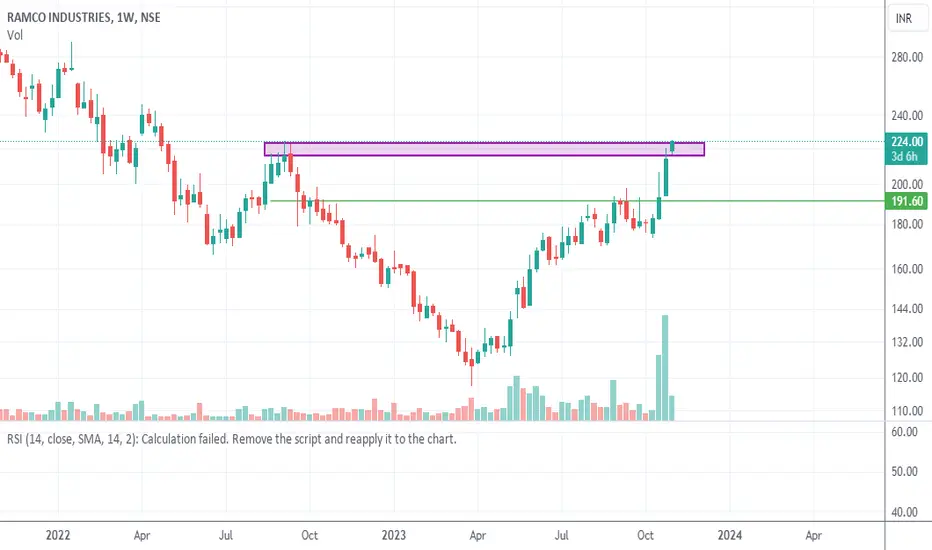
RAMCOINDRAMCOIND:
The stock has recently given a breakout on weekly chart of 220 with strong volume.
Next levels to watch are : 249.0/272.1/300

Ramco Industries: Trading near breakout level on WTFRamco Industries is looking good on weekly time frame. Stock is trading near breakout level. Keep on radar.

Ramco Industries: Trading near breakout levelRamco Industries is looking good on weekly time frame. Stock is trading near breakout zone. Keep on radar.
Ramco Industries: Trading near breakout levelRamco Industries is looking good on weekly time frame. Stock is trading near breakout level. keep on radar.

RAMCO INDUSTRIES TARGET 221 STOPLOSS 166This script forms monthly and weekly inverse head and shoulder with a bullish day chart. Target 221
