RAMKY INFRA TATrend and Structure
The stock is showing a clear uptrend channel since early 2025, marked by higher highs and higher lows.
Price is currently near the middle-upper part of this channel, signaling sustained bullish momentum.
The presence of a Fair Value Gap (FVG) area around 630–640 INR indicates a recent imbalance zone where lingering buy orders may fill, often acting as a support area.
Support and Resistance
Immediate support is the FVG zone near 630-640 INR.
Resistance levels are marked by two clear zones:
TGT-1: Around 680-700 INR, corresponding to a previous significant resistance.
TGT-2: Around 760-780 INR, near the major highs from late 2024.
Entry Strategy
Consider a long entry near the FVG zone (630-640 INR), if price shows bullish confirmation such as strong bullish candles or volume.
The FVG and the lower boundary of the uptrend channel provide a double support zone, reinforcing the long bias.
Stop Loss (SL)
Below the lower boundary of the uptrend channel, around 600 INR, allowing room for volatility while protecting downside risk.
Targets (TGT)
TGT-1: 680-700 INR — first profit booking zone.
TGT-2: 760-780 INR — extended profit target if momentum continues.
Ramky Infrastructure Limited
No trades
What traders are saying

RAMKY 1 Hour View 📈 1-Hour Intraday Technical Overview
Based on the latest intraday data, here's a snapshot of RAMKY's performance:
Current Price: ₹687.10
Daily Range: ₹594.40 – ₹705.00
Volume: Approximately 6.4 million shares
RSI (Relative Strength Index): 73.06 (indicating overbought conditions)
MACD (Moving Average Convergence Divergence): 11.03 (bullish momentum)
ADX (Average Directional Index): 23.81 (moderate trend strength)
Supertrend Indicator: ₹560.31 (suggesting an upward trend)
Parabolic SAR: ₹557.45 (supporting bullish trend)
Rate of Change (ROC): 14.39% (indicating strong momentum)
Chaikin Money Flow (CMF): 0.358 (positive accumulation)
Williams %R: -12.13 (approaching overbought territory)
Stochastic Oscillator: 36.47 (neutral, with potential for upward movement)
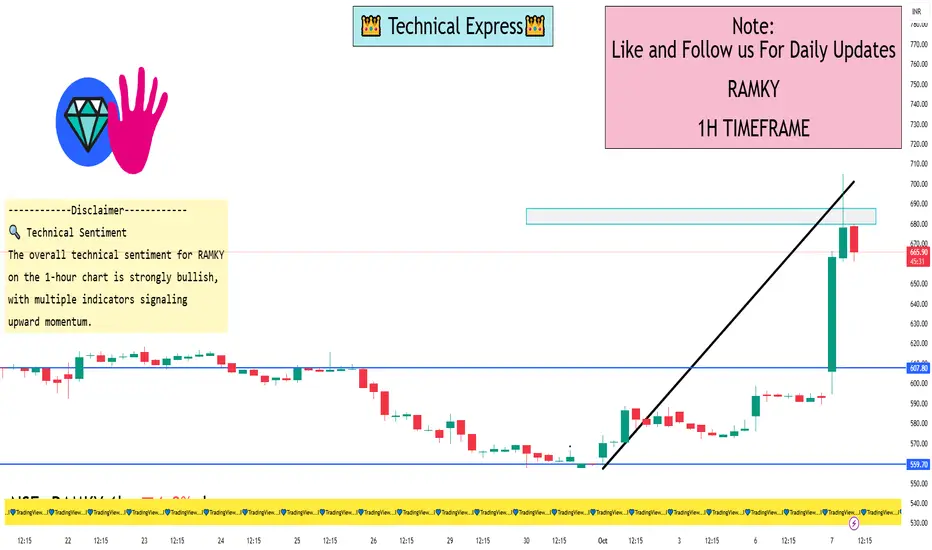
🔍 Technical Sentiment
The overall technical sentiment for RAMKY on the 1-hour chart is strongly bullish, with multiple indicators signaling upward momentum. However, the high RSI suggests that the stock may be approaching overbought levels, indicating a potential for short-term consolidation or pullback.
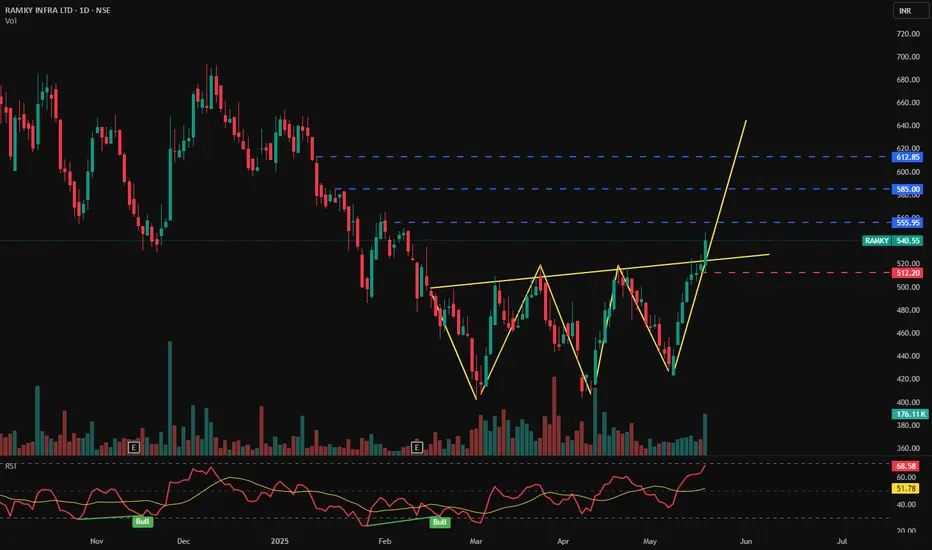
RAMKY INFRA LTD - Bullish Pattern📊 RAMKY INFRA LTD (1D) – CMP ₹540.55
📅 Date: May 21, 2025
📈 Exchange: NSE
📌 Ticker: RAMKY
🧠 Technical Analysis Overview
✅ Bullish Inverse Head & Shoulders Pattern:
Price has broken out of a clearly formed inverse head and shoulders pattern — a powerful trend reversal structure — indicating a strong bullish sentiment and possible long-term uptrend.
✅ Breakout Confirmation:
A sharp breakout above the neckline near ₹512 has occurred with strong bullish momentum and increased volume.
✅ RSI Indicator – 📈
RSI is at 68.58, approaching overbought levels but not showing divergence yet, confirming continued bullish strength. The RSI trend also shows recent bullish crossovers.
📍 Key Price Levels
📌 Support
🟥 ₹512.20 – Neckline retest level (ideal re-entry zone)
📌 Resistance (Targets)
🔵 ₹555.95 – Immediate target
🔵 ₹585.00 – Mid-term resistance
🔵 ₹612.85 – Major resistance / final target from pattern projection
💬 Potential Strategy
Breakout Entry already active above neckline
Pullback Entry possible near ₹512–₹520
SL below ₹512
Target 1: ₹555
Target 2: ₹585
Target 3: ₹612+
📌 Conclusion
RAMKY INFRA is breaking out of a strong inverse head and shoulders pattern with bullish volume and RSI confirmation. Watch for a potential retest near ₹512 for a high-probability entry. Targets lie ahead at ₹555, ₹585, and ₹612.
🛑 Disclaimer:
This analysis is for educational purposes only. Not investment advice. Always DYOR or consult your financial advisor.
RAMKY Trading Within Weekly Demand Zone (426.35-393.35)RAMKY is currently trading at 414.75, within its demand zone range of 426.35 to 393.35. This is a tested zone. Investors may watch for potential reactions or reversals from this level.
Disclaimer: This analysis is for informational purposes only and should not be considered financial advice. Please perform your own due diligence or consult a financial advisor before making any investment or trading decisions.

BUY RAMKY INFRAthere is breakout of pole and flag patter also it has formed INV H&S pattern. we may see 955/100 levels in coming few months. view neagted below 640 closing basis

Ramky looks goodChart -> Ramky Infra Ltd Daily
Breakout of downward channel!
CMP: 667
Good Range To Buy: 640 to 670
Targets: 725, 775
SL: 608 Daily Close
Disclaimer: This is for educational purposes only, not any recommendations to buy or sell. As I am not SEBI registered, please consult your financial advisor before taking any action.

Ramky Infrastructure LtdCompany Essentials
Market Cap ₹ 4,809.25 Cr II Enterprise Value ₹ 5,164.64 Cr.
No. of Shares 6.92 Cr II P/E 14.14
P/B 3.57 II Face Value ₹ 10
Div. Yield 0 % II Book Value (TTM) ₹ 194.45
CASH ₹ 91.09 Cr II DEBT ₹ 446.48 Cr
Promoter Holding 69.81 % II EPS (TTM) ₹ 49.17
Sales Growth 37.94 % II ROE 33.37 %
ROCE 34.62% II Profit Growth 67.96 %
Some Notes :
PE ratio of 14.38 which is low and comparatively undervalued
ROA of 13.93 % which is a bad sign for future performance
Current ratio of 1.51
Debt to equity ratio of 0.35 which means that company has low proportion of debt in its capital
Revenue growth of 37.94 % which is fair in relation to its growth and performance
Regards,
Ankur Singh

RAMKY Gann Fan, Elliot wave, Fib based targetsI have drawn Gann fan and Elliott wave for Ramky, till 1011 (LTH) these lines must work well, so far worked well as it can be seen. When it moves up near the Gann fan lines it is getting resistance and when it come down it is getting support from Gann fan lines.
These lines can help to book partial profit and buy again on lower levels - basically buy on dip sell on high.

Ramky Infrastructure Good breakout and retest done, Short term target 800 and Medium term 1000. Good fundamental stock, Reducing debts, under valued stock. Company has pledged 25% shares which may be released soon.

RAMKY INFRASTRUCTURE : A nice cup & handle pattern breakoutRAMKY INFRASTRUCTURE has given very nice breakout from the bottom.
It has a good potential upside for a short term Target of 20% to 40%.
🟢 Range : 640-650
🎯 Target : 755 / 840 / 1000
🛑 SL : below 560 (wcb)
🔰 This view is only for educational purpose not a Buy/Sell recommendation.

RAMKY INFRARAMKY INFRA - Looking for 50% upside and strong setup i will buy and sell on my targets 1000 accordingly..

Ramky Infra-Do not miss this Potential multibagger!Ramky Infra is a strong stock from infra sector with big potential to be a multibagger.
Stock has bounced from strong support and given a weekly breakout of trendline.
We can expect quick move in this stock. Keep in watchlist.
If you are a risk taker, you shouldn't miss this breakout.

Ramky - Channel BreakoutRamky :
Channel breakout done & currently at resistance
Long only above 1000 with support at 990, 980

RAMKY - Ichimoku Breakout📈 Stock Name - Ramky Infrastructure Limited
🌐 Ichimoku Cloud Setup:
1️⃣ Today's close is above the Conversion Line.
2️⃣ Future Kumo is Turning Bullish.
3️⃣ Chikou span is slanting upwards.
All these parameters are shouting BULLISH at the Current Market Price and even more bullishness anticipated AFTER crossing 890.
🚨 Disclaimer: This is not a Buy or Sell recommendation. It's for educational purposes and a guiding light to learn trading in the market.
#CloudTrading
#IchimokuCloud
#IchimokuFollowers
#Ichimokuexpert
Excited about this analysis? Share your thoughts in the comments below!
👍 Like, Share, and Subscribe for daily market insights! 🚀
#StockAnalysis #MarketWatch #TradingEducation #ichimoku


Ramky Infrastructure - Long Setup, Move is ON...#RAMKY trading above Resistance of 799
Next Resistance is at 972
Support is at 626
Here are previous charts:
Chart is self explanatory. Levels of breakout, possible up-moves (where stock may find resistances) and support (close below which, setup will be invalidated) are clearly defined.
Disclaimer: This is for demonstration and educational purpose only. This is not buying or selling recommendations. I am not SEBI registered. Please consult your financial advisor before taking any trade.

RAMKY (example of rounding Bottom)Only good example of Rounding Bottom for make all time High . for I am late for finding that stock . I also try to best of technically study .
.If You LIKE MY Idea …please…Boost its for motivation for study .
for MORE check in my TradingView ID
“Disclosure : I am not Sebi-registered.” This channel is for only technically educational purpose . Any profit/loss, I am not responsible.
Before taking any trade on our charts /calls , please consult your financial advisors. Thank you

Ramky Infrastructure - Long Setup, Move is ON...#RAMKY trading above Resistance of 626
Next Resistance is at 799
Support is at 429.30
Here are previous charts:
Chart is self explanatory. Entry, Resistances and Support are mentioned on the chart.
Disclaimer: This is for demonstration and educational purpose only. This is not buying or selling recommendations. I am not SEBI registered. Please consult your financial advisor before taking any trade.

Ramky Infrastructure - Long Setup, Move is ON...#RAMKY trading above Resistance of 429.30
Next Resistance is at 626
Support is at 271.50
Here is previous chart:
Chart is self explanatory. Entry, Resistances and Support are mentioned on the chart.
Disclaimer: This is for demonstration and educational purpose only. This is not buying or selling recommendations. I am not SEBI registered. Please consult your financial advisor before taking any trade.

RAMKYBook profits within the first 30 minutes of the market opening
- Try to exit by taking 10-15% profit of each trade
- SL can be taken when the 5/15 min candle closes below 44EMA
Now, why do I prefer swing trades? The primary reason is that I have observed that 90% of the stocks give most of the movement in just 3-4 days and the rest of the time they either consolidate or fall
CMP- 618
Target Price 800
Note:- I am not SEBI Registered This Trade is only educational Purpose


INTRADAY TRADE FOR TOMORROW If Stock opens Gap up or Gap down from the buy price please Avoid trade
DISCLAIMER:- I'm not SEBI registered research analyst or investment adviser. All stocks & information given is for educational purpose only. Consult with your financial advisor before taking the trade on my views given here.

Ramky BreakoutRamky Infra is looking for a multi year strong Breakout Resistance. This is my study and not a recommendation for buy and sell.
