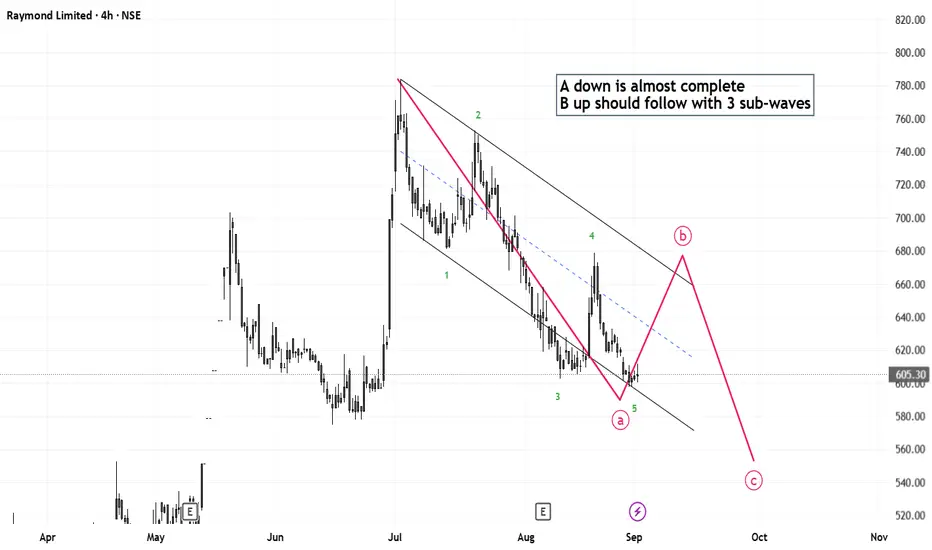
Elliott Wave Analysis of Raymond Limited RAYMONDThe script has completed 5 waves down with RSI divergence and now B up should be next and then C down to complete the corrective structure. This is on hourly frame.
Next report date
—
Report period
—
EPS estimate
—
Revenue estimate
—
839.70 INR
76.31 B INR
19.23 B INR
33.28 M
About Raymond Limited
Sector
Industry
CEO
Gautam Hari Singhania
Website
Headquarters
Mumbai
Founded
1925
ISIN
INE301A01014
FIGI
BBG000CYLWK5
Raymond Ltd. is a textile and branded clothing company, which engages in the provision of end-to-end solutions for fabrics and garmenting. It operates through the following segments: Textile, Shirting, Apparel, Garmenting, Tools and Hardware, Auto Components, Real Estate Development, and Others. The Textiles segment produces fabric, rugs, blankets, shawls, and furnishing fabric. The Shirting segment provides denim fabric and cotton yarn. The Apparel segment includes branded readymade garments. The Others segment includes non-scheduled airline operations and real estate development. The company was founded on September 10, 1925 and is headquartered in Mumbai, India.
Related stocks
raymond - technical view Hi.. this is educational purpose only : Team Raymond stocks technical support and trend for your notice.. Your comments are most welcome
RAYMOND: Expecting 40% upside potential⚡️Price Analysis:
1️⃣ Price broke the trendline and did a retest.
2️⃣ Price structure is bullish.
3️⃣ Price trading above EMA.
✨ Key Observations:
➡️ RRR favourable at CMP.
➡️ Expecting good momentum.
➡️ Good volumes
⚠️ Disclaimer: This is NOT a buy/sell recommendation. This post is meant for lear
RAYMOND LTD (NSE: RAYMOND) is about to break to the upside Right now, it is completing a descending trendline breakout, which is a bullish pattern.
All important levels have been marked on the chart.
Looking at the chart, we can say that if the price breaks to the upside, there is a high probability that the stock will reach the ₹2,318 target.
For the p

RAYMOND#RAYMOND after bouncing from the demand zone, traded in a range for a few days. We can see the change of character in the price with a strong volume.

RaymondRaymond is showing some good price action... big full green candles followed by a retracement of 0.2 fib levels. Enter at cmp for easy 40% gains

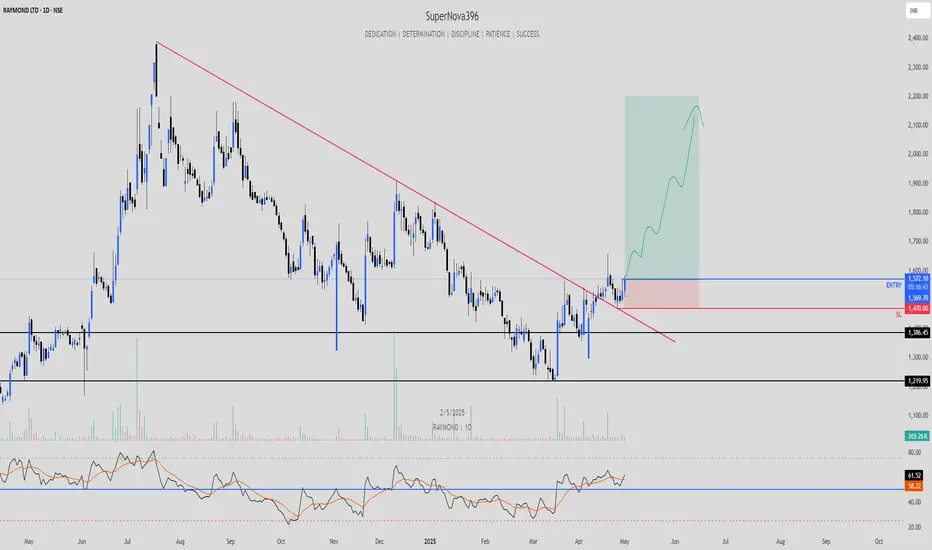
Raymond is ready to shineGeneral Trend Analysis
Long-term trend: The stock experienced a strong uptrend from May 2024 to July 2024, reaching a peak above INR 2,400.
Correction Phase: After the peak, there was a noticeable decline, forming a downtrend from August through November 2024, bottoming near INR 1,200.
Recent Recove

RAYMONDBreakout from the Descending Channel with good volume. This should mark the start of a fresh trend.
The stock may take some time moving sideways but the bottom of this retracement seems to be over here.

2 Amazing swing trading ideas for 11 Dec 2024 MarketsI daily make educational content videos for swing / positional trading

Raymond cmp 1805 by Daily Chart viewRaymond cmp 1805 by Daily Chart view
- Price Band 1555 to 1605 Support Zone
- Price Band 1950 to 2000 Resistance Zone
- Price getting ready to breach Falling Resistance Trendline
- Volumes have spiked heavily by demand based buying today
- Close Double Bottom and/or Triple Bottom by base at Suppor

See all ideas
Summarizing what the indicators are suggesting.
Neutral
SellBuy
Strong sellStrong buy
Strong sellSellNeutralBuyStrong buy
Neutral
SellBuy
Strong sellStrong buy
Strong sellSellNeutralBuyStrong buy
Neutral
SellBuy
Strong sellStrong buy
Strong sellSellNeutralBuyStrong buy
An aggregate view of professional's ratings.
Neutral
SellBuy
Strong sellStrong buy
Strong sellSellNeutralBuyStrong buy
Neutral
SellBuy
Strong sellStrong buy
Strong sellSellNeutralBuyStrong buy
Neutral
SellBuy
Strong sellStrong buy
Strong sellSellNeutralBuyStrong buy
Displays a symbol's price movements over previous years to identify recurring trends.
Frequently Asked Questions
The current price of RAYMOND is 576.45 INR — it has decreased by −1.50% in the past 24 hours. Watch Raymond Limited stock price performance more closely on the chart.
Depending on the exchange, the stock ticker may vary. For instance, on NSE exchange Raymond Limited stocks are traded under the ticker RAYMOND.
RAYMOND stock has fallen by −0.78% compared to the previous week, the month change is a −8.54% fall, over the last year Raymond Limited has showed a −0.60% decrease.
We've gathered analysts' opinions on Raymond Limited future price: according to them, RAYMOND price has a max estimate of 903.00 INR and a min estimate of 903.00 INR. Watch RAYMOND chart and read a more detailed Raymond Limited stock forecast: see what analysts think of Raymond Limited and suggest that you do with its stocks.
RAYMOND reached its all-time high on Jul 18, 2024 with the price of 793.35 INR, and its all-time low was 10.75 INR and was reached on Apr 28, 1999. View more price dynamics on RAYMOND chart.
See other stocks reaching their highest and lowest prices.
See other stocks reaching their highest and lowest prices.
RAYMOND stock is 3.00% volatile and has beta coefficient of 2.08. Track Raymond Limited stock price on the chart and check out the list of the most volatile stocks — is Raymond Limited there?
Today Raymond Limited has the market capitalization of 38.95 B, it has increased by 0.06% over the last week.
Yes, you can track Raymond Limited financials in yearly and quarterly reports right on TradingView.
Raymond Limited is going to release the next earnings report on Oct 27, 2025. Keep track of upcoming events with our Earnings Calendar.
RAYMOND net income for the last quarter is 53.25 B INR, while the quarter before that showed 1.33 B INR of net income which accounts for 3.91 K% change. Track more Raymond Limited financial stats to get the full picture.
Yes, RAYMOND dividends are paid annually. The last dividend per share was 10.00 INR. As of today, Dividend Yield (TTM)% is 1.71%. Tracking Raymond Limited dividends might help you take more informed decisions.
Raymond Limited dividend yield was 0.00% in 2024, and payout ratio reached 0.00%. The year before the numbers were 0.55% and 4.06% correspondingly. See high-dividend stocks and find more opportunities for your portfolio.
As of Oct 18, 2025, the company has 375 employees. See our rating of the largest employees — is Raymond Limited on this list?
EBITDA measures a company's operating performance, its growth signifies an improvement in the efficiency of a company. Raymond Limited EBITDA is 3.65 B INR, and current EBITDA margin is 8.52%. See more stats in Raymond Limited financial statements.
Like other stocks, RAYMOND shares are traded on stock exchanges, e.g. Nasdaq, Nyse, Euronext, and the easiest way to buy them is through an online stock broker. To do this, you need to open an account and follow a broker's procedures, then start trading. You can trade Raymond Limited stock right from TradingView charts — choose your broker and connect to your account.
Investing in stocks requires a comprehensive research: you should carefully study all the available data, e.g. company's financials, related news, and its technical analysis. So Raymond Limited technincal analysis shows the sell today, and its 1 week rating is neutral. Since market conditions are prone to changes, it's worth looking a bit further into the future — according to the 1 month rating Raymond Limited stock shows the buy signal. See more of Raymond Limited technicals for a more comprehensive analysis.
If you're still not sure, try looking for inspiration in our curated watchlists.
If you're still not sure, try looking for inspiration in our curated watchlists.