RBA at demand zone! Buyers are showing interest. Bottom formed?Restaurant Brands Asia Ltd (Weekly Chart)
Price is hovering exactly at a crucial demand zone between ₹60–₹63, which has acted as support multiple times in the past.
Recent candles show long lower wicks near support → buying interest is visible
Restaurant Brands Asia Limited
No trades
What traders are saying

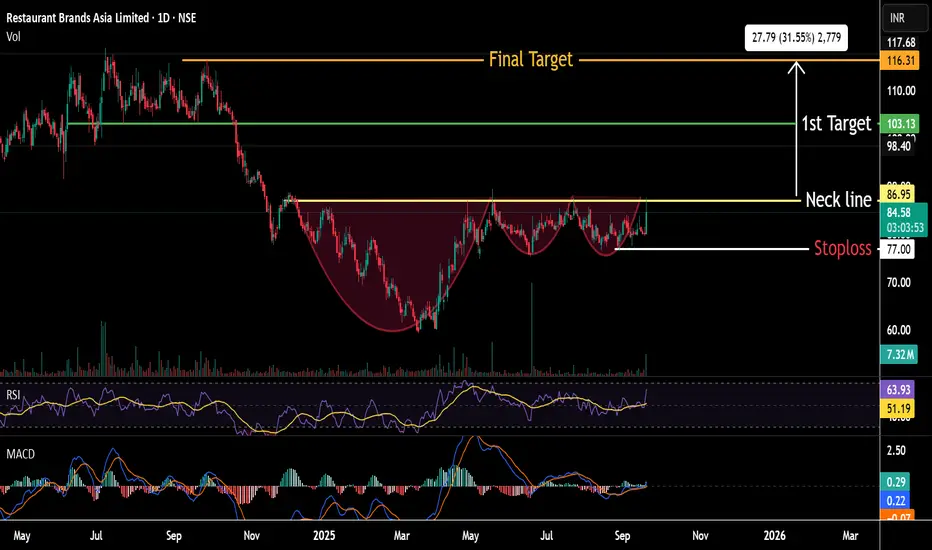
Complex Cup & Handle Pattern in Restaurant Brands ,Near Breakout Restaurant Brands Asia Ltd formed Complex CUP & HANDLE Pattern on Daily & Weekly Chart & Trading near breakout zone, Currently stock trading above important moving averages (20,50,100,200).RSI & MACD also suggesting positive momentum. Neck line is arround 87Rs ..Possible Target of Breakout will be arround 115 Rs ...with a stoploss of 77Rs
"Have it Your Way"Restaurant Brands Asia Ltd - CMP 81
About
Burger King India Ltd is an international QSR chain in India. It started operations in 2014 and has established ~456 restaurants across major cities. The company is an Exclusive National Master Franchisee of Burger King in India and its subsidiaries are Exclusive National Master Franchisee of the brands Burger King and Popeyes in Indonesia
Key Points
Business Overview
The company is the national master franchisee for the brand, BURGER KING. It holds exclusive rights to develop, open, operate, and franchise BURGER KING restaurants in India. In Indonesia, it operates as the master franchisee for brands like BURGER KING and POPEYES through its subsidiaries.
Product Offerings
The company offers a wide variety of food options, including burgers, wraps, beverages, sides, snacks, shakes, sandwiches, and desserts. Burger King’s in-restaurant cafe, BK Café offers coffee-based beverages, hot chocolate, complementary food items, etc.
Brand Position
Burger King is the 2nd largest fast-food burger brand globally, based on the total number of restaurants. Popeyes is one of the world’s largest chicken QSR chains.
📝 Chart Purpose & Disclaimer:
This chart is shared purely for educational and personal tracking purposes. I use this space to record my views and improve decision-making over time.
Investment Style:
All stocks posted are for long-term investment or minimum positional trades only. No intraday or speculative trades are intended.
⚠️ Disclaimer:
I am not a SEBI registered advisor. These are not buy/sell recommendations. Please consult a qualified financial advisor before taking any investment decision. I do not take responsibility for any profit or loss incurred based on this content.
Sunday Swings 20 April 2025 | Stocks and NiftyI make educational content videos for swing / positional trading
No Tips, calls or any future Predictions are done in the video, just sharing what the charts are talking .

The Q.S.R. space is all heated up and they left of this poor oneLooking at Devyani at 200+ P/E
Sapphire at 150+ P/E
Jubilant Foodworks at 130+ P/E
all the other players like Westside and others also playing at high valuations
I feel recently listed RSA and BBQ nation are pretty cheap

Weekly view - RBA - Sept 30, 2024RBA is consistently maintaining higher levels with rising volume on positive candles. While there’s plenty of upside potential, the move may be gradual. Definitely one to keep an eye on.

RBA-FMCG stocks boost can help this onePromoter Holding down.
Chart show bottom formation.
Safe trader can buy above 115, keeping SL 105.
Major resistance 130-140, one can hold this for target 200-250,if it closes above 140 level.
*Note-Only for educational purposes.

Restaurant Brand AsiaTechnical Analysis:
Over the past year, significant buyer interest has been evident in trading volumes, even as the stock price has been consolidating. The price has consistently maintained support at 90 and is currently fluctuating between 99 and 115, suggesting a phase of accumulation. The positive trading volumes further indicate strong buyer interest.
From a technical standpoint, the MACD on the weekly and monthly charts appears positive, though not particularly robust. However, the key observation is the increasing volume, which highlights sustained buyer interest. Additionally, a trend pattern is gradually forming on the daily and weekly charts.
As always, three resistance levels have been identified. A breakout and sustained movement above the first resistance level (R1) will be crucial in signaling stronger upward momentum in the coming months and years.
Potential Risk:
The primary risk to the stock's upward trajectory is the possibility of a broader market correction, particularly influenced by uncertainty in the Index and geopolitical tensions, such as the ongoing conflict between Israel and Iran.
Disclaimer:
This analysis is intended for educational purposes and is not a recommendation to buy. It is important to learn how to recognize and understand patterns in stock movements.

Amazing breakout on Weekly / Daily Timeframe - RBACheckout an amazing breakout happened in the stock in Weekly timeframe. Wait for weekly close above the breakout level.
Checkout an amazing breakout happened in the stock in Weekly timeframe, macroscopically seen in Daily timeframe. Having a great favour that the stock might be bullish expecting a staggering returns of minimum 25% TGT. IMPORTANT BREAKOUT LEVELS ARE ALWAYS RESPECTED!
NOTE for learners: Place the breakout levels as per the chart shared and track it yourself to get amazed!!
#No complicated chart patterns
#No big big indicators
#No Excel sheet or number magics
TRADE IDEA: WAIT FOR THE STOCK TO BREAKOUT IN LOWER TIMEFRAME AND RETRACE IF NEEDED. SL IS NEARER SUPPORT ZONE IN Daily TIMEFRAME.
PS: No new Nifty500 script can escape from me when making a breakout. :-)
Breakouts happening in longer timeframe is way more powerful than the breakouts seen in Daily timeframe. You can blindly invest once the weekly candle closes above the breakout line and stay invested forever. Also these stocks breakouts are lifelong predictions, it means technically these breakouts happen giving more returns in the longer runs. Hence, even when the scrip makes a loss of 10% / 20% / 30% / 50%, the stock will regain and turn around. Once they again enter the same breakout level, they will flyyyyyyyyyyyy like a ROCKET if held in the portfolio in the longer run.
Time makes money, GREEDY & EGO will not make money.
Also, magically these breakouts tend to prove that the companies turn around and fundamentally becoming strong. Also the magic happens when more diversification is done in various sectors under various scripts with equal money invested in each N500 scripts.
The real deal is when to purchase and where to purchase the stock. That is where Breakout study comes into play.
LET'S PUMP IN SOME MONEY AND REVOLUTIONIZE THE NATION'S ECONOMY!

RESTAURANT BRAND ASIA - Swing Trade Analysis - 6th July #stocksRESTAURANT BRAND ASIA (1W TF) - Swing Trade Analysis given on 6th July, 2024
Pattern: FALLING WEDGE BREAKOUT
- Weekly Resistance Trendline Breakout - Done ✓
- Weekly Support Zone Retest & Consolidation - Done ✓
- Strong Pullback candle with Volumes after consolidation - Done ✓
- Demand Zone retest for a Small SL and a better RR - In Progress
* Disclaimer

RBA FOR SWINGTRADE My View On This Script Bullish.
This Stock given Strong Breakout With Good Volume.
ENTRY :111.20
Target 1:120.50
Target 2:132.00
Stoploss:104.50
Sector : HOSPITALITY
Industry : RESTAURANTS
Category : NIFTYSMALLCAP

BURGER KING - 2x Potential Multi-bagger LongtermMonthly view:
Overview & Observation:
1. Beautiful Double bottom formation on monthly time frame.
2. Above 140 further buying strength can be expected.
3. RSI is indicating momentum.
4. Reversal structure formation.
Trade Plan:
1. ENTRY = CMP @ 111
2. STOPLOSS = 97
3. TARGET = 133,164, 190, 200++
- Stay tuned for further insights, updates and trade safely!
- If you liked the analysis, don't forget to leave a comment and boost the post. Happy trading!
Disclaimer: This is NOT a buy/sell recommendation. This post is meant for learning purposes only. Please, do your due diligence before investing.
Thanks & Regards,
Anubrata Ray

RBA simple swing trade set up1. Set up: Breakout
2. Trade Idea from triangle breakout
3. RR: 1:5
4.Trend: Probable reversal

RBA - Long term Investment stockIn this weekly chart wave (a or i) is completed at 137 and wave (b or ii) may be completed at 98 and (c or iii) is already started which can take this stock to 151-163-183 in coming months...

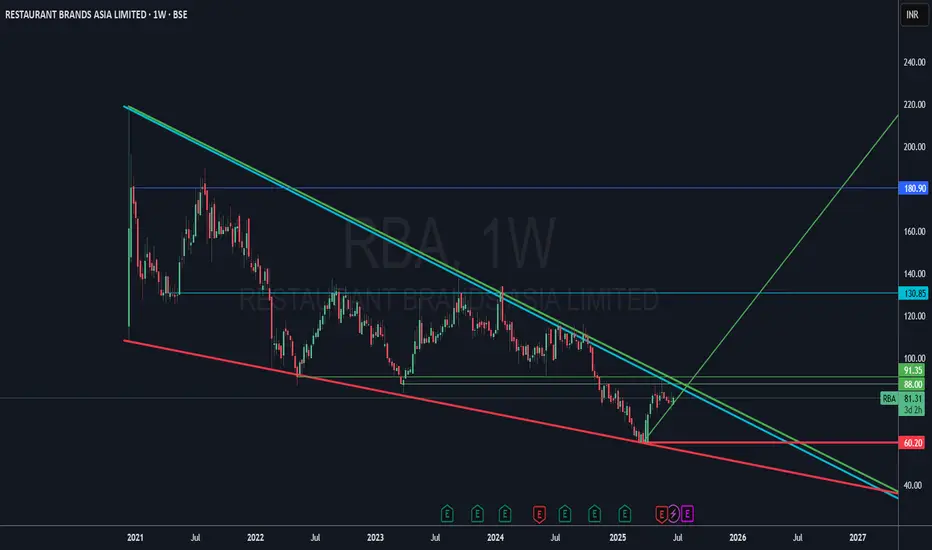
One and half year waiting time about to finishKeep an eye on this stock because it can break its one and a half year resistance any time and if it does so and then retests it then there will be a great opportunity to fly into the sky.

RBA weekly time frame ; Breakout is buildingRBA ; on weekly TF near trendline resistance
Increasing RSI may indicate Breakout in stock
Possible above 140
Targets 180,200

RBARBA is in a consolidation and as per the volume some big moves are expected.
NOTE: I'm not a SEBI REG. Study before investing.

RBARBA is a major player in the Hotel Industry. With tourism being the focus and the Govt promoting tourism, the Hotel Industry will stand to benefit. The economic growth in the country has also infused the willingness among people to eat out of their homes. The stock is now trending at good levels for entry.

RBA - Bullish Swing Reversal with VolumesNSE: RBA is closing with a bullish swing reversal candle supported with volumes.
Today's volumes and candlestick formation indicates strong demand and stock should move to previous swing highs in the coming days.
The stock has been moving along the horizontal support for the past few days which is indicating demand.
One can look for a 11% to 18% gain on deployed capital in this swing trade.
The view is to be discarded in the event of the stock breaking previous swing low.
#NSEindia #Trading #StockMarketindia #Tradingview #SwingTrade

RESTAURANT BRANDS ASIA LTD, BURGER KING (ACCUMULATE)Sector: Hospitality/ Industry: Restaurants
Market Cap: 5,619.06/- Cr. / Category: Small Cap
Current Price: 113/- Target Price: 137,165,190/- Stop loss: 84.5
Ticker: NSE: RBA Recommendation: BUY (Buy Around 94 - 91)
Date: 30/11/2023
Elliott Wave Theory Outlook –Restaurant Brands Asia ltd, Buying the Dips around 94 – 91
zone. (Ending Diagonal completed)
Hello traders. In this technical research report we’re going to take a quick look at
the Elliott wave chart of RBA ltd. As our members know, the stock is showing impulsive
bullish sequences that are calling for further strength. Our team recommended members
to avoid selling, while keep favoring the long side. Recently we are in corrective
structure in a higher time frame. In the further text we are going to explain the Elliott
Wave Forecast and trading strategy.
The stock is giving us wave (b)) pull back that is unfolding as a Zigzag pattern in a smaller
time frame. The price might reach extreme zone at 94 – 91, We don’t recommend selling
the stock and prefer the long side from the 50 & 61.8% Fib levels. As the Intermediated
trend is bullish, we expect to see at least 3 waves bounce from our buying zone. Once
bounce reaches 61.8% Fib against the (wave 3) high, we will make long position risk free
(put SL at Breakeven) and take partial profits. Invalidation for the long trades is at 84.5
level.
Momentum & Trend Indicators:
Relative Strength Index 41.49 Neutral
Rate of Change -1.93 Negative
Stochastic %K 24.06 Neutral

Stock: RESTAURANT BRAND ASIA LTD, In end of Accumulation Phase.The Basic Principles: Three Wyckoff Laws
PS—preliminary support, where substantial buying begins to provide pronounced support after a prolonged down-move. Volume increases and price spread widens, signaling that the down-move may be approaching its end.
SC—selling climax , the point at which widening spread and selling pressure usually climaxes and heavy or panicky selling by the public is being absorbed by larger professional interests at or near a bottom. Often price will close well off the low in a SC, reflecting the buying by these large interests.
AR—automatic rally, which occurs because intense selling pressure has greatly diminished. A wave of buying easily pushes prices up; this is further fueled by short covering. The high of this rally will help define the upper boundary of an accumulation TR.
ST—secondary test , in which price revisits the area of the SC to test the supply/demand balance at these levels. If a bottom is to be confirmed, volume and price spread should be significantly diminished as the market approaches support in the area of the SC. It is common to have multiple STs after a SC.
Test —Large operators always test the market for supply throughout a TR (e.g., STs and springs) and at key points during a price advance. If considerable supply emerges on a test, the market is often not ready to be marked up. A spring is often followed by one or more tests; a successful test (indicating that further price increases will follow) typically makes a higher low on lesser volume.
SOS—sign of strength , a price advance on increasing spread and relatively higher volume. Often a SOS takes place after a spring, validating the analyst’s interpretation of that prior action.
LPS —last point of support , the low point of a reaction or pullback after a SOS. Backing up to an LPS means a pullback to support that was formerly resistance, on diminished spread and volume. On some charts, there may be more than one LPS, despite the ostensibly singular precision of this term.
BU—“back-up”. This term is short-hand for a colorful metaphor coined by Robert Evans, one of the leading teachers of the Wyckoff method from the 1930s to the 1960s. Evans analogized the SOS to a “jump across the creek” of price resistance, and the “back up to the creek” represented both short-term profit-taking and a test for additional supply around the area of resistance. A back-up is a common structural element preceding a more substantial price mark-up, and can take on a variety of forms, including a simple pullback or a new TR at a higher level.
To Learn More: school.stockcharts.com

RBA | Swing Trade📊 Details
Burger King India Ltd is an international QSR chain in India. It started operations in 2014 and has established ~260 restaurants across major cities. The company is an Exclusive National Master Franchisee of Burger King in India and its subsidiaries are Exclusive National Master Franchisee of the brands Burger King and Popeyes in Indonesia
Disclaimer: This analysis is solely for educational purposes and does not make me a SEBI registered analyst.
If you found this analysis helpful, I encourage you to like and share it. Your observations and comments are also welcomed below. Your support, likes, follows, and comments motivate me to consistently share valuable insights with you.
🔍 More Analysis & Trade Setups 🔍
For more technical analysis and trade setups, make sure to follow me on TradingView: www.tradingview.com

RBAbouncing from six month rising trend line support strong support at 100 level at current level and on any fall toward 100 level accumulate and hold for next 6 month big move possible in stock .
