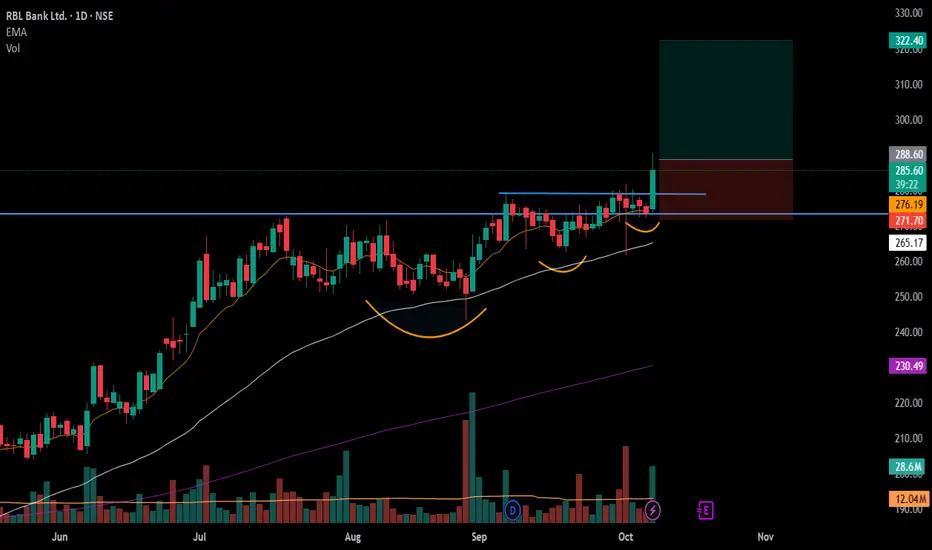
Double Top Pattern🧭 Overview
A Double Top is a bearish reversal pattern that indicates a potential end to an uptrend and a shift toward a downward phase. It forms an “M”-shaped structure on the chart, marked by two consecutive peaks at nearly the same level, separated by a moderate pullback known as the neckline. The pattern is confirmed when price decisively breaks and closes below the neckline, signaling weakening buying strength and a change in market control.
------------------------------------------------------------
🔑 Key Components of a Double Top Pattern
1️⃣ First Peak
Price rallies strongly to a high, marking the end of an extended upward move. A pullback follows, indicating the first sign of resistance.
2️⃣ Trough / Neckline
After the first peak, price retraces to a support area and stabilizes. This level forms the neckline, which acts as a key decision zone.
3️⃣ Second Peak
Price attempts to rise again toward the previous high but fails to break above it. This failure reflects weakening buying momentum and growing selling pressure.
4️⃣ Breakdown (Confirmation)
The pattern is confirmed when price breaks and closes below the neckline, signaling a shift in trend direction.
------------------------------------------------------------
📊 Chart Explanation
Two prominent peaks form near the same price level, highlighting strong resistance.
The pullback between the peaks creates a clear neckline support.
The second peak shows reduced strength compared to the first.
A decisive breakdown below the neckline confirms the reversal and opens the path toward lower levels.
------------------------------------------------------------
📝 Summary
• Double Top forms after a strong uptrend.
• Failure at the second peak indicates buyer exhaustion.
• Neckline acts as a key confirmation level.
• Breakdown below the neckline validates the reversal structure.
------------------------------------------------------------
⚠️ Disclaimer
📘 For educational purposes only
🙅 Not SEBI registered
❌ Not a buy/sell recommendation
🧠 Shared purely for learning and pattern understanding
📊 Not Financial Advice
RBL Bank Ltd.
No trades
What traders are saying

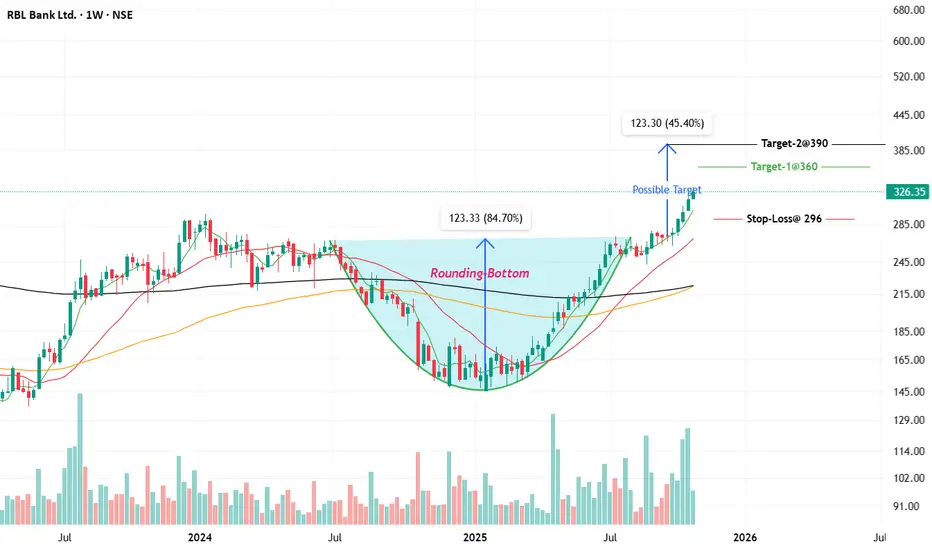
RBL Bank Shows a Powerful Cup Pattern Breakout on Weekly ChartRBL Bank has completed a textbook Cup & Handle pattern on the weekly timeframe, signaling a meaningful shift from a long consolidation phase into a fresh bullish trend. The rounded base formation highlights a gradual transition from distribution to accumulation, indicating growing confidence among long-term market participants.
The most critical development is the decisive breakout above the handle resistance zone, which had previously acted as a strong supply area. This breakout is supported by strong price expansion and follow-through candles, confirming that buyers are in control. Such breakouts from multi-month bases often lead to sustained trending moves rather than short-lived rallies.
From a price projection standpoint, the measured move of the cup suggests an initial upside target around 380+, followed by an extended projected target near 440+ if momentum continues to build. The current structure also shows healthy consolidation above the breakout level, which is a positive sign and often acts as a base for the next leg higher.
Risk management remains clearly defined in this setup. As long as the price holds above the breakout support zone near 280–290, the bullish structure stays intact. Any sustained breakdown below this area would invalidate the pattern and shift the outlook back to neutral or corrective.
Overall, RBL Bank appears to be transitioning into a new medium-to-long-term uptrend, backed by a strong chart structure and favorable risk–reward dynamics. This makes it a compelling setup for positional traders and investors who prefer structurally confirmed breakouts with clear targets and controlled downside risk.

RBL BANK @324Not a SEBI registered, just sharing idea. RBL @324 gave multi-month breakout from Cup & Handle @300 SL 303. Primary Target- 466 & 530 & investment target 720 in 1.5 -2 year.

RBLBANK 1 Day Time Frame 📊 Daily Support & Resistance Levels
Immediate resistances:
~₹315–₹318 area — observed short-term resistance zone and recent highs.
~₹325–₹330 — upper resistance band near recent 52-week highs.
Immediate supports:
~₹300–₹295 — important short-term support zone on daily charts.
~₹285–₹280 — next support cluster if breakdown below ₹295 occurs.
📉 Pivot & Intraday Levels (Indicative)
(These are based on typical pivot calculations from recent sessions — actual values will vary daily)
Pivot: around ₹290–₹295.
R1: ~₹295–₹300
R2: ~₹300–₹305
S1: ~₹285–₹280
S2: ~₹280–₹275
(Pivot-based levels give clues for intraday trading and are often recalculated each day.)
📈 Technical Indicator Context (Daily)
RSI (~50) — neutral momentum, neither overbought nor oversold.
Short MA structure shows mixed signals; some shorter SMAs/EMAs near current price.
MACD slightly bearish to neutral on some sources.
🧠 Notes for Daily Traders
Bullish break above ~₹318–₹320 with volume can open up short-term upside towards ₹325–₹330+.
A daily close below ~₹295 may signal short-term weakness and can expose deeper support around ₹285–₹280.

RBL pyramid entry set up1. Set up: Reversal with double bottom
2. continuation trend
3. Price showing reversal from equilbrium
4. Formation of rounding pattern

RBL Bank Ltd. (NSE)_Monthly Chart🔎 What to Watch Next:
Bullish Signal if:
Monthly close above ₹270–₹280 (breakout from both horizontal and trendline resistance).
Increased volume would support the breakout.
Bearish/Rejection Risk if:
Price faces rejection at this resistance zone and closes below ₹240–₹245.
May retrace toward ₹210–₹220.
📊 Outlook Summary
RBL Bank's technical setup suggests it is at a critical juncture. A confirmed breakout above the current resistance zone could unlock further upside potential. However, failure to break out could result in consolidation or a short-term pullback.
⚠️ Disclaimer : This report is for informational and educational purposes only. This does not constitute any form of investment advice or recommendation to buy, sell, or hold any security.

The wait is finally overRBL Bank CMP 320.75
RSI - i can see the change in trend in the RSI.
MA- the two faster MA's are about to cross the slowest one. This is on the monthly chrt and very bullish.
Price- the stock has moved from 150 to 300 without much correction. This is an indication of strength.
Conclusion - in my view as of now the minimum tgt is 620. The start of the big bear candle.

RBL BANK - Bullish Flag & Pole Breakout (Weekly T/F)Trade Setup
📌 Stock: ASAHI INDIA GLASS ( NSE:RBLBANK )
📌 Trend: Strong Bullish Momentum
📌 Risk-Reward Ratio: 1:3 (Favorable)
🎯 Entry Zone: ₹261.00 (Breakout Confirmation)
🛑 Stop Loss: ₹225.00 (Weekly Closing Basis) (-5 % Risk)
🎯 Target Levels:
₹275.40
₹289.85
₹304.25
₹318.65
₹333.10
₹347.50
₹ 361.00 (Final Target)
Technical Rationale
✅ Bullish Flag & Pole Breakout - Classic bullish pattern confirming uptrend continuation
✅ Strong Momentum - Daily RSI > 60, Weekly RSI >60 Monthly rsi >60
✅ Volume Confirmation - Breakout volume 130.71M vs previous day's volume 24.71
✅ Multi-Timeframe Alignment - Daily and weekly charts showing strength
Key Observations
• The breakout comes with significantly higher volume, validating strength
• Well-defined pattern with clear price & volume breakout
• Conservative stop loss at recent swing low
Trade Management Strategy
• Consider partial profit booking at each target level
• Move stop loss to breakeven after Target 1 is achieved
• Trail stop loss to protect profits as price progresses
Disclaimer ⚠️
This analysis is strictly for educational purposes and should not be construed as financial advice. Trading in equities involves substantial risk of capital loss. Past performance is not indicative of future results. Always conduct your own research, consider your risk appetite, and consult a financial advisor before making any investment decisions. The author assumes no responsibility for any trading outcomes based on this information.
What do you think? Are you watching NSE:RBLBANK for this breakout opportunity? Share your views in the comments!

Exit the rallyRBL Bank CMP 299.20
Elliott- the entire rally is a zig zag corrective pattern and is complete.
Fib - the rally to 38.2% is weakness.
Conclusion - generally wave A and wave C of the zig zag are equal. Hence to me this rally is over and is an opportunity to exit.

RBLBANK Swing TradeRBL Bank is currently trading at ₹306.10, down 1.64% from the previous close of ₹311.20. The stock is hovering near its demand zone, where buyers typically step in to absorb supply.

RBL Bank – Cup & Handle Breakout with Positive Relative StrengthTechnical View:
The stock has recently completed a cup and handle pattern, a bullish continuation structure, and is attempting a breakout from the handle region.
Price is comfortably trading above all key moving averages (50, 100, 200), confirming strong trend alignment.
The relative strength line vs Nifty is positive and rising, showing the stock is outperforming the broader market.
Volume spikes around the breakout zones suggest institutional accumulation.
Immediate resistance is seen near ₹285–₹290, and a successful close above this range could open up higher targets. Support lies around ₹245–₹250 (handle lows and 50DMA).
Market Context:
Banking stocks have been seeing rotation of interest as credit growth improves.
RBL Bank’s long base and recovery structure positions it well for a Stage 2 uptrend continuation.
Risk remains contained as the handle offers a defined stop-loss zone.
Conclusion:
RBL Bank is showing technical strength with a bullish chart structure, strong relative performance, and constructive volume behavior. A decisive breakout from the handle could signal the beginning of a strong trending move higher.

RBL BANKStock is maintaining the move above all key EMAs, last Swing Low (242.35) took support at 50 exponential moving average, which is a good sign.
Previous resistance is becoming a support, price is consistently taking support above 20ema.
A move from here may give a good upside move.
✅ If you like my analysis, please follow me as a token of appreciation :)
in.tradingview.com/u/SatpalS/
📌 For learning and educational purposes only, not a recommendation. Please consult your financial advisor before investing.

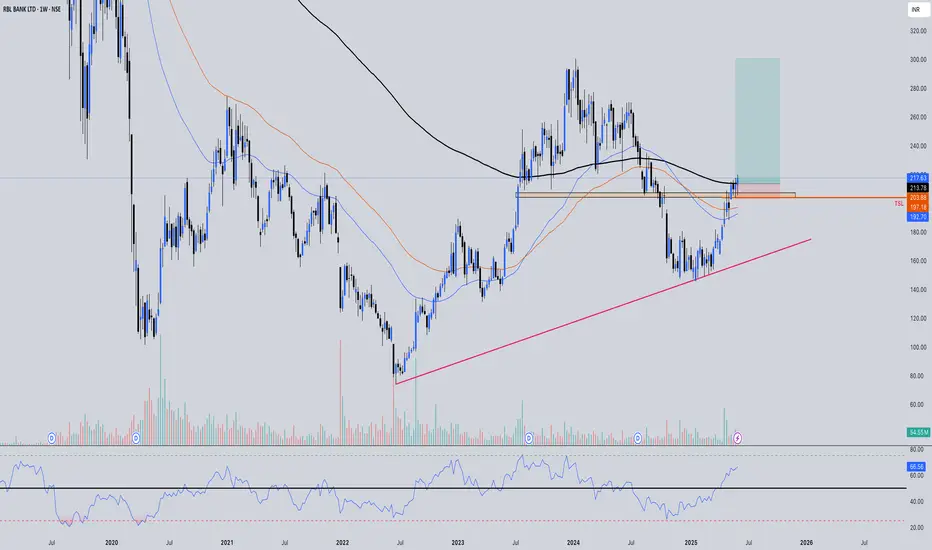
RBL Bank -Multi-Year #Breakout After 4 Years of ConsolidationRBLBANK has broken out of a multi-year resistance zone after a long accumulation phase since 2020.
This type of structure often leads to sustained upside momentum if the #breakout holds.
📌 Breakout Zone: ₹280 – ₹300
📌 Current Price: ~₹327
📌 Structure: Higher Highs & Higher Lows
📌 Volume: Strong accumulation visible
📌 Trend: Strong uptrend above long-term trendline & EMAs
Key Levels
Immediate Resistances ₹360
₹425 (Major long-term level)
Supports
₹300 – breakout retest zone
₹260 (major swing support)
As long as price stays above ₹300, bulls remain in control 🐂🔥
Technical Highlights
✅ 4-year consolidation breakout
✅ Major downtrend line broken
✅ Strong volume confirmation
✅ Clean price action + trend continuation
View
Bias remains bullish as long as price holds above the breakout zone.
Breakout + retest setups may offer opportunities in trending markets.
Not investment advice — for educational chart analysis only. Always do your own research.

Rbl bank Grey line nifty50 index vs rbl bank price
When index fall , this stock stay in range absorp selling pressure well
How smooth stock now moving
Just look interesting chart

RBL Bank on the Verge: Weekly Chart Signals a Fresh Trend BreakRBL Bank has shown strong bullish momentum in its weekly chart, supported by rising price, strong moving averages, and a robust uptrend. The stock is currently trading near its 52-week high at around ₹326, indicating significant strength in the ongoing trend.
Technical Indicator Analysis
• Price and Trend: The stock has risen over 42% in the past year and over 7% in the last month, supported by strong volume and positive sentiment.
• Moving Averages: The 50-week and 200-week moving averages are sloping upwards, and the price is trading well above both, which is a bullish sign.
• Relative Strength: RSI (implied by the breakout and new highs) likely remains in bullish territory, confirming momentum.
• Support and Resistance: The stock has immediate support near ₹300 and strong resistance is seen at the recent high of ₹331.50.
Chart Pattern and Target
• Pattern Observed: A continuation breakout, possibly following a flag or rounding bottom pattern, is implied. The price action has broken past key resistances, and the trend remains strong.
• Entry Point: New entries can be considered on minor pullbacks toward ₹310-315, or on a weekly close above ₹331.50 for momentum traders.
• Target: Immediate target is the all-time range toward ₹350 . If momentum continues, longer-term targets could be in the ₹380–400 zone, using previous swing projections and extension from current levels.
• Stop Loss: Suggested stop-loss for positional trades is below ₹296 on a closing basis to protect gains and manage downside risk.
Overall, the weekly technical for RBL Bank support a bullish stance with buy-on-dip and breakout strategies, as long as the price remains above the key moving averages and stop-loss.
📌 Thanks a ton for checking out my idea! Hope it sparked some value for you.
🙏 Follow for more insights
👍 Boost if you found it helpful
✍️ Drop a comment with your thoughts below!
RBLANK: Volume Squeeze Hints at Major BreakoutIdea Summary: Daily Time frame
RBLANK formed a massive 'Mother Candle' on Oct 20, 2025, then consolidated inside its range for 7 days. Volume has been declining during this compression, creating a classic volatility squeeze. The stage is set for a high-probability breakout.
Trade Setup (Bullish Breakout):
Trigger: Daily close above 328.85
Confirmation: Surge in volume (must exceed 20-period average)
Target 1: 340
Target 2: 380
Target 3: 400
Stop Loss: 302 (trail stops after T1)
The Rationale:
The mother candle showed institutional interest. The 7-day consolidation with declining volume indicates exhaustion of sellers. Any breakout with significant volume expansion confirms fresh buying momentum, suggesting a sustained move.
Volume Logic: Declining volume during consolidation + volume expansion on breakout = high-probability trade. Without volume confirmation, the breakout lacks conviction.
Risk: Position size according to the 302-329 risk range. False breakouts possible without volume confirmation.
Disclaimer: Educational purpose only. Trade at your own risk.

RBLBANK ( M ) BREAKOUTStock Name : RBL BANK ( M )
Friends, after a long time, this stock has broken out in the monthly time frame after about five years and eight months. This type of breakout is considered very strong and there are only two days left for the completion of this month's candle. So we can consider this as a complete breakout. If you look at the range of the breakout, it was Rs 180. Then you can add the stock to your watch list.
Target 1 : 396 - 400
Target 2 : 475 - 500
Note: Our posts are posted for learning purposes. You will be responsible for any profit or loss you make from the advice given in the channel. Before investing in the stock market, you must consult your financial advisor.
WE ARE NOT A SEBI REGISTERED

Inv Head and Shoulder in RBLbankVery large inv head and shoulder is seen on monthly chart.
SL and targets are in chart.
Considering large SL it is better to add this stock on every fall.
Targets of monthly charts can take longer time ie 8-12 months.

RBL: Is set for a smooth upmove?⚡️Price Analysis:
1️⃣ Price broke the resistance.
2️⃣ Price structure is bullish.
3️⃣ Price trading above EMAs
4️⃣ Overall there is good volume & strength
✨ Key Observations:
➡️ RRR favourable at CMP.
➡️ Price should continue the upside momentum.
➡️ Overall banking sector is strong.
⚠️ Disclaimer: This is NOT a buy/sell recommendation. This post is meant for learning purposes only. Views are personal. Please, do your due diligence before investing.⚠️
💬 Share your thoughts in the comments below! ✌️
🔥Trade Safe!✅🚀
ASCENDING TRIANGLE BREAKOUT IN RBL BANK-EDUCATIONAL PURPOSEBreakout seen on weekly chart after 5 years of consolidation
Long position can be initiated on little correction till 300 levels with the investment horizon of around 5 years
Target : 660 (121%)
Stoploss : Weekly closing below 242 (-21%)(recent swing low)
Risk Reward Ratio = 1:6
Investment horizon : 55-60 months (till October 2030)
Only for investment -- Not for short term trading

RBLBANK | Stock is getting re-rated - Looks good for doublingRBLBANK | Stock is getting re-rated - Looks good for doubling
CMP : 325

RBL BANK READY FOR A SMOOTH RUNThe stock has been forming an cup and handle pattern on the weekly chart and this pattern is in process since 2021 that's a 4 year consolidation, now the stock has entered into it's ending phases.
The stock can give a good rally and give more than 70% returns from a long term point of view.
The FIIs and DIIs have been piling up this stock lately 3% and 14% respectively showing further reliability.

#RBLBANK - VCP BreakOut in Daily Time FrameScript: RBLBANK
Key highlights: 💡⚡
📈 VCP BreakOut in Daily Time Frame
📈 Volume spike during Breakout
📈 Large Base BreakOut – Zoom Out
📈 Private Bank Sector showing strength
📈 Can go for a swing trade
BUY ONLY ABOVE 288 DCB
⏱️ C.M.P 📑💰- 286.90
🟢 Target 🎯🏆 – 12%
⚠️ Stoploss ☠️🚫 – 6%
⚠️ Important: Market conditions are Bad, Position size 25% per Trade. Protect Capital Always
⚠️ Important: Always Exit the trade before any Event.
⚠️ Important: Always maintain your Risk:Reward Ratio as 1:2, with this RR, you only need a 33% win rate to Breakeven.
✅Like and follow to never miss a new idea!✅
Disclaimer: I am not SEBI Registered Advisor. My posts are purely for training and educational purposes.
Eat🍜 Sleep😴 TradingView📈 Repeat 🔁
Happy learning with MMT. Cheers!🥂