REC LTD LONGWe have seen volume spurt in hourly candle of 28-11-22. Stock is showing increasing trend since couple of weeks. As per the Elliot wave analysis stock can go up to 132 in next month itself. Stock is having PE ratio of 2.82 and PB Ratio of 0.58 only. Company is Maharatna status in PSU unit.
RECLTD trade ideas


REC Ltd: Solid Breakout with huge volumesREC Ltd: Solid Breakout with huge volumes
Buy above 110
Targets 112/113.25/114.7
Almost 3-4% returns
SL as per risk management
Disclaimer: Im not SEBI registered, Contact your financial advisor before any investment.

Keep eye on this RECLTD #RECLTD ... ✅
INTRADAY & Short term delivery call as we’ll
All levels given in charts ...
IF good potential seen then we work in options also
if activate then possible a huge movement Keep eye on this ...
We take trade only when it activates...

REC LTD | MAKE OR BREAK ?> REC LTD
> Keep in your radar
> Trading Near resistance level
> Last candle is good bullish candle

REC - DAY CHART - 31.10.22 - DIVIDEND - BAHAVAN CAPITALREC Chart posted on 27.10.22 being dividend declared the stock will move up and lets see whether it can break 104.
Happy Profitable Trading to all..

REC - DAY CHART - 27.10.22 - DIVIDEND - BAHAVAN CAPITALREC Ltd board has approved and declared an interim dividend of 5 per share for the financial year 2022-23
and the record date for the said interim dividend is Wednesday, November 9, 2022
and the said interim dividend shall be paid/ dispatched on Thursday, November 24, 2022.
This stock is expected to move up.
Happy Profitable Trading to All

Watching buying opportunity in RECLTD in intraday for today.At daily candle RECLTD has come to a demand i.e. previous swing for the first time and broke falling wedge pattern upside, so we can see a bullish moment from this point as it is protecting previous low, it could go for higher high now. it is good for intraday trading for today. NSE:RECLTD

Resistance BrokenREC Ltd broken a resistance of nearly 8 months and close above 107. I am picking this stock for both investment as well as short term trade. Reasons for picking this trade are :
1. Broken a trendline resistance
2. Good amount of OI added.
3. maintaining consistent numbers in Quarterly results.
4. Giving a rich dividend yield consistently.
This trade is for educational purpose

REC LTD - BULLISH ENGULFING 📊 Script: RECLTD (REC LIMITED)
📊 Nifty50 Stock: NO
📊 Sectoral Index: NIFTY FINANCIAL SERVICES / NIFTY MIDCAP 50
📊 Sector: Financial Services
📊 Industry: Finance Institution
Key highlights: 💡⚡
📈 Script is trading towards upper band of Bollinger band (BB).
📈 Already crossover in MACD .
📈 Already Crossover in Double Moving Averages.
📈 Double candlestick pattern BULLISH ENGULFING seen which indicate Bullishness in stock.
📈 Right now RSI is around 70.
📈 One can go for Swing Trade.
⏱️ C.M.P 📑💰- 105.45
🟢 Target 🎯🏆 - 114/117
⚠️ Stoploss ☠️🚫 - 100
⚠️ Important: Always maintain your Risk & Reward Ratio.
✅Like and follow to never miss a new idea!✅
Disclaimer: I am not SEBI Registered Advisor. My posts are purely for training and educational purposes.
Eat🍜 Sleep😴 TradingView📈 Repeat🔁
Happy learning with trading. Cheers!🥂

REC LTD - 1D TIMEFRAMECHECKOUT….!
REC LTD - Market Direction - Trend - Now market takes the resistance - expecting retracement upto 98 to 96 - And further directions in the chart
Check and Do Trade Carefully

REC Ltd (RECM) TARGET 106 120 128REC Ltd (RECM) TARGET 106 120 128
Hi REC Ltd (RECM) day chart. Fibonacci Retracement Levels crossed 50% so strong upside.
increase in volume and price with momentum yesterday. open interest increased to 40.82%
stock split today 18th Aug. so time to accumulate to long. good dividend stock.

REC LTDCurrent trend Analysis with trendlines for Daily Weekly Monthly charts
H & S Pattern about to complete

REC LTD chart analysis for swing tradeREC LTD chart analysis for swing trade (15 min)
Entry & exits are given on chart.
only for learning, trade at your own risk.

Rec - buyBuy from cmp to 120.85
easy tg - 123.5
tg2 - 125.5
Disclaimer : This is my personal analysis for study purpose not intended for trading

REC-Medium Term , Bulls gaining momentum againREC-Medium Term , Bulls gaining momentum again, potential up move towards 144. Any pull back to accumulation zone can be bought in.

REC ANALYSISTRADE OR INVEST wisely.
WE CAN JUST PREDICT.
Disclaimer: I am not a SEBI registered advisor , so before entering on my view plz ask your SEBI Registered Advisor . Profit is your and loss is your.
PLEASE LIKE AND SHARE IF YOU AGREE WITH THE IDEA

REC Ltd looking bullishREC Ltd broken 100 EMA and trendline and all the levels on upside. We can see a great up move soon.

RECLTD
NSE:RECLTD
One Can Go long with a Strict SL below the Trendline or Swing Low of Daily Candle.
Close should be good, and Clean.
R:R ratio is 1 :2 .
Disclaimer : You are responsible for your Profits and loss, Shared for Educational purpose

RECLTD Breakout - Swing TradeRECLTD looks strong on Daily and Weekly chart with Breakout strong closing above the TL. RR is 1:2 for swing traders.

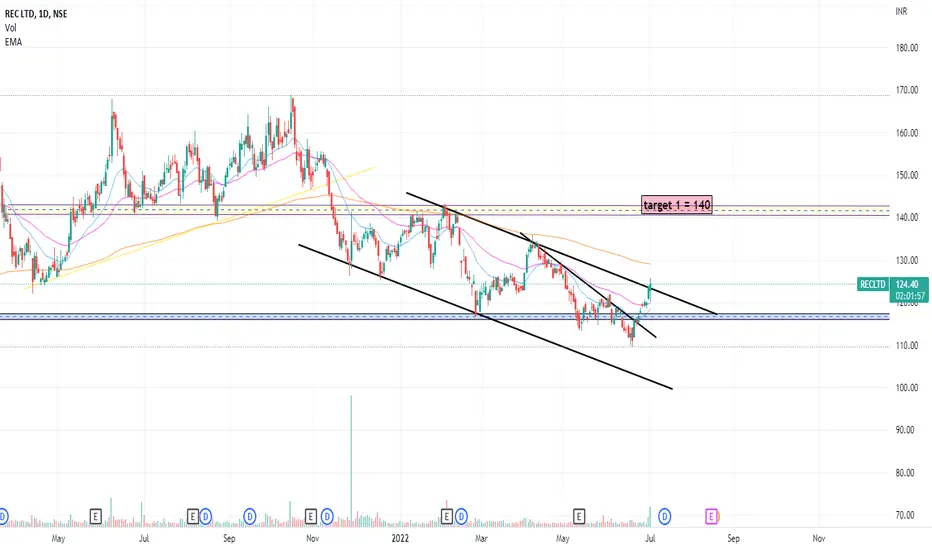
channel pattern Breakout stockNSE:RECLTD
let see the price action =stock break the channel pattern + good volume
1 target = 140
fix you stop lose as per you R:R ratio.
let tell you opinion in comment
REC LTDRESISTANCE BREAKOUT :
1) The stock has broken a resistance with strong volume.
2) Looks good for the targets of 127, 133 & 140
3) Break out candle low can be kept As SL

Positional or Longterm Opportunity in RECGo Long above 118.8 for Targets of 127.95, 137.1, 146.25, and 155.4 with SL 109.65
Reasons to go Long :
1. On a Weekly timeframe if we draw the Fibonacci retracement tool from the recent swing low (point A) to the recent swing high (point B) then we see stock took support from the 0.618 Fibonacci level.
2. Also a bullish candlestick pattern Bullish Engulfing (marked with orange color) is formed around 0.618 Fibonacci level.
3. In addition to this there is a strong demand zone (marked with purple color), from which the stock initially faced resistance but now is taking support and moving up.
