Redington swing trade and upcoming result Redington swing trade and upcoming result target 280,next target 300,T3-330rs,
Redington Limited
No trades
Next report date
—
Report period
—
EPS estimate
—
Revenue estimate
—
22.55 INR
16.05 B INR
993.34 B INR
593.18 M
About Redington Limited
Sector
Industry
CEO
Vishnampet Sethu Hariharan
Website
Headquarters
Chennai
Founded
1961
IPO date
Feb 19, 2007
Identifiers
2
ISIN INE891D01026
Redington Ltd. provision of machinery, equipment and supplies. It includes computers, computer peripheral equipment, software, electronic, and telecommunications equipment and parts. It operates through the India, and Overseas segments. The company was founded by Ramanathan Srinivasan on May 2, 1961 and is headquartered in Chennai, India.
Related stocks

REDINGTON 1 Week Time Frame 📌 Weekly Pivot‑Based Levels (from Moneycontrol weekly pivots)
(These are derived from weekly price action, giving support & resistance zones used by chart traders)
Resistance (Weekly)
R1: ~ ₹282.77
R2: ~ ₹289.23
R3: ~ ₹300.12
Pivot (Weekly Reference):
Pivot Point: ~ ₹271.88
Support (Weekly)
S1: ~

Redington Ltd | Symmetrical Triangle – Breakout AwaitedRedington Ltd is a leading technology distribution and supply chain solutions company, operating across India, the Middle East, Africa, and South Asia. The company specializes in the distribution of IT products, mobility devices, cloud solutions, and emerging technologies, partnering with global bra

Redington TGT-380 , sl-270can see consolidation ,
based on pattern tgt -380
resistance around 300-310
support 260-270
below 260 weak
company upate will see growth in uae, and in upcoming 3 quaters
Disclaimer- Just my view and opinion ,trade at your own risk not an investment advice ,these are only for educational pur

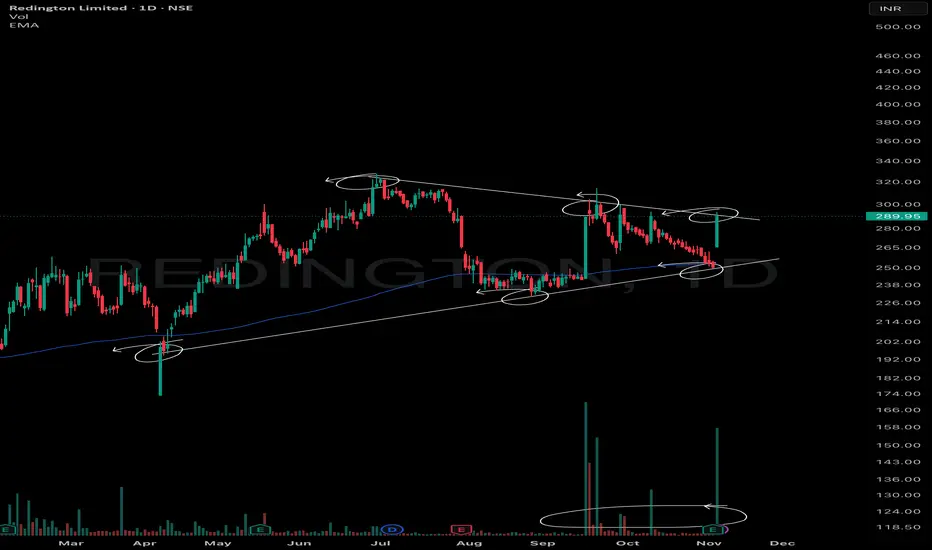
Inverse head and shoulder formed in reddington1. Inverse head and shoulder formation on Support levels showing buyers will take control from here
2. With minimum downside one can watch for long upside movement shown as target zone on charts
3. The strong movement has shown after result which tells us if movement continues then target may com

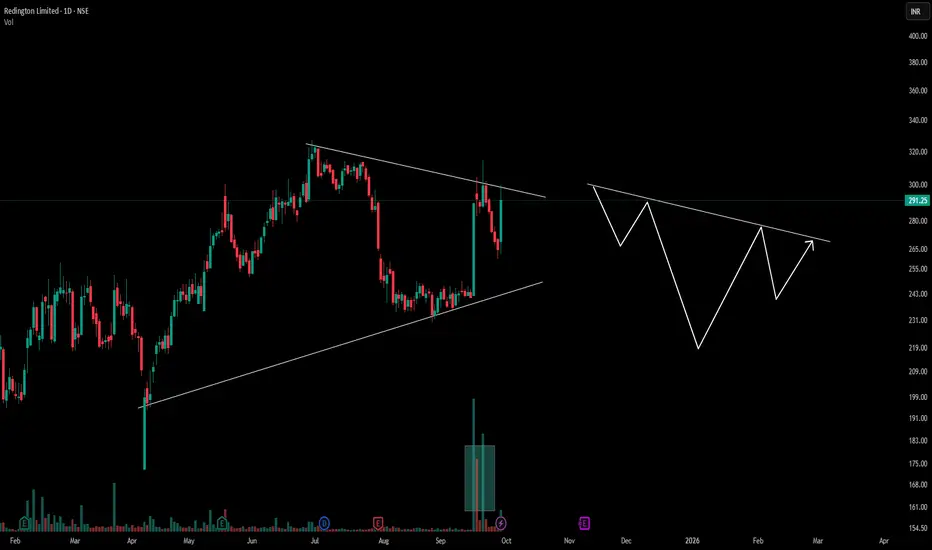
VCP Formation within Symmetrical Triangle above 200 EMAThis chart displays a Volatility Contraction Pattern (VCP) developing within a classic symmetrical triangle on the daily timeframe. Two sharply converging trendlines encapsulate the price action with the lower line connecting a series of higher lows (the trendline) and the upper line linking lower h
Extended Inverted Head & Shoulders Structure in Price ActionThis chart features an extended inverted head and shoulders pattern, illustrating how these classic formations can significantly vary in length and shape across timeframes. The left and right shoulders frame a deeper head, while the neckline is not strictly horizontal but angled, reflecting real mar
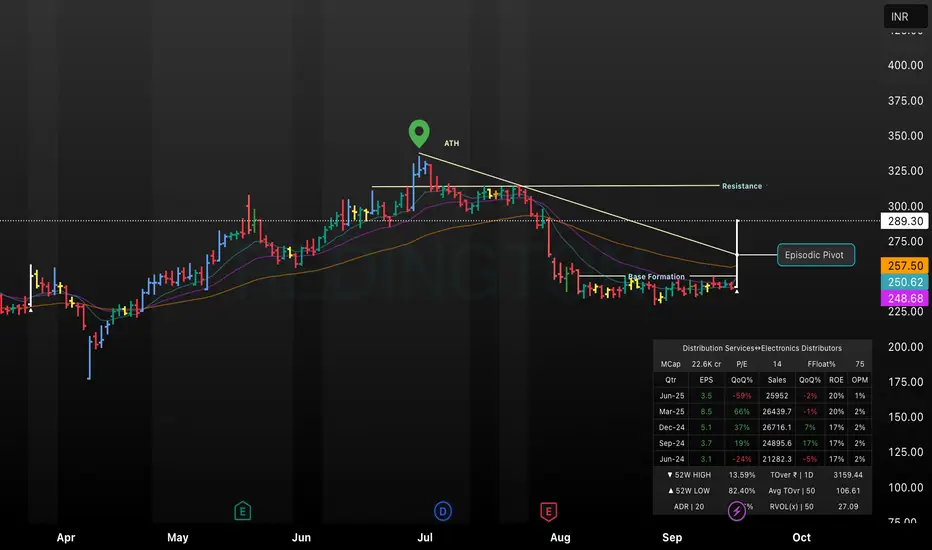
Episodic Pivot in REDINGTON StockThis TradingView chart of REDINGTON illustrates an Episodic Pivot breakout above the resistance zone after a prolonged base formation, marked by a sharp surge in price to ₹289.30 (+19.83%). Key technical indicators and moving averages are shown, alongside annotated zones for resistance, base formati
Stock-wise Investigation: Breakouts or Support? ( MTF )Using 3-month-old chart data, this video explores how stocks tend to favor breakouts or support zones, with key technical terms to sharpen your pattern recognition skills—purely educational in nature.

Looks bullish on coming daysRedington , broken its tight consolidation with good volume and 8.4% move. It looks positive for coming days. Stock could give 10-20% in very short duration.
200% + RVOL shows buyers interest.
Weekly if we see, this stock came out of channel structure and giving good upmove with volume push.
St

See all ideas
Summarizing what the indicators are suggesting.
Neutral
SellBuy
Strong sellStrong buy
Strong sellSellNeutralBuyStrong buy
Neutral
SellBuy
Strong sellStrong buy
Strong sellSellNeutralBuyStrong buy
Neutral
SellBuy
Strong sellStrong buy
Strong sellSellNeutralBuyStrong buy
An aggregate view of professional's ratings.
Neutral
SellBuy
Strong sellStrong buy
Strong sellSellNeutralBuyStrong buy
Neutral
SellBuy
Strong sellStrong buy
Strong sellSellNeutralBuyStrong buy
Neutral
SellBuy
Strong sellStrong buy
Strong sellSellNeutralBuyStrong buy
Displays a symbol's price movements over previous years to identify recurring trends.
SMALLCAP
Mirae Asset Nifty Smallcap 250 Momentum Quality 100 ETF Units Exchange Traded FundWeight
1.93%
Market value
1.63 M
USD
Explore more ETFs
Frequently Asked Questions
The current price of REDINGTON is 256.05 INR — it has decreased by −2.55% in the past 24 hours. Watch Redington Limited stock price performance more closely on the chart.
Depending on the exchange, the stock ticker may vary. For instance, on NSE exchange Redington Limited stocks are traded under the ticker REDINGTON.
REDINGTON stock has fallen by −6.38% compared to the previous week, the month change is a −6.38% fall, over the last year Redington Limited has showed a 3.66% increase.
We've gathered analysts' opinions on Redington Limited future price: according to them, REDINGTON price has a max estimate of 300.00 INR and a min estimate of 300.00 INR. Watch REDINGTON chart and read a more detailed Redington Limited stock forecast: see what analysts think of Redington Limited and suggest that you do with its stocks.
REDINGTON reached its all-time high on Jun 30, 2025 with the price of 334.80 INR, and its all-time low was 7.95 INR and was reached on Feb 26, 2009. View more price dynamics on REDINGTON chart.
See other stocks reaching their highest and lowest prices.
See other stocks reaching their highest and lowest prices.
REDINGTON stock is 3.04% volatile and has beta coefficient of 2.18. Track Redington Limited stock price on the chart and check out the list of the most volatile stocks — is Redington Limited there?
Today Redington Limited has the market capitalization of 205.68 B, it has decreased by −1.75% over the last week.
Yes, you can track Redington Limited financials in yearly and quarterly reports right on TradingView.
Redington Limited is going to release the next earnings report on May 14, 2026. Keep track of upcoming events with our Earnings Calendar.
REDINGTON earnings for the last quarter are 5.60 INR per share, whereas the estimation was 5.60 INR resulting in a 0.00% surprise. The estimated earnings for the next quarter are 5.60 INR per share. See more details about Redington Limited earnings.
Redington Limited revenue for the last quarter amounts to 309.22 B INR, despite the estimated figure of 305.63 B INR. In the next quarter, revenue is expected to reach 311.11 B INR.
REDINGTON net income for the last quarter is 4.36 B INR, while the quarter before that showed 3.88 B INR of net income which accounts for 12.37% change. Track more Redington Limited financial stats to get the full picture.
Yes, REDINGTON dividends are paid annually. The last dividend per share was 6.80 INR. As of today, Dividend Yield (TTM)% is 2.58%. Tracking Redington Limited dividends might help you take more informed decisions.
Redington Limited dividend yield was 2.80% in 2024, and payout ratio reached 33.13%. The year before the numbers were 2.98% and 39.77% correspondingly. See high-dividend stocks and find more opportunities for your portfolio.
As of Feb 16, 2026, the company has 12.79 K employees. See our rating of the largest employees — is Redington Limited on this list?
EBITDA measures a company's operating performance, its growth signifies an improvement in the efficiency of a company. Redington Limited EBITDA is 22.46 B INR, and current EBITDA margin is 2.30%. See more stats in Redington Limited financial statements.
Like other stocks, REDINGTON shares are traded on stock exchanges, e.g. Nasdaq, Nyse, Euronext, and the easiest way to buy them is through an online stock broker. To do this, you need to open an account and follow a broker's procedures, then start trading. You can trade Redington Limited stock right from TradingView charts — choose your broker and connect to your account.
Investing in stocks requires a comprehensive research: you should carefully study all the available data, e.g. company's financials, related news, and its technical analysis. So Redington Limited technincal analysis shows the strong sell today, and its 1 week rating is sell. Since market conditions are prone to changes, it's worth looking a bit further into the future — according to the 1 month rating Redington Limited stock shows the buy signal. See more of Redington Limited technicals for a more comprehensive analysis.
If you're still not sure, try looking for inspiration in our curated watchlists.
If you're still not sure, try looking for inspiration in our curated watchlists.