REDINGTON trade ideas

REDINGTON INDIA CHARTSSELF EXPLANATORY CHARTS
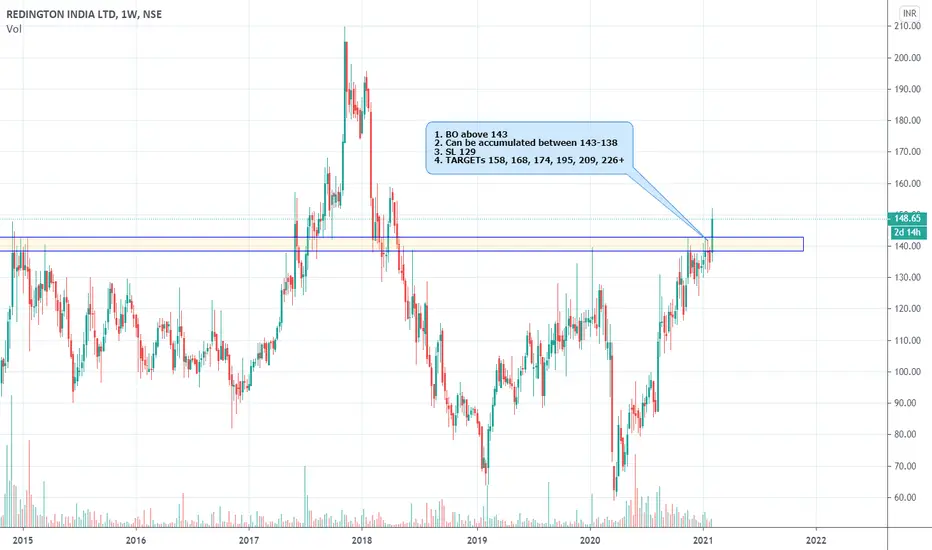
MEDIUM TERM PICK 1-3 MONTHS..
BIG BREAKOUT
SHOULD DO WELL


Redington - waiting for retestingRedington
breakout done last week.
now waiting for fresh buying again at breakout levels during retesting.
looking good for swing trading as well as stock is moving above all major EMAs.
keep in your stock watchlist.


Redington- Ascending TriangleWELENT- daily chart trading in ascending channel pattern and currently stock trading near lower support level and now stock has bounce from support with strong volume and bullish marubozu pattern, now stock can move towards 96.00/104.00 levels in coming days with the help of 78.00 level.

Stock Near Breakout Level*This stock made a continuation inverted H & S and traded near its neck line after breakout breakout we will initiate trade .

REDINGTON CAN GIVE GOOD MOMENTUM ABOVE 135 It Formed Double Bottom & 3 Yr Old Trend line Breakout !!
Possible Target : 150
(HOLD ABOVE 135)
Feel Free To Ask For Any Technical/Fundamental Query
Comment Down Below
Educational Purpose Only.

REDINGTONBUY-131
SL-123
T-142/150
MAKING HIGHER HIGH & HIGHER LOWS.
CHANNEL FOLLOW WAIT FOR THE BEST BUY LEVELS..
POSITIONAL TRADE

#REDINGTONINDIA coming near breakout levelStock price staying around resistance level. Can make breakout in few sessions.

#REDINGTON looks good for breakoutPrice is trading at resistance level. Looks ready to enter into new price zone.

REDINGTON3 Inside Bar and reduction in volatility by 57% compare to 1st weekly bar in 3 bars. It can be above 137 level with SL of 128.

Redington India Ltd. ... Getting Ready for a Good Ride !!#optionsmagician #prathaminvestments
#redington
Redington India ltd. is Trying to Breakout from a falling trendline, a close above Trendline on Monthly Closing basis will be a Breakout and Longs can be initiated once the Stocks Shows retrracement to Retest the Trendline. buy and Hold as Per Levels given on Chart !!

Redington formed a MORNING STAR PATTER with GOOD VOLUME Redington formed a MORNING STAR PATTER with GOOD VOLUME it will be a good buy.


Buy Long for Redington India LTD Buy Long for Redington India ltd from the current price to the target of Rs 141 , as there is an upwards rising channel and there is clear cut break out of inverse head and shoulder pattern including the break out of the inverse right shoulder . Also as per fibonacci retracement the target it is showing is upto Rs 141 . on a daliy Chart pattern.
The Above analysis is done on the daily chart pattern .

In consolidationThe bearish trend may take it to a level of 109 where there is the last support which may hold.

Short/Mid Investment Pick: 40% to 80% in 3-6 monthsShort/Mid Investment Pick: 40% to 80% in 3-6 months. This script looks great on technical as well as fundamental analysis. Price making HHLL and moving in ascending triangle pattern. Shortly can see a breakout. Entry could be around or above 118-120. SL up to 105-100 and we can see 150/200+ on cards. Great intrinsic value, FII's invested, PE 8.74 vs 20.21 PE of sector. Revenue and Profit increasing YOY. "I AM NOT SEBI REGISTER, INVEST AFTER CONSULTING WITH FINANCIAL ADVISER. Views are solely personal and for educational purpose.


