REFEX 1 Week Time Frame 📌 Current Key Price (Approx)
Live share price around ₹239 – ₹250 on NSE/BSE.
📊 Weekly Technical Levels (Support / Resistance)
🔹 Weekly Support
S3: ~₹205 – ₹217 zone (lower weekly structural support)
S2: ~₹221 – ₹229 range (important near-term weekly support)
S1: ~₹224 – ₹230 (immediate weekly support)
🔸 Weekly Pivot
Pivot Zone: ~₹228 – ₹239 mid-range level — acts as a decision point between bullish and bearish bias in the weekly timeframe.
🔸 Weekly Resistance
R1: ~₹232 – ₹239 (first weekly resistance)
R2: ~₹241 – ₹246 (next hurdle)
R3: ~₹245 – ₹250+ (stronger weekly barrier)
📈 Weekly Chart Bias Interpretation
✔️ Above pivot (~₹228–₹239)
→ Slightly bullish to neutral weekly structure with room to test R2/R3.
❌ Below pivot / failing R1 (~₹232)
→ Bearish pressure could push toward S1/S2 levels.
📌 Weekly indicators (from broader technical sites) suggest current bias is neutral to bearish on weekly timeframe rather than strongly bullish.
🧠 Quick Weekly Snapshot
Support cluster: ~₹217 – ₹229
Key pivot area: ~₹228 – ₹239
Resistance cluster: ~₹241 – ₹250+
Trades tend to respect weekly pivots and S/R levels for reversal or breakout cues. Monitor weekly close above/below pivot zones for the next directional bias. Always combine with volume and momentum indicators for confirmation.
Refex Industries Limited
No trades
What traders are saying

refer industriesimmediate support at 228, most probably will bounce from on here, if not look for entry below it anywhere from 203 to 228, long targets of 300+

A DIRTY SCAM - DECODED BY GOOGLE GEMINI AIThe connection between Refex Industries and Gensol Engineering is not just a random business deal; it traces back to a tight-knit relationship between their promoters and a failed attempt to "bail out" Gensol from its mounting debt crisis.
The "smoking gun" is a specific transaction in early 2025 that was announced and then abruptly cancelled when regulatory heat increased.
The "Rescue Act" Chronology
1. The Personal Link (The Foundation)
The Players: Anmol Singh Jaggi (Promoter of Gensol & BluSmart) and Anil Jain (MD of Refex Industries).
The Connection: Anil Jain was an early angel investor in BluSmart, the ride-hailing app founded by the Jaggi brothers.
The Business: Refex Industries (via its subsidiary Refex Green Mobility) was already a vendor to BluSmart, leasing over 1,000 electric cars to them. This created a symbiotic relationship: Gensol made the cars (allegedly), and Refex leased them to the Jaggi brothers' other company, BluSmart.
2. The "Bailout" Attempt (January 16, 2025)
The Crisis: By late 2024, Gensol was drowning in debt and facing questions about "missing" EV assets. They needed to get debt off their books fast.
The Deal: Gensol announced it would sell 2,997 EVs to Refex Green Mobility.
The Catch: Refex wouldn't just pay cash; they agreed to take over ₹315 Crore of Gensol's loan liabilities.
The Optic: This would have instantly cleaned up Gensol's balance sheet, making it look debt-light to investors. Gensol stock jumped 7% on this news.
3. The Cancellation & SEBI Probe (March 28, 2025)
The Trigger: SEBI’s investigation deepened. The regulator found that Gensol had taken loans for 6,400 cars but only physically bought ~4,704. The "missing" cars were a major red flag.
The U-Turn: On March 28, just days before the SEBI interim order, Refex and Gensol "mutually cancelled" the deal.
The Result: Refex walked away safe. Gensol was left holding the toxic debt and the "ghost" assets. Gensol stock crashed 5% immediately.
The Verdict: Is Refex "Dirty"?
While Gensol is the primary offender (accused of fraud/diversion), Refex’s role raises valid concerns about Capital Allocation.
The "Friendly" Risk: Refex management was willing to take on ₹300Cr+ of debt from a related party (where their MD is an investor) just to help them out. This is a classic "Corporate Governance" yellow flag—using public company money to help a friend’s distressed company.
The Saver: To their credit, Refex did back out before the deal closed, protecting their shareholders from the actual loss. This suggests they have a "kill switch" when risks get too high, unlike Gensol.
Actionable Insight for You
Gensol: Uninvestable. The "missing cars" and SEBI ban on promoters are fatal flaws.
Refex: Watch with Caution. They are not "fraudulent" like Gensol, but their willingness to entertain such a risky deal suggests their Board might be too cozy with the Jaggi ecosystem. If you own Refex, monitor their Related Party Transactions closely in the next quarterly report.
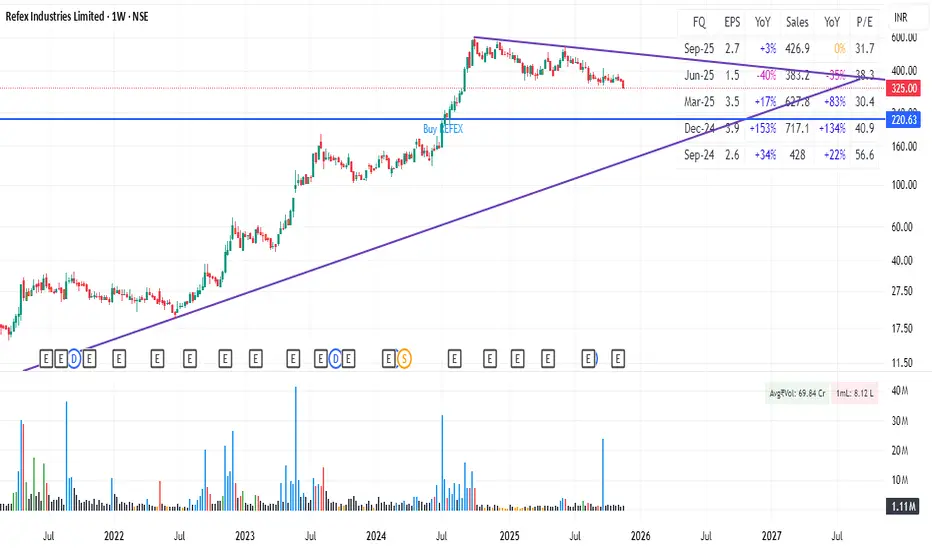
REFEXParamaters : 1. Ichimoku support 2. RSI near below 50 (oversold) 3. Price correct from all time high almost 43% 4. Double bottom support Stoploss : 291(20%) Target : 1] 535(46%) 2] 730(100%) 3] 940 (157%)
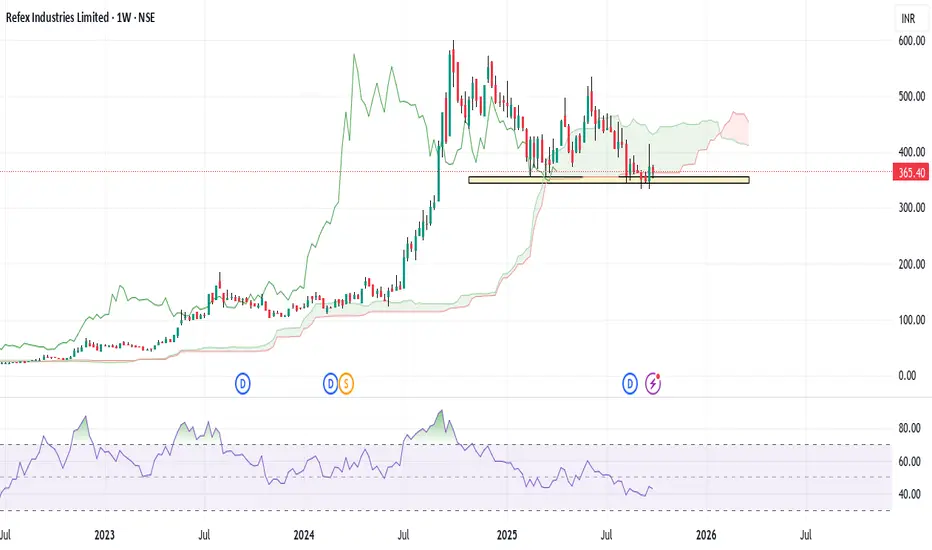
Refex Price ActionAs of July 31, 2025, Refex Industries is trading near ₹448, showing strong bullish momentum with recent gains of about 10% in the last day. The stock has held well above key support levels near ₹400–₹430, indicating solid buyer interest. It has a market capitalization close to ₹5,800 crore.
Fundamentally, Refex Industries carries a price-to-earnings ratio around 33 and a price-to-book ratio above 4, which suggests a premium valuation supported by solid profitability—the return on equity stands near 30%. Technically, the stock trades above short- and medium-term moving averages such as the 5-day, 10-day, and 20-day SMAs, with some resistance expected around ₹450–₹465. Breaking above this level could open further upside potential toward ₹480–₹500. Volume trends in recent sessions confirm the strength of the price move, and the relative strength index (RSI) indicates room for further upside before becoming overbought.
In summary, Refex Industries exhibits strong upward price action backed by healthy fundamentals and volume support. Key levels to watch include support near ₹400–₹430 and resistance at ₹450–₹465, with the near-term outlook remaining constructive on sustained momentum.
Refex Industries a good to have in portfolioRefex Industries 439 is in Industrial gas group. The industrial gases market size is forecast to increase by USD 31.1 billion at a CAGR of 5.7% between 2024 and 2029.
Technically, It is on its long term support and signals are showing sign of reversal
Could be considered at around 410-420 zone for a target of 520 .
While its competitor Linde India with ROE 12.42 and ROCE 17.02 trading at 126 PE
Refex industries with 21.98 ROE and 25.28 ROCE is trading at 29.9 PE
Whereas the industrial PE is at 64.39.
FII's have increased their stake from 1.76 to 2.0 and MF's from 0.0 to 0.11
With above facts we come to a conclusion that Refex Industries is good to have in portfolio.
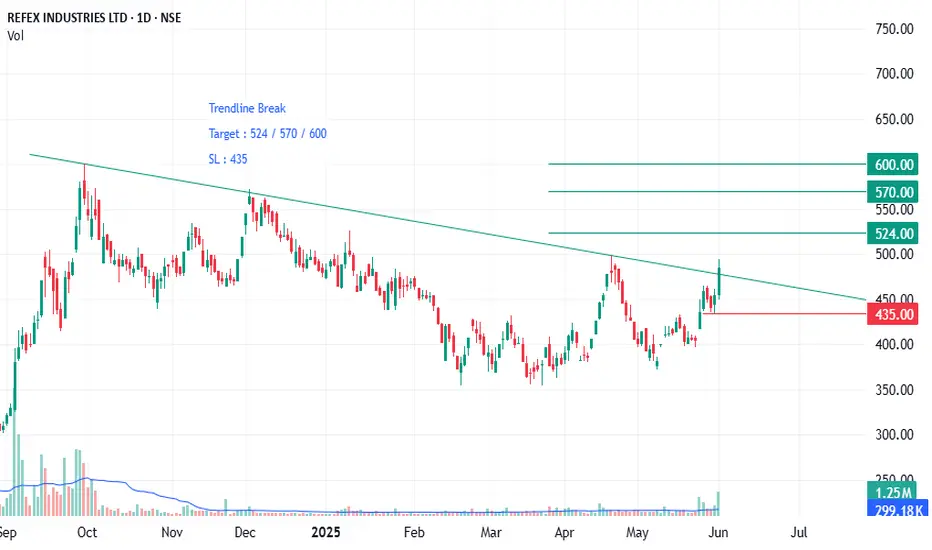
Refex Industries Ltd – Weekly Breakout Trade Setup📈 Refex Industries Ltd – Weekly Breakout Trade Setup
Chart Structure:
Refex has broken out of a long-term descending trendline on the weekly chart with strong bullish momentum. This move marks a potential trend reversal after months of consolidation and lower highs.
🔍 Technical Breakdown:
Trendline Breakout:
Price has convincingly closed above a multi-month descending trendline, indicating a potential shift in trend structure.
Volume Confirmation:
(Add volume insight if available) Ideally, a breakout accompanied by rising volume adds confidence in the move.
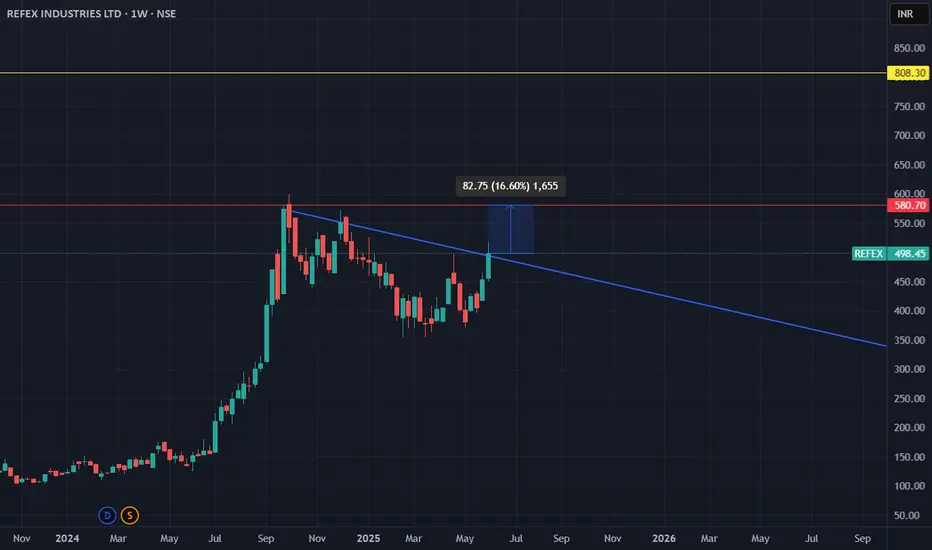
Resistance Levels:
Immediate resistance at ₹580.70 (marked by previous weekly top).
Next major target zone: ₹811.15 (historical high or measured move level).
Breakout Candle Stats:
Move: +82.75 pts from breakout (Approx. 16.6% upside)
Breakout level: Around ₹415–₹420
Current price: ₹498.45
🎯 Trade Plan:
Entry: On confirmed weekly close above ₹450 (already done)
Target 1: ₹580
Target 2: ₹810
Stop Loss: Weekly close below ₹410 (back inside the trendline)
📌 Trade Logic:
This setup is a classic descending trendline breakout following a prolonged consolidation. Once such major resistance is broken, momentum traders and swing traders often step in, driving the price toward the next resistance zones. The structure also hints at a rounded bottom formation, suggesting accumulation.
⚠️ Risk Note:
Watch for possible rejection near ₹580.
Avoid chasing if price moves too far too fast without pullback.
📅 Time Horizon: Medium term (4–12 weeks)
💡 Bias: Bullish until ₹410 is breached on a closing basis.
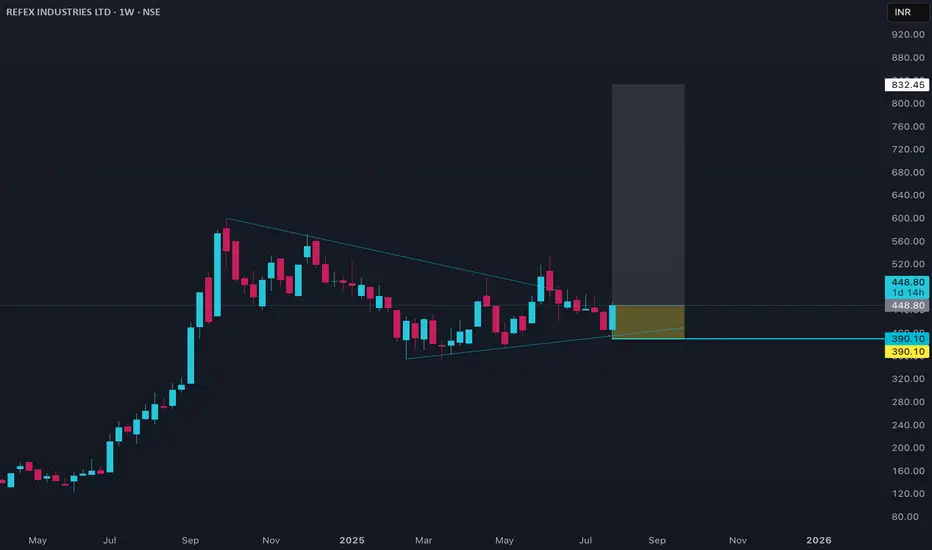
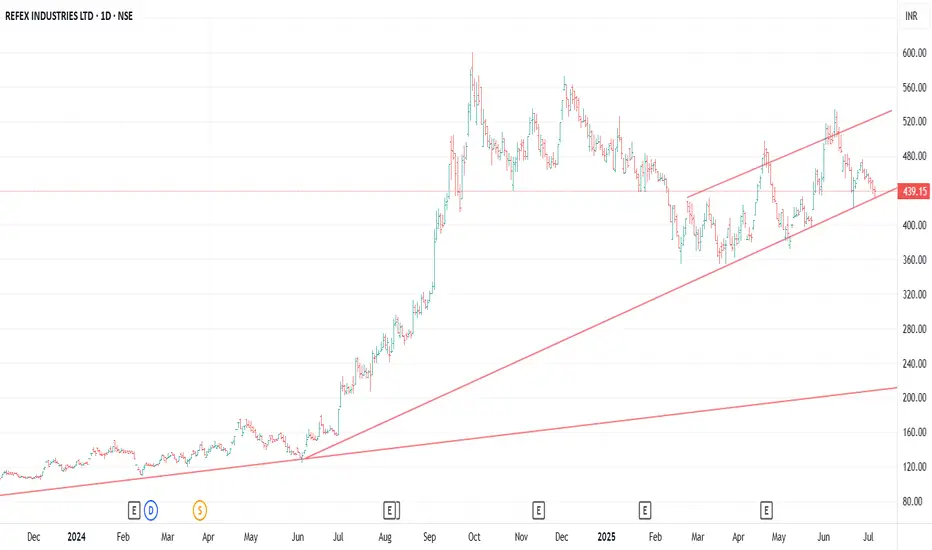
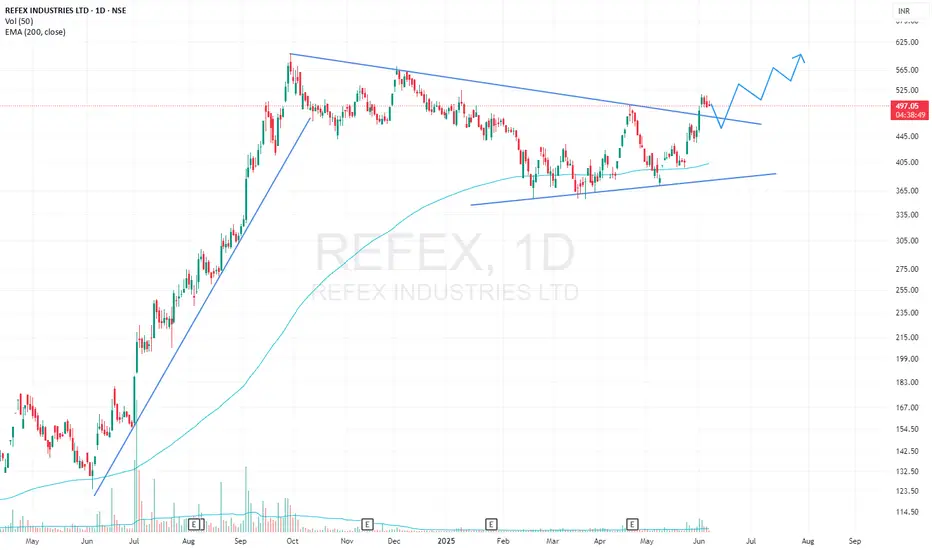
REFEX Triangle & Bull Flag BreakoutREFEX has given a breakout from Symmetrical Triangle and Bull Flag pattern on 1D timeframe with high volumes. Stock has also bounced several times from 200 EMA. Long Position can be initiated with proper risk management.
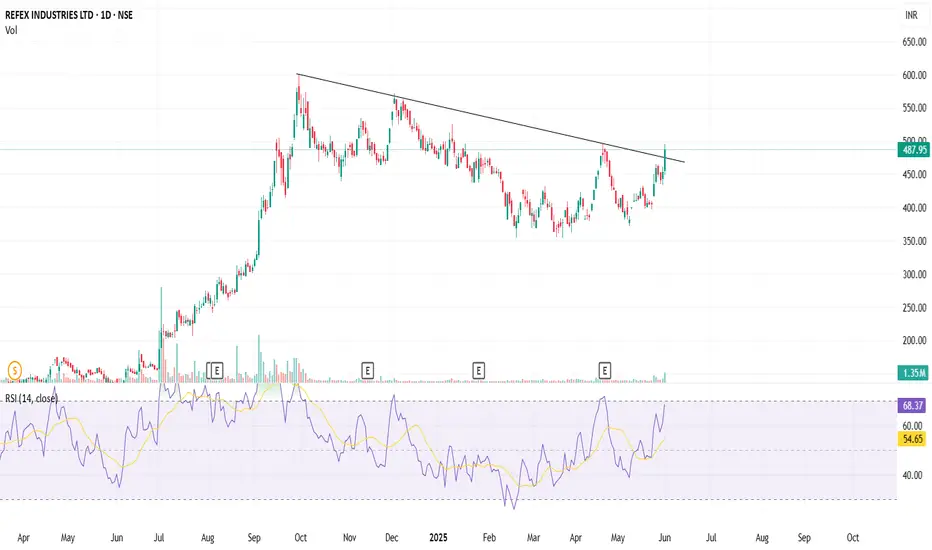
Refex Industries - Breakout Alert!Technical Highlights:
Breakout Alert: Price has broken above the descending trendline that held for ~9 months.
Volume Confirmation: Breakout is supported by a noticeable spike in volume (~1.35M).
RSI (14): Currently at 68.37
Price Action: Bullish candle close above resistance zone near ₹480-485.
Momentum: RSI has been making higher lows since March, aligning with price strength.
REFEX INDUSTRIESRefex industries is making a harmonic pattern, its setting up well fr 5% upmove and sustaining tht can make it touch 580. A potential trade fr going long.

Medium term opportunity in Refex Industries for V.good upsideHi,
NSE:REFEX has given a Bullish Flag Breakout on Weekly charts with very good volume.
MACD is also on the bullish side on Weekly time frames. RSI is also on the bullish side on daily, weekly and monthly time frames.
In the current market scenario, I am expecting that the bullish momentum will continue.
Complete price projection like entry, stop loss and targets mentioned on the charts for educational purpose.
Don't Forget to Follow me to get all the updates.
Please share your feedback or any queries on the study.
Disclaimer: Please consult your financial advisor before making any investment decision.

REFEX INDUSTRIES... BREAKOUTRefex industries- A top-performing small-cap stock in the commodity chemical sector.
PE ratio: 13.9; ROE & ROCE > 40.
A pennant pattern breakout can be seen in the day chart. The stock price has also taken support at the 200ema.
A follow-up green candle will confirm the uptrend.
One can buy and hold the stock after confirming the breakout. My stop loss will be below the 200ema.

Hidden Bullish Divergence ChapterRefex is a good case study for Hidden Bullish Divergence. Big Base, Higher Lows formation, Increasing average volume what is there not to like? Shaky Market Conditions.

REFEX Trade Set up1. Trend bullish
2. Price trading at support
3. SL wait for 2 weeks closing below the 507 levels
4. RR lucrative from 1:8 to 1:22+


REFEX CLEARLY REFLECTING ITS POTENTIAL!$REFEX.NSE Analysis:
1/ Previous Performance: Suggested at 105 (split adjusted), hit 170+ (880+ pre-split), achieving almost all targets with a 65% profit.
2/ Current Status: CMP 135, support at 120.
3/ Downside Risk: Below 120, targets:
- 110
- 100
- 90
4/ Upside Potential:
- 150
- 170
5/ Cup & Handle Breakout: Above 170 closing, targets:
- 199
- 220
- 250
- CB SL at 160
6/ Fresh View: Reevaluate above 250 closing.


Breakout soon stockCup and Handle Breakout Setup
RSI near 60 and rising
Trading above EMA50
In consolidation about 8 months
Disc: for study, not a recommendation

REFEX at base breakoutlooks good on chart.
formed a longer base.
ready to break-out from base.
bounce backed from 200DMA.
trading above all short term EMA.

Refex Traingle Breakout & Retest This share has given a Triangle Pattern Breakout in 1HR Timeframe after a long consolidation
CMP: 585
Target: 650,700,750+
SL: 510
Chart for Educational Purpose.


REFEXRefex Industries Limited(RIL) is a specialist manufacturer and re-filler of Refrigerant gases in India, particularly, environmentally acceptable gases that are replacements for Chloro-fluoro-carbons (CFC’s). These are used primarily as refrigerants, foam blowing agents and aerosol propellants.
