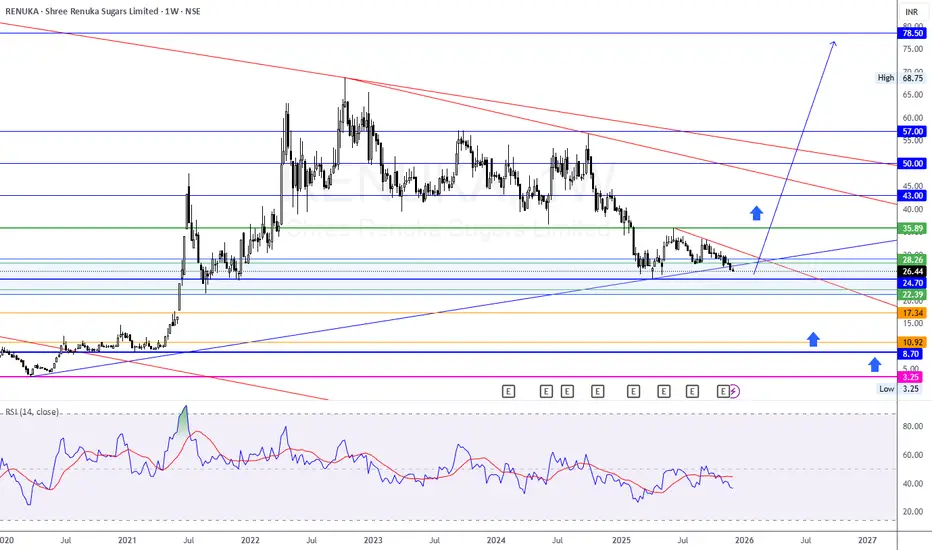
Renuka – Weekly Chart Analysis | High Risk – High Reward SetupPotential Long-Term Reversal Zone | Buy on Big Dips Approach
RENuka has been in a prolonged corrective downtrend since the peak around ₹68–70, but price is now testing a significant multi-year support cluster. The stock is trading near demand levels where strong reversals have occurred historically.
Shree Renuka Sugars Limited
No trades
−3.49 INR
−3.00 B INR
106.02 B INR
623.69 M
About Shree Renuka Sugars Limited
Sector
Industry
Website
Headquarters
Mumbai
Founded
1995
IPO date
Oct 7, 2005
Identifiers
2
ISIN INE087H01022
Shree Renuka Sugars Ltd. is an agribusiness and bioenergy company, which engages in the manufacture of sugar, ethyl alcohol, and ethanol. It is also involved in the generation and sale of energy. The firm operates through the following segments: Sugar-Milling, Sugar-Refinery, Distillery, Co-Generation, Trading, and Other. The company was founded by Narendra Madhusudan Murkumbi on October 25, 1995 and is headquartered in Mumbai, India.
Related stocks
Shree Renuka Sugars Update (07 Sept 2025)CMP: ₹32.13
Recent Action: Huge spike in early Sept on massive volume (12.4M+)
Trend: Fresh momentum after long consolidation.
Moving Averages:
20 EMA: ₹31.00 → acting as immediate support
50 EMA: ₹30.21 → strong base
200 EMA: ₹30.00 → long-term floor
Stock is holding well above all key EMAs

Custom Index - Sugar - Inverted H&SMade custom index with sugar after hitting previous targets now inverted head and shoulder in progress. Holding EID parry. Ethanol blending story plays well.
India hits 20% ethanol blending milestone in early 2025—six years ahead of the original target of 2030

RENUKA SUGAR @33.15 LOOKING GOOD FOR 10% UPMOVE1. Volume rising since many days
2. Good pattern in making
3. Fertilizers moving up so as sugar stocks will also move up
4. Keep in radar for 10% move

SUGAR SECTOR HEATING UP? SUGAR STOCKS TO FLY???RENUKA looks hot above 54
planning to enter at 54-55 range
25% SL since its a monthly breakout
80-100% TP very much possible if market doesn't turn bearish

POSITIONAL TRADE #POSITIONAL TRADE
LOOKING GOOD INVESTMENT PROSPECTIVE HOLDING TIME PERIOD 1 TO 3 MONTHS....
CMP 51
Above 52 TO 54
Facing strong Resistance 48 TO 52 ...
📊NSG TRADER📊


Flag Pattern Breakout In Renuka SugarsFlag Pattern Breakout likely In Renuka Sugars, which is developing from last 2 years on the monthly time frame. with rising volume on the upside.
target-- 95.00
Stoploss --46.00

Shree Renuka Sugars Ltd. (RENUKA)Shree Renuka Sugars Ltd. (RENUKA), the current support and resistance levels are as follows:
Support Levels: ₹44 and ₹4812
Resistance Levels: ₹53, ₹55, and ₹6012
These levels can help you identify potential entry and exit points for your trades

SHREE RENUKA SUGARAll important points are marked.
𝐃𝐢𝐬𝐜𝐥𝐚𝐢𝐦𝐞𝐫: 𝐈𝐧𝐯𝐞𝐬𝐭𝐦𝐞𝐧𝐭 𝐢𝐧 𝐬𝐞𝐜𝐮𝐫𝐢𝐭𝐢𝐞𝐬 𝐦𝐚𝐫𝐤𝐞𝐭 𝐚𝐫𝐞 𝐬𝐮𝐛𝐣𝐞𝐜𝐭 𝐭𝐨 𝐦𝐚𝐫𝐤𝐞𝐭 𝐫𝐢𝐬𝐤𝐬, 𝐫𝐞𝐚𝐝 𝐚𝐥𝐥 𝐭𝐡𝐞 𝐫𝐞𝐥𝐚𝐭𝐞𝐝 𝐝𝐨𝐜𝐮𝐦𝐞𝐧𝐭𝐬 𝐜𝐚𝐫𝐞𝐟𝐮𝐥𝐥𝐲 𝐛𝐞𝐟𝐨𝐫𝐞 𝐢𝐧𝐯𝐞𝐬𝐭𝐢𝐧𝐠. 𝐒𝐭𝐨𝐜𝐤𝐬 𝐬𝐮𝐠𝐠𝐞𝐬𝐭𝐞𝐝 𝐢𝐧 𝐭𝐡𝐢𝐬 𝐠𝐫𝐨𝐮𝐩 𝐚𝐫𝐞 𝐟𝐨𝐫 𝐞𝐝𝐮𝐜𝐚𝐭𝐢𝐨𝐧 𝐩𝐮𝐫𝐩𝐨𝐬𝐞. 𝐖𝐞 𝐝𝐨𝐧𝐭 𝐦𝐚𝐤𝐞 𝐚𝐧𝐲 𝐩𝐫𝐨𝐟𝐢𝐭𝐬 𝐟𝐫𝐨𝐦 𝐭𝐡𝐢𝐬 𝐫𝐞𝐜𝐨𝐦𝐦𝐞𝐧𝐝𝐚𝐭𝐢𝐨𝐧𝐬 𝐞𝐯𝐞𝐫𝐲𝐭𝐡𝐢𝐧𝐠 𝐬𝐡𝐚𝐫𝐞𝐝 𝐡𝐞𝐫𝐞 𝐚𝐫

See all ideas
Summarizing what the indicators are suggesting.
Oscillators
Neutral
SellBuy
Strong sellStrong buy
Strong sellSellNeutralBuyStrong buy
Oscillators
Neutral
SellBuy
Strong sellStrong buy
Strong sellSellNeutralBuyStrong buy
Summary
Neutral
SellBuy
Strong sellStrong buy
Strong sellSellNeutralBuyStrong buy
Summary
Neutral
SellBuy
Strong sellStrong buy
Strong sellSellNeutralBuyStrong buy
Summary
Neutral
SellBuy
Strong sellStrong buy
Strong sellSellNeutralBuyStrong buy
Moving Averages
Neutral
SellBuy
Strong sellStrong buy
Strong sellSellNeutralBuyStrong buy
Moving Averages
Neutral
SellBuy
Strong sellStrong buy
Strong sellSellNeutralBuyStrong buy
Displays a symbol's price movements over previous years to identify recurring trends.
1170SRSL24
Shree Renuka Sugars Limited 11.0% 31-MAR-2032Yield to maturity
—
Maturity date
Mar 31, 2032
945SRSL29
Shree Renuka Sugars Limited 9.45% 04-JAN-2029Yield to maturity
—
Maturity date
Jan 4, 2029
1130SRSL24
Shree Renuka Sugars Limited 11.0% 31-MAR-2032Yield to maturity
—
Maturity date
Mar 31, 2032
See all RENUKA bonds
HESC
HSBC ETFs PLC - HSBC MSCI Emerging Markets Small Cap Screened UCITS ETFWeight
0.01%
Market value
3.72 K
USD
Explore more ETFs
Frequently Asked Questions
The current price of RENUKA is 25.11 INR — it has increased by 4.54% in the past 24 hours. Watch Shree Renuka Sugars Limited stock price performance more closely on the chart.
Depending on the exchange, the stock ticker may vary. For instance, on NSE exchange Shree Renuka Sugars Limited stocks are traded under the ticker RENUKA.
RENUKA stock has risen by 5.64% compared to the previous week, the month change is a −2.14% fall, over the last year Shree Renuka Sugars Limited has showed a −33.92% decrease.
RENUKA reached its all-time high on Jan 7, 2010 with the price of 123.50 INR, and its all-time low was 3.25 INR and was reached on Mar 24, 2020. View more price dynamics on RENUKA chart.
See other stocks reaching their highest and lowest prices.
See other stocks reaching their highest and lowest prices.
RENUKA stock is 7.11% volatile and has beta coefficient of 2.10. Track Shree Renuka Sugars Limited stock price on the chart and check out the list of the most volatile stocks — is Shree Renuka Sugars Limited there?
Today Shree Renuka Sugars Limited has the market capitalization of 51.15 B, it has increased by 4.15% over the last week.
Yes, you can track Shree Renuka Sugars Limited financials in yearly and quarterly reports right on TradingView.
RENUKA net income for the last quarter is −3.69 B INR, while the quarter before that showed −2.63 B INR of net income which accounts for −40.15% change. Track more Shree Renuka Sugars Limited financial stats to get the full picture.
No, RENUKA doesn't pay any dividends to its shareholders. But don't worry, we've prepared a list of high-dividend stocks for you.
As of Jan 30, 2026, the company has 2.18 K employees. See our rating of the largest employees — is Shree Renuka Sugars Limited on this list?
EBITDA measures a company's operating performance, its growth signifies an improvement in the efficiency of a company. Shree Renuka Sugars Limited EBITDA is 628.00 M INR, and current EBITDA margin is 3.69%. See more stats in Shree Renuka Sugars Limited financial statements.
Like other stocks, RENUKA shares are traded on stock exchanges, e.g. Nasdaq, Nyse, Euronext, and the easiest way to buy them is through an online stock broker. To do this, you need to open an account and follow a broker's procedures, then start trading. You can trade Shree Renuka Sugars Limited stock right from TradingView charts — choose your broker and connect to your account.
Investing in stocks requires a comprehensive research: you should carefully study all the available data, e.g. company's financials, related news, and its technical analysis. So Shree Renuka Sugars Limited technincal analysis shows the neutral today, and its 1 week rating is sell. Since market conditions are prone to changes, it's worth looking a bit further into the future — according to the 1 month rating Shree Renuka Sugars Limited stock shows the strong sell signal. See more of Shree Renuka Sugars Limited technicals for a more comprehensive analysis.
If you're still not sure, try looking for inspiration in our curated watchlists.
If you're still not sure, try looking for inspiration in our curated watchlists.