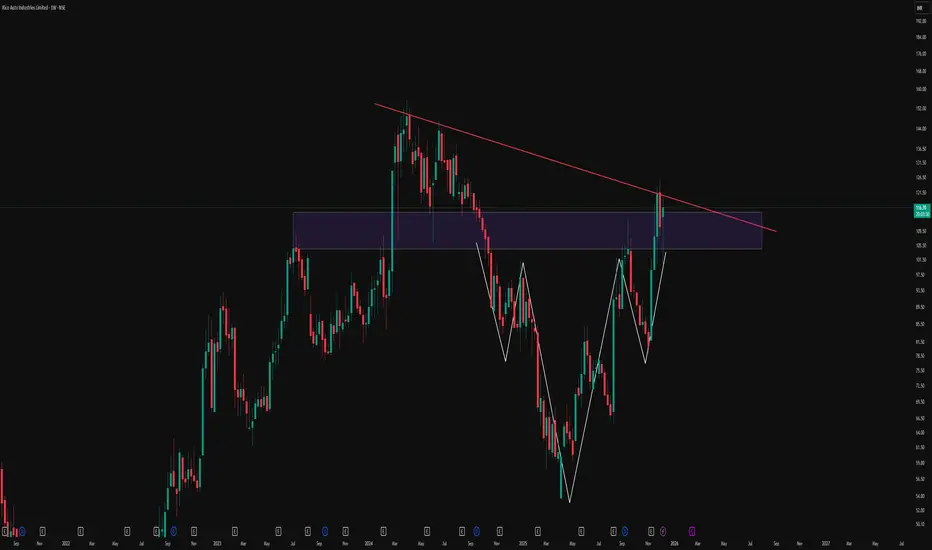
RICOAUTO 1 Week Time Frame 📊 Current Price Snapshot
The stock is trading around ₹115–₹122 range recently.
📈 Key Levels for 1-Week Time Frame
🔵 Resistance Levels (Upside Targets)
1. ~₹121–₹122 — Immediate resistance zone (short-term pivot region).
2. ~₹126–₹127 — Next resistance zone where sellers may appear.
3. ~₹129–₹132 —
Rico Auto Industries Limited
No trades
Next report date
—
Report period
—
EPS estimate
—
Revenue estimate
—
3.18 INR
214.00 M INR
22.12 B INR
65.89 M
About Rico Auto Industries Limited
Sector
Industry
CEO
Arvind Kapur
Website
Headquarters
Gurugram
Founded
1983
IPO date
Sep 18, 1995
Identifiers
2
ISIN INE209B01025
Rico Auto Industries Ltd. engages in the manufacturing and assembling of automotive components for the automotive industry. Its products include Oil Pump Assembly, Fuel System Parts, Lube Oil Filters Heads, Exhaust Manifolds, Turbine Housings, Center Housings, Back Plates, Crank Cases & Covers, Cylinder Head Covers, Oil Pan, Intake Manifold Covers, Front Cover, Valve Cover, Side Cover, Balance Shafts Assembly, Gear Housing, Main Bearing Caps, Water, Air Connections and Pressure Plates, Flywheels, Timing Cases, Oil Filter Adaptor, Engine Brackets, Cylinder Block Ferrous, Cylinder Head Aluminum, Clutch Assembly, Automatic Transmission Bracket Assembly, Differential Case Housings, Gear Shifts Forks, Wheel Hubs Assembly, Brake Panel Assembly, Brake Discs and Drums. The company was founded in 1984 and is headquartered in Gurugram, India.
Related stocks

RICOAUTO 1 Day Time Frame 📌 Current Daily Price Context
Yesterday’s intraday range was roughly ₹133.22 to ₹138.48.
The stock is trading near its 52-week high area (around ₹141.50).
📈 Daily Support & Resistance Levels
These levels are useful for short-term traders looking at 1-day candles:
💡 Immediate Resistance
~₹138–140

BUY TODAY SELL TOMORROW for 5%DON’T HAVE TIME TO MANAGE YOUR TRADES?
- Take BTST trades at 3:25 pm every day
- Try to exit by taking 4-7% profit of each trade
- SL can also be maintained as closing below the low of the breakout candle
Now, why do I prefer BTST over swing trades? The primary reason is that I have observed that

Reclaiming The Breakdown: Descending Triangle To Inverse HnSThis weekly chart of Rico Auto illustrates how structure can evolve over time and why rigid bias around a single pattern can be misleading. Price initially respected a clear descending trendline, forming a classic descending triangle and eventually breaking down below the support zone. Instead of co

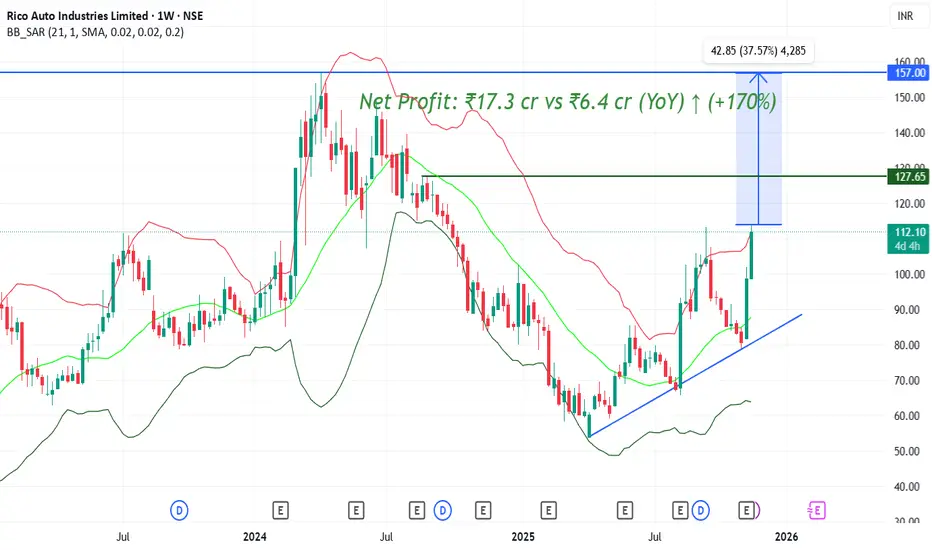
Rico Auto (D): Strongly Bullish, 20-Year BreakoutThis is a high-conviction, "blue-sky" breakout setup. The stock has shattered a resistance confluence that includes a 20-year-old horizontal ceiling . This technical move is powered by a massive fundamental turnaround in the recent quarter.
🚀 1. The Fundamental Catalyst (The "Why")
The breakout

#RICOAUTO Expecting Big Result awesome expecting Big ..next level 127 after that long term 150+++
Net Profit: ₹17.3 cr vs ₹6.4 cr (YoY) ↑ (+170%)
Revenue: ₹627 cr vs ₹575 cr (YoY) ↑ (+9%)
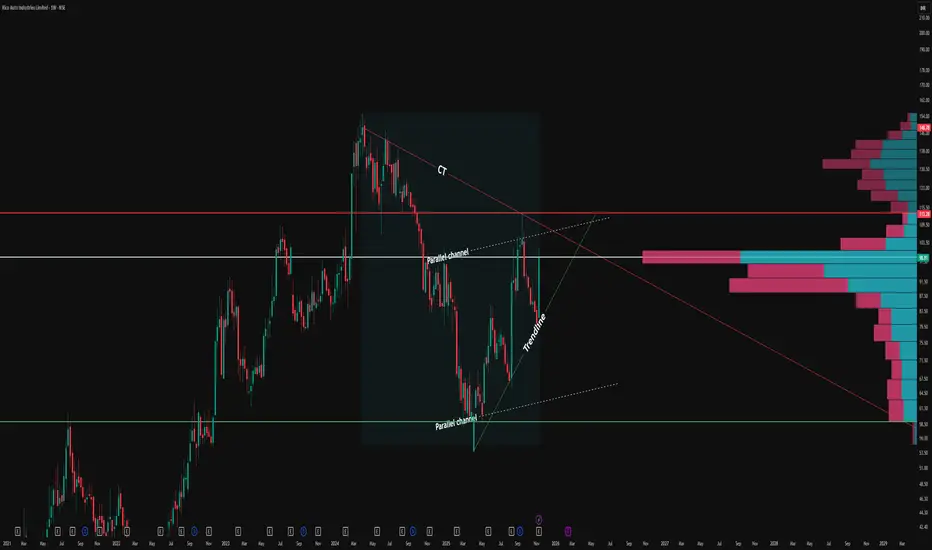
How Counter Trendlines and Parallel Channels Reveal Price StructThe CT (Counter Trendline) as the prime technical feature. The red CT line distinctly marks recurring lower high rejections, shaping significant supply pockets and creating low-liquidity price zones at every inflection point.
Each touch validates the CT’s relevance, highlighting how price is repea
BUY TODAY SELL TOMORROW for 5%DON’T HAVE TIME TO MANAGE YOUR TRADES?
- Take BTST trades at 3:25 pm every day
- Try to exit by taking 4-7% profit of each trade
- SL can also be maintained as closing below the low of the breakout candle
Now, why do I prefer BTST over swing trades? The primary reason is that I have observed that

Multi-Confirmation Price Action: Fibonacci Zones, Base BreakoutsExplore multi-confirmation techniques using Fibonacci retracement to identify high-probability base breakout zones. Learn how to spot double bottom and inverted head & shoulders patterns at demand levels and execute confirmation trades for precision entries

See all ideas
Summarizing what the indicators are suggesting.
Oscillators
Neutral
SellBuy
Strong sellStrong buy
Strong sellSellNeutralBuyStrong buy
Oscillators
Neutral
SellBuy
Strong sellStrong buy
Strong sellSellNeutralBuyStrong buy
Summary
Neutral
SellBuy
Strong sellStrong buy
Strong sellSellNeutralBuyStrong buy
Summary
Neutral
SellBuy
Strong sellStrong buy
Strong sellSellNeutralBuyStrong buy
Summary
Neutral
SellBuy
Strong sellStrong buy
Strong sellSellNeutralBuyStrong buy
Moving Averages
Neutral
SellBuy
Strong sellStrong buy
Strong sellSellNeutralBuyStrong buy
Moving Averages
Neutral
SellBuy
Strong sellStrong buy
Strong sellSellNeutralBuyStrong buy
Displays a symbol's price movements over previous years to identify recurring trends.
Frequently Asked Questions
The current price of RICOAUTO is 116.90 INR — it has decreased by −3.36% in the past 24 hours. Watch Rico Auto Industries Limited stock price performance more closely on the chart.
Depending on the exchange, the stock ticker may vary. For instance, on NSE exchange Rico Auto Industries Limited stocks are traded under the ticker RICOAUTO.
RICOAUTO stock has fallen by −1.61% compared to the previous week, the month change is a −12.53% fall, over the last year Rico Auto Industries Limited has showed a 40.93% increase.
RICOAUTO reached its all-time high on Apr 3, 2024 with the price of 157.00 INR, and its all-time low was 3.50 INR and was reached on Jan 5, 1999. View more price dynamics on RICOAUTO chart.
See other stocks reaching their highest and lowest prices.
See other stocks reaching their highest and lowest prices.
RICOAUTO stock is 3.95% volatile and has beta coefficient of 2.60. Track Rico Auto Industries Limited stock price on the chart and check out the list of the most volatile stocks — is Rico Auto Industries Limited there?
Today Rico Auto Industries Limited has the market capitalization of 16.27 B, it has decreased by −0.43% over the last week.
Yes, you can track Rico Auto Industries Limited financials in yearly and quarterly reports right on TradingView.
Rico Auto Industries Limited is going to release the next earnings report on Feb 18, 2026. Keep track of upcoming events with our Earnings Calendar.
RICOAUTO net income for the last quarter is 173.50 M INR, while the quarter before that showed 163.30 M INR of net income which accounts for 6.25% change. Track more Rico Auto Industries Limited financial stats to get the full picture.
Yes, RICOAUTO dividends are paid annually. The last dividend per share was 0.50 INR. As of today, Dividend Yield (TTM)% is 0.42%. Tracking Rico Auto Industries Limited dividends might help you take more informed decisions.
Rico Auto Industries Limited dividend yield was 0.83% in 2024, and payout ratio reached 31.61%. The year before the numbers were 0.41% and 21.17% correspondingly. See high-dividend stocks and find more opportunities for your portfolio.
As of Jan 29, 2026, the company has 6.31 K employees. See our rating of the largest employees — is Rico Auto Industries Limited on this list?
EBITDA measures a company's operating performance, its growth signifies an improvement in the efficiency of a company. Rico Auto Industries Limited EBITDA is 2.11 B INR, and current EBITDA margin is 9.11%. See more stats in Rico Auto Industries Limited financial statements.
Like other stocks, RICOAUTO shares are traded on stock exchanges, e.g. Nasdaq, Nyse, Euronext, and the easiest way to buy them is through an online stock broker. To do this, you need to open an account and follow a broker's procedures, then start trading. You can trade Rico Auto Industries Limited stock right from TradingView charts — choose your broker and connect to your account.
Investing in stocks requires a comprehensive research: you should carefully study all the available data, e.g. company's financials, related news, and its technical analysis. So Rico Auto Industries Limited technincal analysis shows the sell today, and its 1 week rating is buy. Since market conditions are prone to changes, it's worth looking a bit further into the future — according to the 1 month rating Rico Auto Industries Limited stock shows the buy signal. See more of Rico Auto Industries Limited technicals for a more comprehensive analysis.
If you're still not sure, try looking for inspiration in our curated watchlists.
If you're still not sure, try looking for inspiration in our curated watchlists.