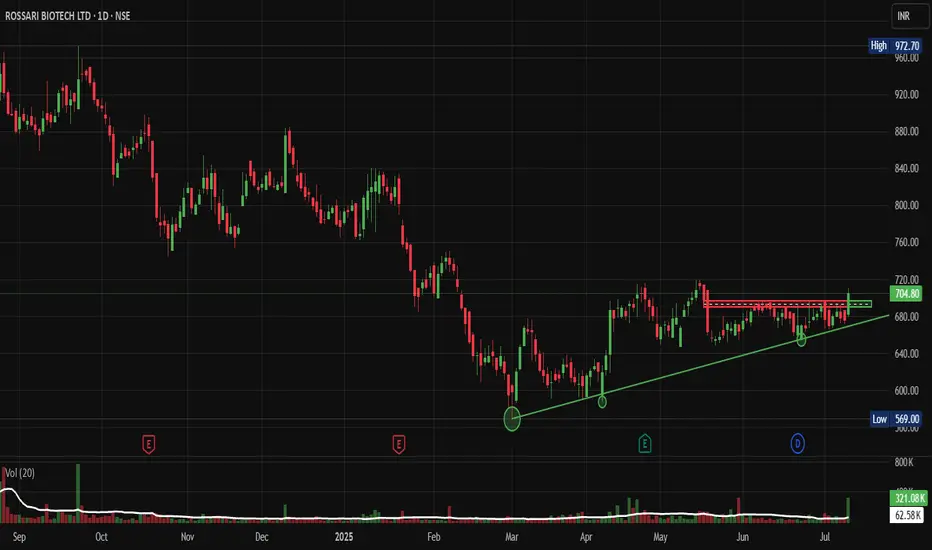
ROSSARI LONGThe Elliott Wave analysis indicates that the stock has finished waves (i) and is nearing the end of waves (ii), which are shown by blue numbers on the daily chart.
Wave (ii), also known as the corrective wave, unfolded in an a-b-c pattern, as indicated in red.
Wave c of wave (ii) is unfolding, and it is a buying opportunity on the downturn (dip).
The chart indicates that Wave c will end near the channel support.
Wave (3) will begin following the completion of wave (ii).
Wave (3) is expected to have around five subdivisions, which are highlighted in red.
Wave levels are depicted on the chart.
Level of Invalidation
The invalidation level of 536.35 has been identified as the starting point for wave (i). If the price falls below this level, it means that the projected Elliott Wave pattern is not as it appears.
I'm not a registered Sebi analyst. My research is done solely for academic purposes.
Please consult your financial advisor before trading or investing. I bear no responsibility for your profits or losses.
Regards, VJ.
Rossari Biotech Ltd
No trades
What traders are saying

Rossari: Ready to Break Out from Multi-Month ConsolidationNSE:ROSSARI : Hidden Gem Ready to Break Out from Multi-Month Consolidation - My Technical Analysis & Trade Setup on this beautiful Chart Structure
Price Action:
- Stock has been in a prolonged consolidation phase since March 2025, after a significant decline from highs near 970 levels
- Current price action shows the formation of a symmetrical triangle pattern with converging trend lines
- Recent price movement indicates a potential breakout attempt with increased volume participation
- The stock has found strong support around 580-600 levels and resistance near the 720-740 zone
Volume Spread Analysis:
Volume Characteristics:
- Volume has been declining during the consolidation phase, which is typical for triangle patterns
- Recent sessions show increasing volume participation, suggesting institutional interest
- Volume spike during recent upward movement indicates genuine buying interest
- Average volume appears to be around 300-400K shares, with recent pickup to 620K+
Volume Confirmation Signals:
- Higher volume on up days compared to down days in recent sessions
- Volume expansion during the recent breakout attempt
- Accumulation pattern visible in volume profile during base formation
Base Formation:
- Primary base formation: Large consolidation base formed between 580-740 levels over 7+ months
- Base characteristics: Symmetrical triangle with higher lows
- Base depth: Approximately 27% from resistance to support levels
- Time duration: An Extended 7-month base suggests a strong accumulation phase
Key Support and Resistance Levels:
- Immediate Support: 680-690 (recent swing low)
- Major Support: 580-600 (tested multiple times, strong buying interest)
- Immediate Resistance: 720-740 (upper trend line of triangle)
- Major Resistance: 800-820 (previous significant resistance zone)
- Ultimate Resistance: 900-920 (prior consolidation area)
Technical Patterns:
- Primary Pattern: Symmetrical Triangle
- Secondary Pattern: Potential Cup and Handle formation within the larger triangle
- Volume Pattern: Decreasing volume during consolidation with recent pickup suggesting breakout preparation
- Price compression: Narrowing price range indicates imminent directional move
Trade Setup:
Entry Strategy:
- Primary Entry: On breakout above 720-725 with volume confirmation
- Secondary Entry: On pullback to 700-705 levels after successful breakout
- Aggressive Entry: Current levels around 704-706 for risk-tolerant traders
Exit Levels:
- Target 1: 760-770 (measured move from triangle base)
- Target 2: 800-820 (previous resistance zone)
- Target 3: 860-880 (extended target based on base depth)
- Ultimate Target: 920-950 (full triangle breakout target)
Stop-Loss Strategy:
- Conservative Stop-Loss: Below 680 (recent swing low)
- Aggressive Stop-Loss: Below 695 (intraday support)
- Trailing Stop: Move to breakeven once Target 1 is achieved
Position Sizing:
- Risk per trade: Maximum 2% of portfolio
- Position size calculation: Based on stop-loss distance from entry
- For entry at 705 with stop at 680: Risk of 25 points allows for appropriate position sizing
- Recommended allocation: 3-5% of portfolio for medium-term holding
Risk Management:
- Maximum drawdown tolerance: 3-4% from entry point
- Partial profit booking at each target level (25% at each target)
- Trailing stop-loss implementation after achieving Target 1
- Time-based exit if no progress within 3-4 weeks
Sectoral and Fundamental Backdrop:
Sector Overview:
- The speciality chemicals sector is showing resilience in the current market conditions
- Increasing demand for sustainable and eco-friendly chemical solutions
- The government push for domestic manufacturing under PLI schemes
- Growing export opportunities in the speciality chemicals space
Company Fundamentals:
- Business Profile: Speciality chemicals manufacturer focusing on home, personal care, and fabric care segments
- Revenue Growth: Consistent growth trajectory in recent quarters
- Market Position: Strong presence in domestic market with expanding export footprint
- Product Portfolio: Diversified range of speciality chemicals and ingredients
Industry Tailwinds:
- Increasing consumer spending on personal care products
- Growing demand for sustainable and biodegradable chemical products
- Import substitution opportunities in speciality chemicals
- Rising per capita income is driving demand for quality personal care products
Fundamental Catalysts:
- New product launches and capacity expansions
- Strategic partnerships and collaborations
- Improving operational efficiency and margin expansion
- Strong balance sheet supporting growth investments
Risk Factors:
Technical Risks:
- Failure to sustain above 720 levels could lead to further consolidation
- Breakdown below 680 could trigger deeper correction to 600-620 levels
- Low liquidity may result in higher volatility during a breakout
Fundamental Risks:
- Raw material price inflation is impacting margins
- Competitive pressure from larger players
- Regulatory changes affecting product approvals
- Currency fluctuation impact on export revenues
My Take:
NSE:ROSSARI presents an attractive risk-reward setup with a well-defined technical pattern and strong fundamental backdrop. The extended consolidation phase suggests substantial energy is building up for the next directional move. With proper risk management and disciplined execution, this setup offers multiple target levels for profit booking while maintaining manageable downside risk.
Keep in the Watchlist.
NO RECO. For Buy/Sell.
📌Thank you for exploring my idea! I hope you found it valuable.
🙏FOLLOW for more
👍BOOST if you found it useful.
✍️COMMENT below with your views.
Meanwhile, check out my other stock ideas on the right side until this trade is activated. I would love your feedback.
Disclaimer: "I am not a SEBI REGISTERED RESEARCH ANALYST AND INVESTMENT ADVISER."
This analysis is intended solely for informational and educational purposes and should not be interpreted as financial advice. It is advisable to consult a qualified financial advisor or conduct thorough research before making investment decisions.
Rossari Biotech – Stage 4 Ending? Stage 1 Base in Play!🧪 NSE:ROSSARI – 📉 Stage 4 Ending? Stage 1 Base in Play!
🕵️♂️ Technical Context
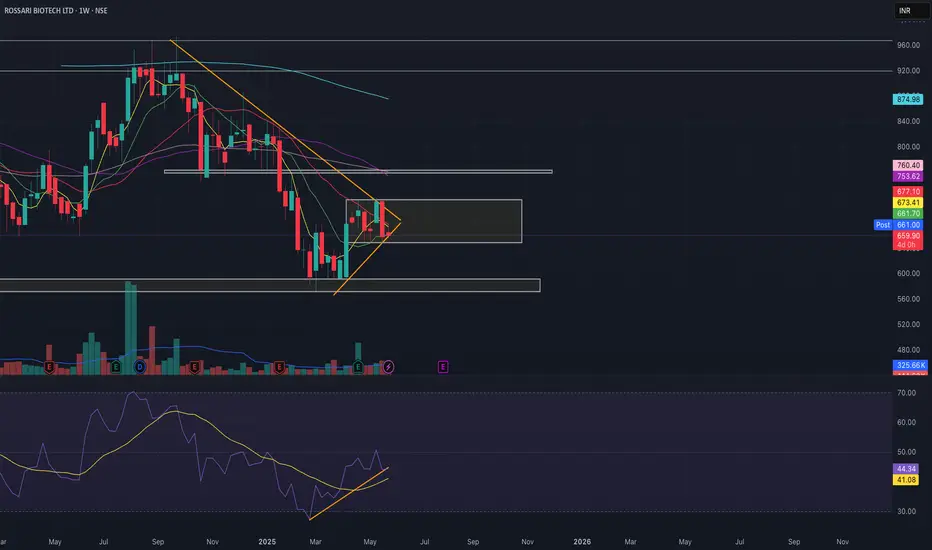
Rossari has been in a Stage 4 decline since its 2021 peak. But now it’s forming a solid Stage 1 base between ₹650–720, with signs of smart accumulation emerging.
🧩 Business Model Snapshot
🧵 Segments: Textile Chemicals, HPPC, Animal Nutrition
🛒 New Growth: Institutional & B2C (₹299 Cr, +67% YoY)
🌍 Markets: Strong domestic base, expanding in Middle East & SE Asia
🤝 Client Spread: Diversified, no over-reliance
🎙️ Management Commentary
⚙️ Focus on margin normalization across verticals
📊 Base EBITDA margin ~15% (excl. new segments)
🌐 FX risk control via new geographies (Egypt, Turkey, SE Asia)
🧱 Scaling up I&B2C as a future margin driver
📈 Trend Overview
📆 Monthly: Ending Stage 4 — beginning Stage 1 base
📉 Weekly: Consolidating in a tight rectangle ₹650–750
📅 Daily: Sideways movement; price hugging EMA — coiled for move
🔄 Volume: Subtle uptick — early sign of institutional interest
🧭 Indicators: MACD crossover possible, RSI turning positive
🎯 Trade Plan
💼 Accumulation Zone: ₹650–720
🔓 Breakout Buy: ₹750+ (weekly close + volume)
⛔ Stop-loss: ₹640
🎯 Targets: ₹900 → ₹1,100
📈 Risk-Reward: Up to 1:4.5 🚀
📊 Fundamental Edge
💰 FY25 Revenue: ₹2,080 Cr
🧼 Expanding B2C + Institutional verticals
🏗️ ₹192 Cr CapEx in progress
💹 ROE: ~13%, OPM: ~10%
🧾 Clean governance, no pledges
🟢 Momentum Score: 7/10
📉 Stage 1 base + rising volume
📊 Solid growth fundamentals
🧠 FX/geography risk being managed
📍 NSE: ROSSARI | Sector: Specialty Chemicals
⏳ Watch ₹720 breakout zone – Big move may be coming!
#Rossari #BreakoutStocks #StageAnalysis #SwingTrade #SmartMoney #TechFundamentals #TradingView #SpecialtyChemicals #IndiaEquity #finchoicebiz #markethunt

Rossari Biotech Long setup 1:5 RR (Textile chemical sector)
Buy Rossari Biotech long setup
Between 700-710
Stop loss: 665
Target 1: 765
Target 2: 830
Target 3: 862
Trade as per your risk-taking capacity.
Triangle Pattern and trend line breakout with volume
They are among the largest manufacturers of textile specialty chemicals in India.
If US-India trade deal benefits textile sector, this will start running.

Rossari Biotech ready to give a 100 points upmoveTriangle pattern formation in W plus Flag pattern formation indicative of consolidation
RSI divergence, waiting for strength to catch up, facing a lot of resistance at 680.
SL at 640 with a target of 760
Rossari Biotech - Bullish FlagA good Flag Breakout
Fundamentally also the stock looks strong.
Breakout above 705
SL 680
Pattern Breakout Target : 805

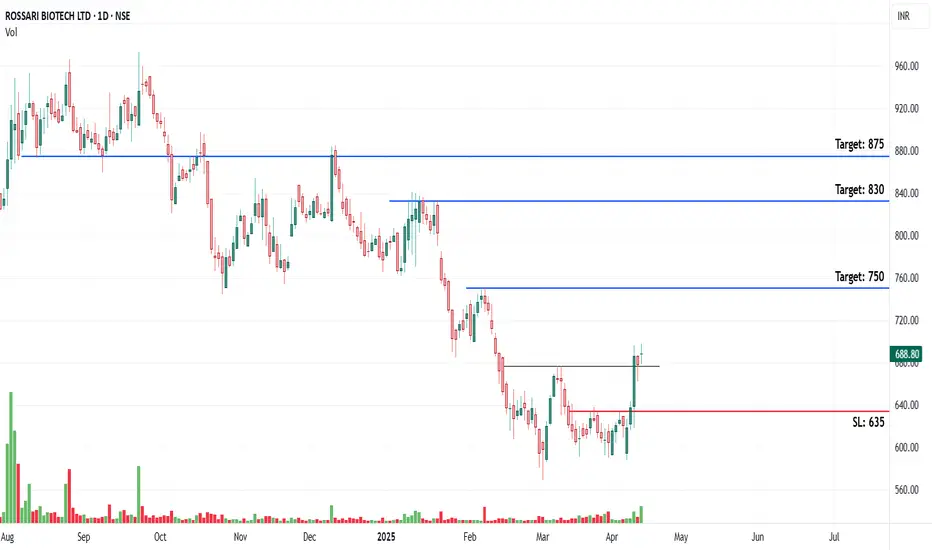
Double bottom breakout in ROSSARIChart -> ROSSARI Daily
CMP: 688
Good Range to Buy: 650 to 690
Targets: 750, 830, 875
SL: 635 Daily Close
Disclaimer: This is for educational purposes only, not any recommendations to buy or sell. As I am not SEBI registered, please consult your financial advisor before taking any action.
Rossari Biotech Ltd - Bullish WeeklyStock getting close to Weekly Demand Zone. and Bounce back expected.
Good Point of Entry 700-710
Target 754/802

ROSSARI BIOTECH - Rounding bottom with fresh volumesRounding bottom with fresh volumes.
Targets(T1, T2, T3 & T4) mentioned along with expected time frames. Stop loss marked as SL. Can achieve better targets, should carry trailing stop loss once in good gains.
Also keep tracking quarterly results to monitor performance.

ROSSARI Long Idea.............ROSSARI BIOTECH looks good from chart.
Stoploss and Targets are given in chart.
It is also a good swing trade which is taking support near 44ema.
Should Plan trade with proper risk management.
NOTE : It is just Technical chart analysis of ROSSARI. No idea about company fundamentals.

ROSSARI - Weekly AnalysisIn the Weekly Chart of ROSSARI ,
we can see that, it is at a Decision Making point.
Possible momentums are shown in chart.

Turnaround Story -Rossari BiotechBase formation, looks bullish
Target for doubling from here.
Keep on radar

Rossari Biotech-A reversal in yet another chemical sector stock?Rossari Biotech has given a breakout of horizontal resistance of around 890-900 is sustaining above it.
Stock is looking attractive for good reversal and might reach its ATH in medium term if broader markets are supportive. However, there is an immediate resistance near 1000 as well.
As we have seen this week, there are lot of global tensions leading to high market volatility.
Focus on managing your risk and saving your capital.

Rossari Biotech - Golden Cross overGolden Cross Over
Rising RSI > 60
Fundamentally Strong
Overall Indian Chemical Industry is improving.
Targets : 840/872/911
SL : 790 (Will Trail with SL)
(Enter trade only if market sustain green)

Symmetrical Triangle Pattern Breakout seen in Rossari BiotechHello Everyone, i have brought a stock which has given breakout of symmetrical triangle pattern and price is sustaining above the breakout price, stock name is Rossari Biotech Ltd, and it was started in 2003. They are among the largest manufacturers of textile specialty chemicals in India.
Their 3 main product categories are:-
- Home, personal care, and performance chemicals
- Textile specialty chemical
- Animal health and nutrition
The company has two R&D facilities , one at Silvassa manufacturing facility and a research lab at IIT Bombay.
We know chemical sector is not performing well from long back, but prices are suggesting in many chemical stocks that, we can see rally very soon. Well best time to enter in any sector or stock is only when there is fear in sector or market. So this can be right time to enter and accumulate as much as possible in down levels, we might never gonna to see these prices again. Stock is trading almost 50% discount from all time all time highs. If someone is thinking to take and hold for long term, then i think right choice dude.
Company Overview
Rossari Biotech is a Specialty-Chemicals manufacturer offering solutions for Home, Personal Care and Performance chemicals (HPPC), Textile specialty chemicals (TSC) and Animal Health and Nutrition (AHN). It offers a total of 4220+ products catering to an array of applications across FMCG, Home care, Industrial Cleaning, Personal Care, Textile, Performance Chemicals, Animal Health and Nutrition and Pet Care businesses.
Market Cap
₹ 4,467 Cr.
Current Price
₹ 809
High / Low
₹ 904 / 657
Stock P/E
34.2
Book Value
₹ 190
Dividend Yield
0.07 %
ROCE
18.3 %
ROE
13.3 %
Face Value
₹ 2.00
Industry PE
38.6
Debt
₹ 119 Cr.
EPS
₹ 23.7
Promoter holding
68.3 %
Intrinsic Value
₹ 590
Pledged percentage
0.00 %
EVEBITDA
17.7
Change in Prom Hold
-0.01 %
Profit Var 5Yrs
23.3 %
Sales growth 5Years
28.8 %
Return over 5years
%
Debt to equity
0.11
Net profit
₹ 131 Cr.
ROE 5Yr
16.0 %
Profit growth
22.1 %
Disclaimer:- Please always do your own analysis or consult with your financial advisor before taking any kind of trades.
Dear traders, If you like my work then do not forget to hit like and follow me, and guy's let me know what do you think about this idea in comment box, i would be love to reply all of you guy's.
Thankyou.

ROSSARI BIOTECH : A good bottomed out stock📈 ROSSARI BIOTECH has bottomed out with a breakout of previous monthly highs.
🔰 It can rise upto 15% to 50% from the current levels of 900
🟢 Range : 880 to 900
🎯 Target : 1040 / 1200 / 1500
🛑 Stop : below 750 (wcb)
⚠️ Disclaimer : it's not a buy/sell recommendation. It is only for the educational purposes.

Rossari BiotechClean breakout with good pattern and volume. The stoploss is minimal and the breakout looks promising.

Rossari "Fresh breakout"Hello 👋
One more breakout stock
It's "Rossari biotech"
Higher tf stock has broken resistance of 920 and closed above 900 which is positive..
Huge volumes in last week. Momentum inclined. HH & HL
Have marked levels on chart..
It's my view. Plz DYOA. No buy/sell recommendation🙏.
Plz boost my idea if you find it useful.
Thank you.


Rossari Biotech - Best above 922. SL - 800Rossari Biotech - A Textile Chemical co.
Tailwind in both Textile and Chemicals is seen in this stock.
One can enter above 922 and some around 850 (if it falls)
Stop Loss - 800
Disclaimer : Educational content. Please do your own research.

#ROSSARI Rossari Biotech has shown promising growth and potential, making it an interesting option for investment. Here are some solid reasons to consider buying Rossari Biotech and insights into their future plans and growth:
Reasons to Buy Rossari Biotech:
1. Strong Financial Performance: Rossari Biotech has consistently shown strong financial results. For instance, their Q4 2024 financial results indicated significant growth in Profit Before Tax (PBT) and Profit After Tax (PAT)².
2. Earnings and Revenue Growth : The company is forecasted to grow its earnings by 21.4% and revenue by 14.4% per annum¹. This growth rate is higher than the average market growth, indicating robust performance.
3. Innovative and Sustainable Solutions: Rossari Biotech focuses on innovative and sustainable solutions, which positions them well to capitalize on market opportunities⁴.
4. Expanding Manufacturing Capacities: The company is expanding its manufacturing capacities, which promises further growth in the coming quarters⁴.
Future Plans and Growth:
1. Revenue and EBITDA Growth: Rossari Biotech is forecasting a 10-12% growth in both revenues and EBITDA for the financial year 2025⁵.
2. **Robust R&D Framework** : The company has a strong R&D framework, which supports its growth in both domestic and international markets³.
3. **Diverse Product Portfolio**: Rossari Biotech's diverse product portfolio across various sectors like specialty chemicals, textiles, and animal health provides multiple growth avenues³.
SHORT TERM TARGET
900. 1050, 1246++
POSITIONAL TARGET:
1050, 1334, 1459. 1700++

Rossari Biotech, weekly, prebrekout with volume built up.Forming a base on weekly chart, volumes are up. Retracing and taking support on EMA20. Long position can be taken at 820 for the targets of 910 and 980.

long rossari above (853 1 day closing)swing / positional trade in rossari biotech after downtrend channel 2nd breakout which is long above 853 levels closing in daily timeframe
1st target is 1025 levels
2nd target is 1250 levels
